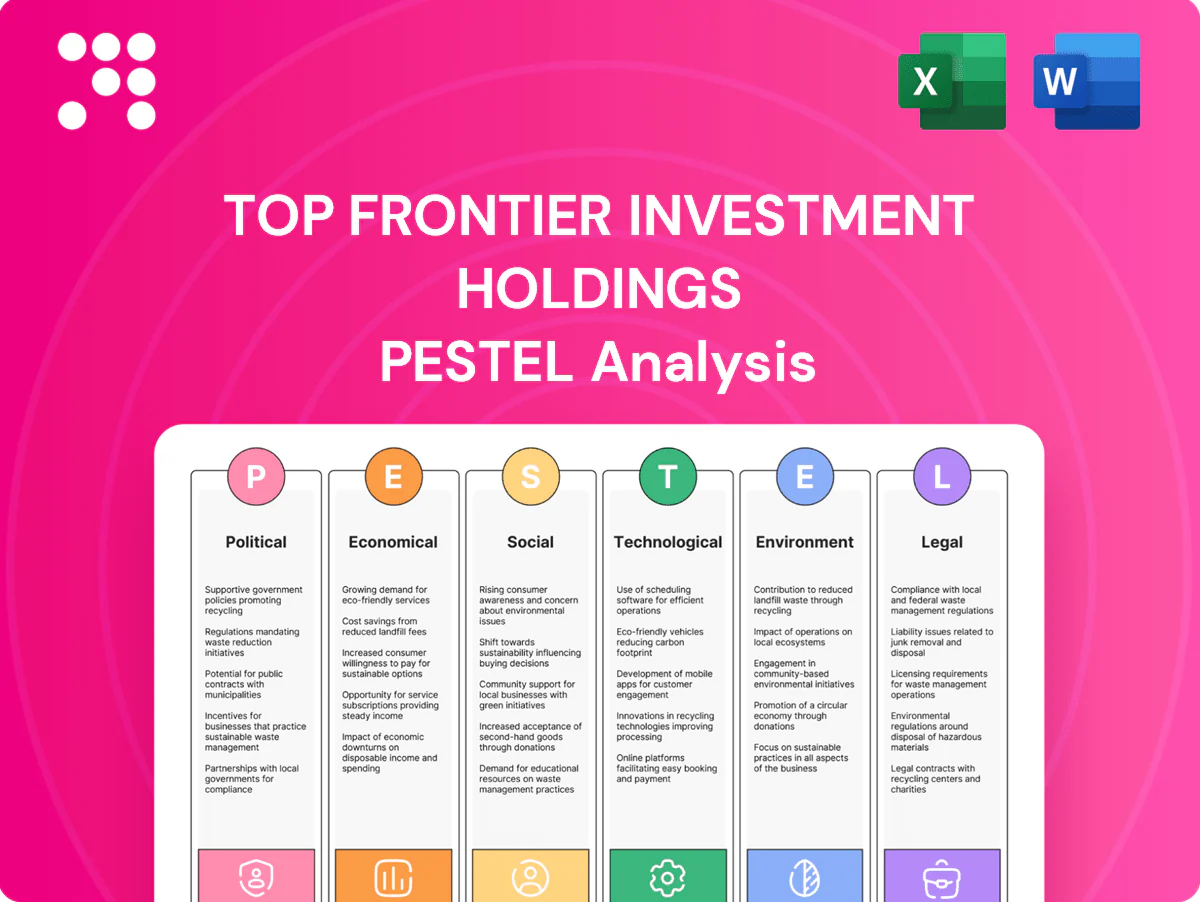
Top Frontier Investment Holdings PESTLE Analysis

Plan Smarter. Present Sharper. Compete Stronger.
Unlock strategic advantage with our PESTLE Analysis of Top Frontier Investment Holdings—three to five expert-level insights into political, economic, social, technological, legal, and environmental forces shaping its future. Designed for investors and strategists, this concise briefing reveals risks and growth levers you can't ignore. Purchase the full report to get the complete, editable analysis and actionable recommendations.
Political factors

Policy stability and election cycles
National and local election outcomes (notably the 2022 national vote and upcoming 2025 polls) shape infrastructure approvals, energy pricing rules and fiscal priorities. Policy continuity directly affects concession renewals and tariffs for toll roads, airports and power concessions. Cabinet reshuffles have historically altered the regulatory pace for fuel and oil. TFIH’s exposure via San Miguel Corporation diversifies cash flows but does not eliminate policy swing risk.
Infrastructure and PPP priorities
Government PPP frameworks and hybrid financing shape project pipelines and returns, with global PPP commitments near $60 billion in 2023 influencing deal flow into 2024–25. Concession terms, right-of-way enforcement, and toll-adjustment mechanisms directly drive cash flows and valuation volatility for capex-heavy assets. Budget reallocations can fast-track or stall projects, while strong alignment with national infrastructure programs (e.g., multi-year NIP plans totaling trillions in target spend) improves bankability.

Energy and fuel regulation
Energy mix targets (many jurisdictions aim for 30–50% renewables by 2030) plus market liberalization and occasional wholesale pricing caps materially compress power and fuel margins and change dispatch economics.
Excise taxes and biofuel blending mandates (typical blends 5–20%) raise downstream costs and cap refinery margins in year-on-year comparisons.
Permitting timelines commonly stretch 2–4 years, creating politically sensitive delays; stable, transparent rules measurably reduce earnings volatility across power and fuel segments.

Geopolitical and trade dynamics
Regional tensions, notably Red Sea incidents in 2023–24, raised rerouting and insurance surcharges up to ~30–40%, disrupting commodity and fuel imports; ASEAN trade rules and CPTPP/RCEP links shape packaging and food-input tariffs and supply chains tied to roughly $2.9 trillion regional trade (2023). Foreign investment sentiment—ASEAN FDI around $170–190bn in 2023—drives capital for large projects; diversified sourcing and FX/commodity hedges reduce shock exposure.
- Shipping surcharges ~30–40%
- ASEAN trade ≈ $2.9T (2023)
- ASEAN FDI ≈ $170–190B (2023)
- Diversified sourcing & hedging = lower shock risk
Local governance and community relations
Provincial and city-level approvals are often decisive for plants, depots and toll roads, with project permits and right-of-way clearances determining go/no-go timing. Community consent affects timelines and operating licenses and can trigger delays or additional mitigation costs. Political patronage risks are mitigated through structured stakeholder engagement and transparency; stable local relationships lower disruption risk and cost overruns.
- Permits: local approvals determine project start
- Community: consent shapes license timing
- Patronage: stakeholder engagement reduces risk
- Stability: strong local ties cut disruption and overruns
Election cycles, policy shifts and PPPs ($60B) heighten tariff and import risks
Election cycles and cabinet reshuffles drive tariff, concession and permitting risk; PPP pipelines (global PPP near $60B in 2023) and national NIP spending boost bankability. Energy policy shifts (renewables 30–50% by 2030) and excise/biofuel mandates compress margins. Regional trade/risks: ASEAN trade ≈ $2.9T (2023), ASEAN FDI ≈ $170–190B (2023); shipping surcharges 30–40% raise import costs.
| Metric | Value |
|---|---|
| Global PPP (2023) | $60B |
| ASEAN trade (2023) | $2.9T |
| ASEAN FDI (2023) | $170–190B |
| Shipping surcharges (2023–24) | 30–40% |
| Renewables target (2030) | 30–50% |
What is included in the product
 Detailed Word Document
Explores how macro-environmental forces uniquely impact Top Frontier Investment Holdings across Political, Economic, Social, Technological, Environmental, and Legal dimensions, with data-driven examples and region-specific context. Designed for executives and investors, the analysis highlights risks, opportunities, and forward-looking implications to inform strategic planning and funding decisions.

 Customizable Excel Spreadsheet
A concise PESTLE snapshot of Top Frontier Investment Holdings that highlights regulatory, economic, social, technological, environmental and political factors for quick meeting reference; editable notes enable tailoring to region or business line, aiding rapid alignment and focused risk discussions.
Economic factors

Philippine GDP growth and consumption
Household spending drives food and beverage demand and fuels retail volumes—household consumption accounted for roughly 70% of GDP while the Philippines posted about 5.6% GDP growth in 2024 (PSA/IMF). Infrastructure cycles follow public capex and private investment trends, with public capex near 4.5% of GDP in 2024 supporting construction and packaging demand. Broad-based growth sustains packaging volumes; a slowdown compresses volumes across the portfolio simultaneously.
Inflation and input costs
Commodity swings—often 10–30% in 2024 across grains, sugar, aluminum, resin and crude (Brent averaged roughly $90/bbl in 2024)—directly squeeze margins; pricing power and product mix determine pass-through success. Energy costs, constituting roughly 10–15% of manufacturing COGS, raise logistics and production risk. Effective procurement and hedging are critical to stabilize earnings.

Interest rates and credit conditions
Higher rates (US fed funds 5.25–5.50% and 10y Treasury ~4.2% mid‑2025) raise financing costs for capital‑intensive energy and infra projects, squeezing returns. Shorter refinancing windows and shorter tenor worsen cash‑flow coverage ratios. Tight credit markets can delay expansions or M&A, while strong balance‑sheet metrics preserve investment‑grade funding access.

Currency volatility (PHP/USD)
Currency volatility in PHP/USD (around 56–57 PHP per USD in mid‑2025) pressures Top Frontier through imported inputs and dollar‑linked fuel, directly hitting margins and earnings.
USD‑denominated debt and planned capex require natural or financial hedges to avoid balance‑sheet strain; active FX management helps protect dividends and coverage ratios.
Peso depreciation can boost export competitiveness for packaging but squeezes domestic consumer spending.
- Imported inputs: FX exposure
- USD debt/capex: need hedges
- Depreciation: export edge vs consumer squeeze
- Active FX risk management: preserves dividends
Global commodity cycles
- Oil: Brent ~88 USD/bbl (2024) — impacts fuel spreads & power costs
- Agriculture: FAO index -3% (2024) — alters food margins & inventories
- Construction: steel/cement ≈ -10% (2024) — eases infra capex
- Diversification: reduces but does not eliminate cyclicality
Election cycles, policy shifts and PPPs ($60B) heighten tariff and import risks
Domestic demand (household consumption ~70% of GDP; 2024 GDP +5.6%) and public capex (~4.5% of GDP in 2024) sustain volumes but leave exposure to cycles. Commodity swings (10–30% in 2024) and energy costs (~10–15% of COGS) compress margins; pricing power and hedges drive pass‑through. FX and rates (PHP/USD ~56–57 mid‑2025; US fed funds 5.25–5.50%) raise financing and import costs.
| Indicator | Value |
|---|---|
| Philippine GDP growth (2024) | +5.6% |
| Public capex (2024) | ~4.5% GDP |
| Brent (2024) | ~$88/bbl |
| PHP/USD (mid‑2025) | 56–57 |
| Fed funds (mid‑2025) | 5.25–5.50% |
Preview the Actual Deliverable
Top Frontier Investment Holdings PESTLE Analysis
This preview is the exact Top Frontier Investment Holdings PESTLE Analysis you’ll receive after purchase—fully formatted and ready to use. It contains the complete political, economic, social, technological, legal, and environmental assessment as shown. No placeholders or teasers—this is the final, professionally structured file. After checkout you’ll instantly download the same document displayed here.

Plan Smarter. Present Sharper. Compete Stronger.
Unlock strategic advantage with our PESTLE Analysis of Top Frontier Investment Holdings—three to five expert-level insights into political, economic, social, technological, legal, and environmental forces shaping its future. Designed for investors and strategists, this concise briefing reveals risks and growth levers you can't ignore. Purchase the full report to get the complete, editable analysis and actionable recommendations.
Political factors
Policy stability and election cycles
National and local election outcomes (notably the 2022 national vote and upcoming 2025 polls) shape infrastructure approvals, energy pricing rules and fiscal priorities. Policy continuity directly affects concession renewals and tariffs for toll roads, airports and power concessions. Cabinet reshuffles have historically altered the regulatory pace for fuel and oil. TFIH’s exposure via San Miguel Corporation diversifies cash flows but does not eliminate policy swing risk.
Infrastructure and PPP priorities
Government PPP frameworks and hybrid financing shape project pipelines and returns, with global PPP commitments near $60 billion in 2023 influencing deal flow into 2024–25. Concession terms, right-of-way enforcement, and toll-adjustment mechanisms directly drive cash flows and valuation volatility for capex-heavy assets. Budget reallocations can fast-track or stall projects, while strong alignment with national infrastructure programs (e.g., multi-year NIP plans totaling trillions in target spend) improves bankability.
Energy and fuel regulation
Energy mix targets (many jurisdictions aim for 30–50% renewables by 2030) plus market liberalization and occasional wholesale pricing caps materially compress power and fuel margins and change dispatch economics.
Excise taxes and biofuel blending mandates (typical blends 5–20%) raise downstream costs and cap refinery margins in year-on-year comparisons.
Permitting timelines commonly stretch 2–4 years, creating politically sensitive delays; stable, transparent rules measurably reduce earnings volatility across power and fuel segments.
Geopolitical and trade dynamics
Regional tensions, notably Red Sea incidents in 2023–24, raised rerouting and insurance surcharges up to ~30–40%, disrupting commodity and fuel imports; ASEAN trade rules and CPTPP/RCEP links shape packaging and food-input tariffs and supply chains tied to roughly $2.9 trillion regional trade (2023). Foreign investment sentiment—ASEAN FDI around $170–190bn in 2023—drives capital for large projects; diversified sourcing and FX/commodity hedges reduce shock exposure.
- Shipping surcharges ~30–40%
- ASEAN trade ≈ $2.9T (2023)
- ASEAN FDI ≈ $170–190B (2023)
- Diversified sourcing & hedging = lower shock risk
Local governance and community relations
Provincial and city-level approvals are often decisive for plants, depots and toll roads, with project permits and right-of-way clearances determining go/no-go timing. Community consent affects timelines and operating licenses and can trigger delays or additional mitigation costs. Political patronage risks are mitigated through structured stakeholder engagement and transparency; stable local relationships lower disruption risk and cost overruns.
- Permits: local approvals determine project start
- Community: consent shapes license timing
- Patronage: stakeholder engagement reduces risk
- Stability: strong local ties cut disruption and overruns
Election cycles, policy shifts and PPPs ($60B) heighten tariff and import risks
Election cycles and cabinet reshuffles drive tariff, concession and permitting risk; PPP pipelines (global PPP near $60B in 2023) and national NIP spending boost bankability. Energy policy shifts (renewables 30–50% by 2030) and excise/biofuel mandates compress margins. Regional trade/risks: ASEAN trade ≈ $2.9T (2023), ASEAN FDI ≈ $170–190B (2023); shipping surcharges 30–40% raise import costs.
| Metric | Value |
|---|---|
| Global PPP (2023) | $60B |
| ASEAN trade (2023) | $2.9T |
| ASEAN FDI (2023) | $170–190B |
| Shipping surcharges (2023–24) | 30–40% |
| Renewables target (2030) | 30–50% |
What is included in the product
Detailed Word Document
Explores how macro-environmental forces uniquely impact Top Frontier Investment Holdings across Political, Economic, Social, Technological, Environmental, and Legal dimensions, with data-driven examples and region-specific context. Designed for executives and investors, the analysis highlights risks, opportunities, and forward-looking implications to inform strategic planning and funding decisions.
Customizable Excel Spreadsheet
A concise PESTLE snapshot of Top Frontier Investment Holdings that highlights regulatory, economic, social, technological, environmental and political factors for quick meeting reference; editable notes enable tailoring to region or business line, aiding rapid alignment and focused risk discussions.
Economic factors
Philippine GDP growth and consumption
Household spending drives food and beverage demand and fuels retail volumes—household consumption accounted for roughly 70% of GDP while the Philippines posted about 5.6% GDP growth in 2024 (PSA/IMF). Infrastructure cycles follow public capex and private investment trends, with public capex near 4.5% of GDP in 2024 supporting construction and packaging demand. Broad-based growth sustains packaging volumes; a slowdown compresses volumes across the portfolio simultaneously.
Inflation and input costs
Commodity swings—often 10–30% in 2024 across grains, sugar, aluminum, resin and crude (Brent averaged roughly $90/bbl in 2024)—directly squeeze margins; pricing power and product mix determine pass-through success. Energy costs, constituting roughly 10–15% of manufacturing COGS, raise logistics and production risk. Effective procurement and hedging are critical to stabilize earnings.
Interest rates and credit conditions
Higher rates (US fed funds 5.25–5.50% and 10y Treasury ~4.2% mid‑2025) raise financing costs for capital‑intensive energy and infra projects, squeezing returns. Shorter refinancing windows and shorter tenor worsen cash‑flow coverage ratios. Tight credit markets can delay expansions or M&A, while strong balance‑sheet metrics preserve investment‑grade funding access.
Currency volatility (PHP/USD)
Currency volatility in PHP/USD (around 56–57 PHP per USD in mid‑2025) pressures Top Frontier through imported inputs and dollar‑linked fuel, directly hitting margins and earnings.
USD‑denominated debt and planned capex require natural or financial hedges to avoid balance‑sheet strain; active FX management helps protect dividends and coverage ratios.
Peso depreciation can boost export competitiveness for packaging but squeezes domestic consumer spending.
- Imported inputs: FX exposure
- USD debt/capex: need hedges
- Depreciation: export edge vs consumer squeeze
- Active FX risk management: preserves dividends
Global commodity cycles
- Oil: Brent ~88 USD/bbl (2024) — impacts fuel spreads & power costs
- Agriculture: FAO index -3% (2024) — alters food margins & inventories
- Construction: steel/cement ≈ -10% (2024) — eases infra capex
- Diversification: reduces but does not eliminate cyclicality
Election cycles, policy shifts and PPPs ($60B) heighten tariff and import risks
Domestic demand (household consumption ~70% of GDP; 2024 GDP +5.6%) and public capex (~4.5% of GDP in 2024) sustain volumes but leave exposure to cycles. Commodity swings (10–30% in 2024) and energy costs (~10–15% of COGS) compress margins; pricing power and hedges drive pass‑through. FX and rates (PHP/USD ~56–57 mid‑2025; US fed funds 5.25–5.50%) raise financing and import costs.
| Indicator | Value |
|---|---|
| Philippine GDP growth (2024) | +5.6% |
| Public capex (2024) | ~4.5% GDP |
| Brent (2024) | ~$88/bbl |
| PHP/USD (mid‑2025) | 56–57 |
| Fed funds (mid‑2025) | 5.25–5.50% |
Preview the Actual Deliverable
Top Frontier Investment Holdings PESTLE Analysis
This preview is the exact Top Frontier Investment Holdings PESTLE Analysis you’ll receive after purchase—fully formatted and ready to use. It contains the complete political, economic, social, technological, legal, and environmental assessment as shown. No placeholders or teasers—this is the final, professionally structured file. After checkout you’ll instantly download the same document displayed here.
Description
Plan Smarter. Present Sharper. Compete Stronger.
Unlock strategic advantage with our PESTLE Analysis of Top Frontier Investment Holdings—three to five expert-level insights into political, economic, social, technological, legal, and environmental forces shaping its future. Designed for investors and strategists, this concise briefing reveals risks and growth levers you can't ignore. Purchase the full report to get the complete, editable analysis and actionable recommendations.
Political factors
Policy stability and election cycles
National and local election outcomes (notably the 2022 national vote and upcoming 2025 polls) shape infrastructure approvals, energy pricing rules and fiscal priorities. Policy continuity directly affects concession renewals and tariffs for toll roads, airports and power concessions. Cabinet reshuffles have historically altered the regulatory pace for fuel and oil. TFIH’s exposure via San Miguel Corporation diversifies cash flows but does not eliminate policy swing risk.
Infrastructure and PPP priorities
Government PPP frameworks and hybrid financing shape project pipelines and returns, with global PPP commitments near $60 billion in 2023 influencing deal flow into 2024–25. Concession terms, right-of-way enforcement, and toll-adjustment mechanisms directly drive cash flows and valuation volatility for capex-heavy assets. Budget reallocations can fast-track or stall projects, while strong alignment with national infrastructure programs (e.g., multi-year NIP plans totaling trillions in target spend) improves bankability.
Energy and fuel regulation
Energy mix targets (many jurisdictions aim for 30–50% renewables by 2030) plus market liberalization and occasional wholesale pricing caps materially compress power and fuel margins and change dispatch economics.
Excise taxes and biofuel blending mandates (typical blends 5–20%) raise downstream costs and cap refinery margins in year-on-year comparisons.
Permitting timelines commonly stretch 2–4 years, creating politically sensitive delays; stable, transparent rules measurably reduce earnings volatility across power and fuel segments.
Geopolitical and trade dynamics
Regional tensions, notably Red Sea incidents in 2023–24, raised rerouting and insurance surcharges up to ~30–40%, disrupting commodity and fuel imports; ASEAN trade rules and CPTPP/RCEP links shape packaging and food-input tariffs and supply chains tied to roughly $2.9 trillion regional trade (2023). Foreign investment sentiment—ASEAN FDI around $170–190bn in 2023—drives capital for large projects; diversified sourcing and FX/commodity hedges reduce shock exposure.
- Shipping surcharges ~30–40%
- ASEAN trade ≈ $2.9T (2023)
- ASEAN FDI ≈ $170–190B (2023)
- Diversified sourcing & hedging = lower shock risk
Local governance and community relations
Provincial and city-level approvals are often decisive for plants, depots and toll roads, with project permits and right-of-way clearances determining go/no-go timing. Community consent affects timelines and operating licenses and can trigger delays or additional mitigation costs. Political patronage risks are mitigated through structured stakeholder engagement and transparency; stable local relationships lower disruption risk and cost overruns.
- Permits: local approvals determine project start
- Community: consent shapes license timing
- Patronage: stakeholder engagement reduces risk
- Stability: strong local ties cut disruption and overruns
Election cycles, policy shifts and PPPs ($60B) heighten tariff and import risks
Election cycles and cabinet reshuffles drive tariff, concession and permitting risk; PPP pipelines (global PPP near $60B in 2023) and national NIP spending boost bankability. Energy policy shifts (renewables 30–50% by 2030) and excise/biofuel mandates compress margins. Regional trade/risks: ASEAN trade ≈ $2.9T (2023), ASEAN FDI ≈ $170–190B (2023); shipping surcharges 30–40% raise import costs.
| Metric | Value |
|---|---|
| Global PPP (2023) | $60B |
| ASEAN trade (2023) | $2.9T |
| ASEAN FDI (2023) | $170–190B |
| Shipping surcharges (2023–24) | 30–40% |
| Renewables target (2030) | 30–50% |
What is included in the product
Detailed Word Document
Explores how macro-environmental forces uniquely impact Top Frontier Investment Holdings across Political, Economic, Social, Technological, Environmental, and Legal dimensions, with data-driven examples and region-specific context. Designed for executives and investors, the analysis highlights risks, opportunities, and forward-looking implications to inform strategic planning and funding decisions.
Customizable Excel Spreadsheet
A concise PESTLE snapshot of Top Frontier Investment Holdings that highlights regulatory, economic, social, technological, environmental and political factors for quick meeting reference; editable notes enable tailoring to region or business line, aiding rapid alignment and focused risk discussions.
Economic factors
Philippine GDP growth and consumption
Household spending drives food and beverage demand and fuels retail volumes—household consumption accounted for roughly 70% of GDP while the Philippines posted about 5.6% GDP growth in 2024 (PSA/IMF). Infrastructure cycles follow public capex and private investment trends, with public capex near 4.5% of GDP in 2024 supporting construction and packaging demand. Broad-based growth sustains packaging volumes; a slowdown compresses volumes across the portfolio simultaneously.
Inflation and input costs
Commodity swings—often 10–30% in 2024 across grains, sugar, aluminum, resin and crude (Brent averaged roughly $90/bbl in 2024)—directly squeeze margins; pricing power and product mix determine pass-through success. Energy costs, constituting roughly 10–15% of manufacturing COGS, raise logistics and production risk. Effective procurement and hedging are critical to stabilize earnings.
Interest rates and credit conditions
Higher rates (US fed funds 5.25–5.50% and 10y Treasury ~4.2% mid‑2025) raise financing costs for capital‑intensive energy and infra projects, squeezing returns. Shorter refinancing windows and shorter tenor worsen cash‑flow coverage ratios. Tight credit markets can delay expansions or M&A, while strong balance‑sheet metrics preserve investment‑grade funding access.
Currency volatility (PHP/USD)
Currency volatility in PHP/USD (around 56–57 PHP per USD in mid‑2025) pressures Top Frontier through imported inputs and dollar‑linked fuel, directly hitting margins and earnings.
USD‑denominated debt and planned capex require natural or financial hedges to avoid balance‑sheet strain; active FX management helps protect dividends and coverage ratios.
Peso depreciation can boost export competitiveness for packaging but squeezes domestic consumer spending.
- Imported inputs: FX exposure
- USD debt/capex: need hedges
- Depreciation: export edge vs consumer squeeze
- Active FX risk management: preserves dividends
Global commodity cycles
- Oil: Brent ~88 USD/bbl (2024) — impacts fuel spreads & power costs
- Agriculture: FAO index -3% (2024) — alters food margins & inventories
- Construction: steel/cement ≈ -10% (2024) — eases infra capex
- Diversification: reduces but does not eliminate cyclicality
Election cycles, policy shifts and PPPs ($60B) heighten tariff and import risks
Domestic demand (household consumption ~70% of GDP; 2024 GDP +5.6%) and public capex (~4.5% of GDP in 2024) sustain volumes but leave exposure to cycles. Commodity swings (10–30% in 2024) and energy costs (~10–15% of COGS) compress margins; pricing power and hedges drive pass‑through. FX and rates (PHP/USD ~56–57 mid‑2025; US fed funds 5.25–5.50%) raise financing and import costs.
| Indicator | Value |
|---|---|
| Philippine GDP growth (2024) | +5.6% |
| Public capex (2024) | ~4.5% GDP |
| Brent (2024) | ~$88/bbl |
| PHP/USD (mid‑2025) | 56–57 |
| Fed funds (mid‑2025) | 5.25–5.50% |
Preview the Actual Deliverable
Top Frontier Investment Holdings PESTLE Analysis
This preview is the exact Top Frontier Investment Holdings PESTLE Analysis you’ll receive after purchase—fully formatted and ready to use. It contains the complete political, economic, social, technological, legal, and environmental assessment as shown. No placeholders or teasers—this is the final, professionally structured file. After checkout you’ll instantly download the same document displayed here.











