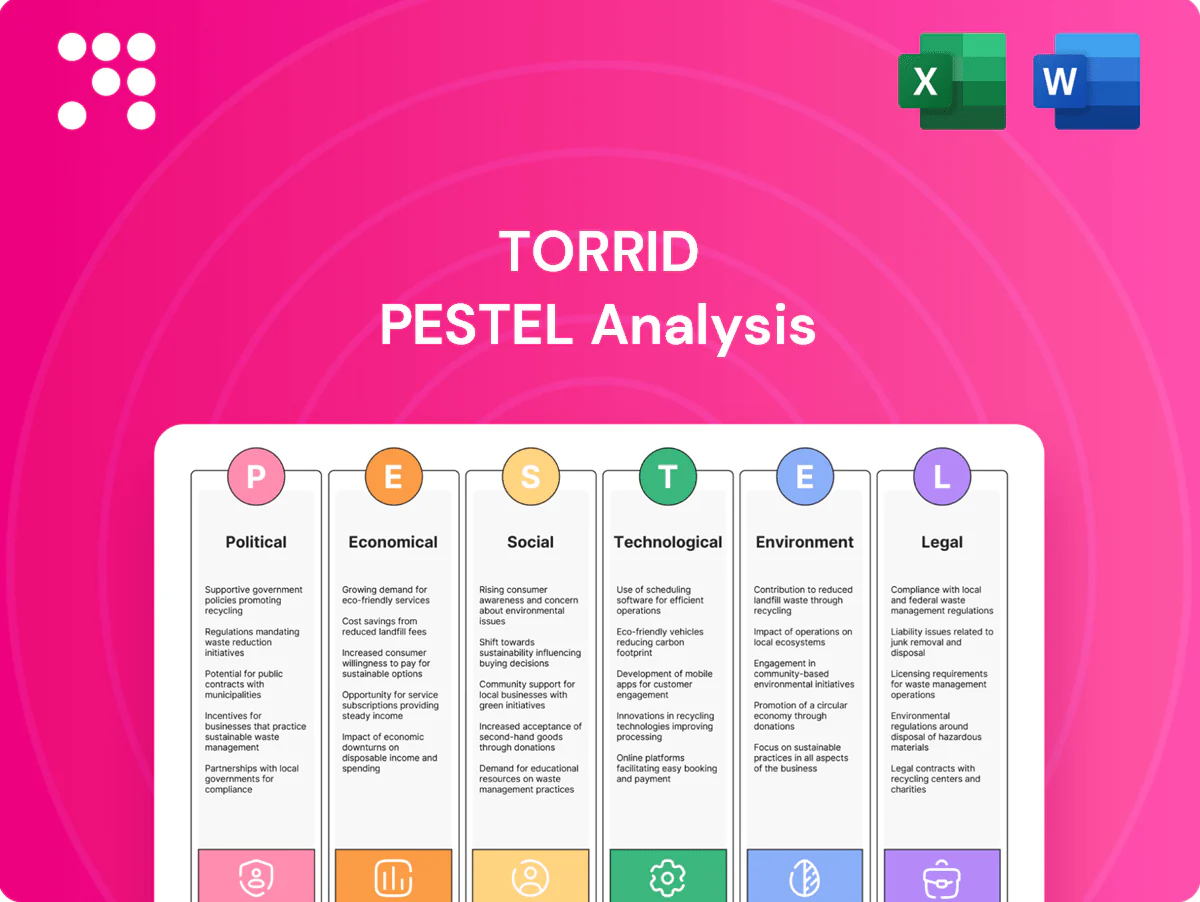
Torrid PESTLE Analysis

Skip the Research. Get the Strategy.
Unlock strategic clarity with our PESTLE Analysis of Torrid — three to five external forces explained to help you anticipate regulatory shifts, consumer trends, and tech disruptors affecting growth. Perfect for investors and strategists seeking a competitive edge. Buy the full report for the complete, ready-to-use analysis and actionable recommendations you can implement immediately.
Political factors

Tariffs and trade policy
Changes in U.S. tariffs on apparel and footwear, which commonly range from 10% to 32% by tariff line, directly raise landed costs for Torrid’s imported goods. Sourcing from Asia or Latin America exposes Torrid to country-of-origin rules and quota shifts that can reroute supply chains; U.S. apparel imports were about $75 billion in 2023. Favorable trade agreements can cut duties, while geopolitical friction can rapidly increase them, so pricing and margin planning must remain flexible.
Minimum wage and labor agendas
State and local minimum wages — federal floor $7.25/hr, California $16/hr and New York $15/hr, with city rates like Seattle exceeding $18/hr — raise Torrid’s store and DC payroll, squeezing store-level margins as political momentum for living wages grows. Offsets include scheduling optimization, shifting sales to higher-margin categories, and accelerated investment in labor productivity and automation.

Geopolitical supply chain risk
Conflicts, sanctions and port disruptions can delay shipments and drove container rates from normal levels to peaks above $10,000 per FEU in 2021–22 and pushed war-risk surcharges in Red Sea routes by up to 300–400% in 2023. Political instability in key sourcing countries raises continuity risks for Torrid’s apparel supply chains. Diversifying vendors and nearshoring can reduce exposure but typically raises unit costs. Scenario planning is essential for peak seasons.

Tax policy and incentives
Torrid's margins and cash for growth are sensitive to shifts in US federal corporate tax (statutory rate 21% since 2018) and varying state rates, with combined effective rates often approaching mid-20s percent; changes would directly alter net income available for store expansion and omnichannel investment. Local tax incentives and credits (state job or site incentives) can tilt distribution footprint and new store decisions. Post-Wayfair nexus rules (most states enforce remote sales tax) mean e-commerce pricing, checkout complexity and tax compliance costs affect conversion; proactive tax planning preserves margins and supports pricing flexibility.
- Federal corporate tax rate: 21%
- Effective combined rates often ~mid-20s%
- 45+ jurisdictions enforce sales tax nexus
- US e-commerce share ~16% of retail — impacts checkout/tax exposure
Trade compliance and ESG diplomacy
Government scrutiny on forced labor and ESG compliance intensified in 2024 after expanded enforcement under the Uyghur Forced Labor Prevention Act, and customs holds or bans can quickly disrupt apparel flows if Torrid’s supplier traceability is weak.
- UFLPA enforcement expanded in 2024 — increased customs risk
- Customs holds/bans can halt shipments, raising inventory and cash-flow pressure
- Robust supply‑chain due diligence lowers political and reputational exposure
- Transparent ESG reporting strengthens stakeholder relations and buyer confidence
Tariffs, $75B imports and UFLPA enforcement raise landed costs as wages and taxes climb
Tariffs (10–32% by line) and $75B US apparel imports raise landed costs; trade shifts force flexible pricing. Rising local minimum wages (CA $16, NY $15, Seattle $18+) pressure store payrolls; automation offsets. Effective tax often mid‑20s% (federal 21%) affects expansion cash; UFLPA 2024 enforcement increases customs hold risk.
| Indicator | 2023/24 |
|---|---|
| US apparel imports | $75B |
| Tariff range | 10–32% |
| Federal corp tax | 21% |
| US e‑commerce share | ~16% |
What is included in the product
 Detailed Word Document
Explores how macro-environmental factors uniquely affect Torrid across Political, Economic, Social, Technological, Environmental and Legal dimensions, with data-driven trends and forward-looking insights to help executives, consultants and investors identify risks, opportunities and strategic responses tailored to the plus-size fashion market.

 Customizable Excel Spreadsheet
A concise, visually segmented PESTLE summary for Torrid that’s easily dropped into presentations, editable for regional or business-line notes, and shareable across teams to quickly support external risk discussions and strategic alignment.
Economic factors

Consumer spending cycles
Discretionary apparel demand for Torrid closely follows real disposable income and consumer confidence; Conference Board consumer confidence averaged about 103 in 2024 and US apparel retail sales rose roughly 1.8% year-over-year in 2024, showing moderate demand. In downturns customers trade down or defer purchases, pressuring comps and margins. Value messaging, promotions, and loyalty programs stabilize traffic, while assortment focused on versatile basics smooths volatility.
Inflation and input costs
Inflation lifted cotton and synthetic feedstock costs and, together with wages and freight, pressured COGS—cotton futures rose roughly 12% year-over-year and US CPI averaged 3.4% in 2024 while average hourly earnings grew about 4.5%. Persistent inflation forces price increases that can hit conversion. Vendor negotiations and design-to-cost protect margin. Dynamic pricing and pack-size tactics can sustain AUR without volume loss.

FX and sourcing currency risk
Currency swings drive vendor pricing and dollar-denominated costs for Torrid, increasing cost of goods when the dollar weakens against Asian sourcing currencies and compressing margins when suppliers invoice in stronger local currencies.
Hedging programs (forwards/options) can reduce month-to-month volatility but cannot eliminate basis risk or sudden repricing; multi-country sourcing spreads exposure across currencies and geographies.
Contract terms should embed FX contingencies, indexed pricing clauses, and periodic repricing triggers to protect margins and supply continuity.

Interest rates and capital access
Higher U.S. interest rates (federal funds 5.25–5.50% and prime at 8.50% as of June 2025) raise borrowing costs for Torrid’s inventory purchases and store remodels, and tighten credit makes discounted cash flows for new stores less attractive. Strong cash conversion cycles and healthy inventory turns preserve liquidity, while aggressive lease renegotiations can offset financing headwinds.
- Higher borrowing costs: fed funds 5.25–5.50%
- Credit squeeze: prime rate 8.50%
- Mitigants: strong cash conversion, inventory turns, lease renegotiation
Logistics and last-mile costs
E-commerce growth raises parcel volume and online apparel return rates (typically 20–30%), increasing Torrid’s shipping and reverse-logistics spend; fuel surcharges and carrier capacity cycles drove notable rate volatility in 2023–24. Ship-from-store and consolidation can cut per-order last-mile costs by roughly 10–30%, while improved fit accuracy can lower apparel returns by up to ~25%, easing margin pressure.
- Parcel volume↑ — higher unit shipping cost
- Returns 20–30% for apparel — reverse costs
- Fuel surcharges & capacity cycles — price volatility
- Ship-from-store/consolidation — −10–30% per-order
- Better fit — −~25% returns
Tariffs, $75B imports and UFLPA enforcement raise landed costs as wages and taxes climb
Discretionary apparel demand tracked consumer confidence (~103 in 2024) and US apparel sales +1.8% YoY in 2024, making comps sensitive to income swings. Input-cost pressure: cotton futures +12% YoY, US CPI 3.4% and average hourly earnings +4.5% in 2024, squeezing COGS and margins. Higher rates (fed funds 5.25–5.50%, prime 8.50% Jun 2025) raise financing and inventory costs; returns 20–30% boost logistics spend.
| Metric | Value |
|---|---|
| Consumer Confidence 2024 | ~103 |
| Apparel Sales 2024 | +1.8% YoY |
| Cotton Futures 2024 | +12% YoY |
| CPI 2024 | 3.4% |
| Fed Funds Jun 2025 | 5.25–5.50% |
| Returns | 20–30% |
Preview Before You Purchase
Torrid PESTLE Analysis
The preview shown here is the exact Torrid PESTLE Analysis document you’ll receive after purchase—fully formatted and ready to use. The content, layout, and structure visible in this sample are identical to the downloadable file delivered upon checkout. No placeholders or teasers—this is the finished, professionally structured report you’ll own immediately after payment.

Skip the Research. Get the Strategy.
Unlock strategic clarity with our PESTLE Analysis of Torrid — three to five external forces explained to help you anticipate regulatory shifts, consumer trends, and tech disruptors affecting growth. Perfect for investors and strategists seeking a competitive edge. Buy the full report for the complete, ready-to-use analysis and actionable recommendations you can implement immediately.
Political factors
Tariffs and trade policy
Changes in U.S. tariffs on apparel and footwear, which commonly range from 10% to 32% by tariff line, directly raise landed costs for Torrid’s imported goods. Sourcing from Asia or Latin America exposes Torrid to country-of-origin rules and quota shifts that can reroute supply chains; U.S. apparel imports were about $75 billion in 2023. Favorable trade agreements can cut duties, while geopolitical friction can rapidly increase them, so pricing and margin planning must remain flexible.
Minimum wage and labor agendas
State and local minimum wages — federal floor $7.25/hr, California $16/hr and New York $15/hr, with city rates like Seattle exceeding $18/hr — raise Torrid’s store and DC payroll, squeezing store-level margins as political momentum for living wages grows. Offsets include scheduling optimization, shifting sales to higher-margin categories, and accelerated investment in labor productivity and automation.
Geopolitical supply chain risk
Conflicts, sanctions and port disruptions can delay shipments and drove container rates from normal levels to peaks above $10,000 per FEU in 2021–22 and pushed war-risk surcharges in Red Sea routes by up to 300–400% in 2023. Political instability in key sourcing countries raises continuity risks for Torrid’s apparel supply chains. Diversifying vendors and nearshoring can reduce exposure but typically raises unit costs. Scenario planning is essential for peak seasons.
Tax policy and incentives
Torrid's margins and cash for growth are sensitive to shifts in US federal corporate tax (statutory rate 21% since 2018) and varying state rates, with combined effective rates often approaching mid-20s percent; changes would directly alter net income available for store expansion and omnichannel investment. Local tax incentives and credits (state job or site incentives) can tilt distribution footprint and new store decisions. Post-Wayfair nexus rules (most states enforce remote sales tax) mean e-commerce pricing, checkout complexity and tax compliance costs affect conversion; proactive tax planning preserves margins and supports pricing flexibility.
- Federal corporate tax rate: 21%
- Effective combined rates often ~mid-20s%
- 45+ jurisdictions enforce sales tax nexus
- US e-commerce share ~16% of retail — impacts checkout/tax exposure
Trade compliance and ESG diplomacy
Government scrutiny on forced labor and ESG compliance intensified in 2024 after expanded enforcement under the Uyghur Forced Labor Prevention Act, and customs holds or bans can quickly disrupt apparel flows if Torrid’s supplier traceability is weak.
- UFLPA enforcement expanded in 2024 — increased customs risk
- Customs holds/bans can halt shipments, raising inventory and cash-flow pressure
- Robust supply‑chain due diligence lowers political and reputational exposure
- Transparent ESG reporting strengthens stakeholder relations and buyer confidence
Tariffs, $75B imports and UFLPA enforcement raise landed costs as wages and taxes climb
Tariffs (10–32% by line) and $75B US apparel imports raise landed costs; trade shifts force flexible pricing. Rising local minimum wages (CA $16, NY $15, Seattle $18+) pressure store payrolls; automation offsets. Effective tax often mid‑20s% (federal 21%) affects expansion cash; UFLPA 2024 enforcement increases customs hold risk.
| Indicator | 2023/24 |
|---|---|
| US apparel imports | $75B |
| Tariff range | 10–32% |
| Federal corp tax | 21% |
| US e‑commerce share | ~16% |
What is included in the product
Detailed Word Document
Explores how macro-environmental factors uniquely affect Torrid across Political, Economic, Social, Technological, Environmental and Legal dimensions, with data-driven trends and forward-looking insights to help executives, consultants and investors identify risks, opportunities and strategic responses tailored to the plus-size fashion market.
Customizable Excel Spreadsheet
A concise, visually segmented PESTLE summary for Torrid that’s easily dropped into presentations, editable for regional or business-line notes, and shareable across teams to quickly support external risk discussions and strategic alignment.
Economic factors
Consumer spending cycles
Discretionary apparel demand for Torrid closely follows real disposable income and consumer confidence; Conference Board consumer confidence averaged about 103 in 2024 and US apparel retail sales rose roughly 1.8% year-over-year in 2024, showing moderate demand. In downturns customers trade down or defer purchases, pressuring comps and margins. Value messaging, promotions, and loyalty programs stabilize traffic, while assortment focused on versatile basics smooths volatility.
Inflation and input costs
Inflation lifted cotton and synthetic feedstock costs and, together with wages and freight, pressured COGS—cotton futures rose roughly 12% year-over-year and US CPI averaged 3.4% in 2024 while average hourly earnings grew about 4.5%. Persistent inflation forces price increases that can hit conversion. Vendor negotiations and design-to-cost protect margin. Dynamic pricing and pack-size tactics can sustain AUR without volume loss.
FX and sourcing currency risk
Currency swings drive vendor pricing and dollar-denominated costs for Torrid, increasing cost of goods when the dollar weakens against Asian sourcing currencies and compressing margins when suppliers invoice in stronger local currencies.
Hedging programs (forwards/options) can reduce month-to-month volatility but cannot eliminate basis risk or sudden repricing; multi-country sourcing spreads exposure across currencies and geographies.
Contract terms should embed FX contingencies, indexed pricing clauses, and periodic repricing triggers to protect margins and supply continuity.
Interest rates and capital access
Higher U.S. interest rates (federal funds 5.25–5.50% and prime at 8.50% as of June 2025) raise borrowing costs for Torrid’s inventory purchases and store remodels, and tighten credit makes discounted cash flows for new stores less attractive. Strong cash conversion cycles and healthy inventory turns preserve liquidity, while aggressive lease renegotiations can offset financing headwinds.
- Higher borrowing costs: fed funds 5.25–5.50%
- Credit squeeze: prime rate 8.50%
- Mitigants: strong cash conversion, inventory turns, lease renegotiation
Logistics and last-mile costs
E-commerce growth raises parcel volume and online apparel return rates (typically 20–30%), increasing Torrid’s shipping and reverse-logistics spend; fuel surcharges and carrier capacity cycles drove notable rate volatility in 2023–24. Ship-from-store and consolidation can cut per-order last-mile costs by roughly 10–30%, while improved fit accuracy can lower apparel returns by up to ~25%, easing margin pressure.
- Parcel volume↑ — higher unit shipping cost
- Returns 20–30% for apparel — reverse costs
- Fuel surcharges & capacity cycles — price volatility
- Ship-from-store/consolidation — −10–30% per-order
- Better fit — −~25% returns
Tariffs, $75B imports and UFLPA enforcement raise landed costs as wages and taxes climb
Discretionary apparel demand tracked consumer confidence (~103 in 2024) and US apparel sales +1.8% YoY in 2024, making comps sensitive to income swings. Input-cost pressure: cotton futures +12% YoY, US CPI 3.4% and average hourly earnings +4.5% in 2024, squeezing COGS and margins. Higher rates (fed funds 5.25–5.50%, prime 8.50% Jun 2025) raise financing and inventory costs; returns 20–30% boost logistics spend.
| Metric | Value |
|---|---|
| Consumer Confidence 2024 | ~103 |
| Apparel Sales 2024 | +1.8% YoY |
| Cotton Futures 2024 | +12% YoY |
| CPI 2024 | 3.4% |
| Fed Funds Jun 2025 | 5.25–5.50% |
| Returns | 20–30% |
Preview Before You Purchase
Torrid PESTLE Analysis
The preview shown here is the exact Torrid PESTLE Analysis document you’ll receive after purchase—fully formatted and ready to use. The content, layout, and structure visible in this sample are identical to the downloadable file delivered upon checkout. No placeholders or teasers—this is the finished, professionally structured report you’ll own immediately after payment.
Description
Skip the Research. Get the Strategy.
Unlock strategic clarity with our PESTLE Analysis of Torrid — three to five external forces explained to help you anticipate regulatory shifts, consumer trends, and tech disruptors affecting growth. Perfect for investors and strategists seeking a competitive edge. Buy the full report for the complete, ready-to-use analysis and actionable recommendations you can implement immediately.
Political factors
Tariffs and trade policy
Changes in U.S. tariffs on apparel and footwear, which commonly range from 10% to 32% by tariff line, directly raise landed costs for Torrid’s imported goods. Sourcing from Asia or Latin America exposes Torrid to country-of-origin rules and quota shifts that can reroute supply chains; U.S. apparel imports were about $75 billion in 2023. Favorable trade agreements can cut duties, while geopolitical friction can rapidly increase them, so pricing and margin planning must remain flexible.
Minimum wage and labor agendas
State and local minimum wages — federal floor $7.25/hr, California $16/hr and New York $15/hr, with city rates like Seattle exceeding $18/hr — raise Torrid’s store and DC payroll, squeezing store-level margins as political momentum for living wages grows. Offsets include scheduling optimization, shifting sales to higher-margin categories, and accelerated investment in labor productivity and automation.
Geopolitical supply chain risk
Conflicts, sanctions and port disruptions can delay shipments and drove container rates from normal levels to peaks above $10,000 per FEU in 2021–22 and pushed war-risk surcharges in Red Sea routes by up to 300–400% in 2023. Political instability in key sourcing countries raises continuity risks for Torrid’s apparel supply chains. Diversifying vendors and nearshoring can reduce exposure but typically raises unit costs. Scenario planning is essential for peak seasons.
Tax policy and incentives
Torrid's margins and cash for growth are sensitive to shifts in US federal corporate tax (statutory rate 21% since 2018) and varying state rates, with combined effective rates often approaching mid-20s percent; changes would directly alter net income available for store expansion and omnichannel investment. Local tax incentives and credits (state job or site incentives) can tilt distribution footprint and new store decisions. Post-Wayfair nexus rules (most states enforce remote sales tax) mean e-commerce pricing, checkout complexity and tax compliance costs affect conversion; proactive tax planning preserves margins and supports pricing flexibility.
- Federal corporate tax rate: 21%
- Effective combined rates often ~mid-20s%
- 45+ jurisdictions enforce sales tax nexus
- US e-commerce share ~16% of retail — impacts checkout/tax exposure
Trade compliance and ESG diplomacy
Government scrutiny on forced labor and ESG compliance intensified in 2024 after expanded enforcement under the Uyghur Forced Labor Prevention Act, and customs holds or bans can quickly disrupt apparel flows if Torrid’s supplier traceability is weak.
- UFLPA enforcement expanded in 2024 — increased customs risk
- Customs holds/bans can halt shipments, raising inventory and cash-flow pressure
- Robust supply‑chain due diligence lowers political and reputational exposure
- Transparent ESG reporting strengthens stakeholder relations and buyer confidence
Tariffs, $75B imports and UFLPA enforcement raise landed costs as wages and taxes climb
Tariffs (10–32% by line) and $75B US apparel imports raise landed costs; trade shifts force flexible pricing. Rising local minimum wages (CA $16, NY $15, Seattle $18+) pressure store payrolls; automation offsets. Effective tax often mid‑20s% (federal 21%) affects expansion cash; UFLPA 2024 enforcement increases customs hold risk.
| Indicator | 2023/24 |
|---|---|
| US apparel imports | $75B |
| Tariff range | 10–32% |
| Federal corp tax | 21% |
| US e‑commerce share | ~16% |
What is included in the product
Detailed Word Document
Explores how macro-environmental factors uniquely affect Torrid across Political, Economic, Social, Technological, Environmental and Legal dimensions, with data-driven trends and forward-looking insights to help executives, consultants and investors identify risks, opportunities and strategic responses tailored to the plus-size fashion market.
Customizable Excel Spreadsheet
A concise, visually segmented PESTLE summary for Torrid that’s easily dropped into presentations, editable for regional or business-line notes, and shareable across teams to quickly support external risk discussions and strategic alignment.
Economic factors
Consumer spending cycles
Discretionary apparel demand for Torrid closely follows real disposable income and consumer confidence; Conference Board consumer confidence averaged about 103 in 2024 and US apparel retail sales rose roughly 1.8% year-over-year in 2024, showing moderate demand. In downturns customers trade down or defer purchases, pressuring comps and margins. Value messaging, promotions, and loyalty programs stabilize traffic, while assortment focused on versatile basics smooths volatility.
Inflation and input costs
Inflation lifted cotton and synthetic feedstock costs and, together with wages and freight, pressured COGS—cotton futures rose roughly 12% year-over-year and US CPI averaged 3.4% in 2024 while average hourly earnings grew about 4.5%. Persistent inflation forces price increases that can hit conversion. Vendor negotiations and design-to-cost protect margin. Dynamic pricing and pack-size tactics can sustain AUR without volume loss.
FX and sourcing currency risk
Currency swings drive vendor pricing and dollar-denominated costs for Torrid, increasing cost of goods when the dollar weakens against Asian sourcing currencies and compressing margins when suppliers invoice in stronger local currencies.
Hedging programs (forwards/options) can reduce month-to-month volatility but cannot eliminate basis risk or sudden repricing; multi-country sourcing spreads exposure across currencies and geographies.
Contract terms should embed FX contingencies, indexed pricing clauses, and periodic repricing triggers to protect margins and supply continuity.
Interest rates and capital access
Higher U.S. interest rates (federal funds 5.25–5.50% and prime at 8.50% as of June 2025) raise borrowing costs for Torrid’s inventory purchases and store remodels, and tighten credit makes discounted cash flows for new stores less attractive. Strong cash conversion cycles and healthy inventory turns preserve liquidity, while aggressive lease renegotiations can offset financing headwinds.
- Higher borrowing costs: fed funds 5.25–5.50%
- Credit squeeze: prime rate 8.50%
- Mitigants: strong cash conversion, inventory turns, lease renegotiation
Logistics and last-mile costs
E-commerce growth raises parcel volume and online apparel return rates (typically 20–30%), increasing Torrid’s shipping and reverse-logistics spend; fuel surcharges and carrier capacity cycles drove notable rate volatility in 2023–24. Ship-from-store and consolidation can cut per-order last-mile costs by roughly 10–30%, while improved fit accuracy can lower apparel returns by up to ~25%, easing margin pressure.
- Parcel volume↑ — higher unit shipping cost
- Returns 20–30% for apparel — reverse costs
- Fuel surcharges & capacity cycles — price volatility
- Ship-from-store/consolidation — −10–30% per-order
- Better fit — −~25% returns
Tariffs, $75B imports and UFLPA enforcement raise landed costs as wages and taxes climb
Discretionary apparel demand tracked consumer confidence (~103 in 2024) and US apparel sales +1.8% YoY in 2024, making comps sensitive to income swings. Input-cost pressure: cotton futures +12% YoY, US CPI 3.4% and average hourly earnings +4.5% in 2024, squeezing COGS and margins. Higher rates (fed funds 5.25–5.50%, prime 8.50% Jun 2025) raise financing and inventory costs; returns 20–30% boost logistics spend.
| Metric | Value |
|---|---|
| Consumer Confidence 2024 | ~103 |
| Apparel Sales 2024 | +1.8% YoY |
| Cotton Futures 2024 | +12% YoY |
| CPI 2024 | 3.4% |
| Fed Funds Jun 2025 | 5.25–5.50% |
| Returns | 20–30% |
Preview Before You Purchase
Torrid PESTLE Analysis
The preview shown here is the exact Torrid PESTLE Analysis document you’ll receive after purchase—fully formatted and ready to use. The content, layout, and structure visible in this sample are identical to the downloadable file delivered upon checkout. No placeholders or teasers—this is the finished, professionally structured report you’ll own immediately after payment.











