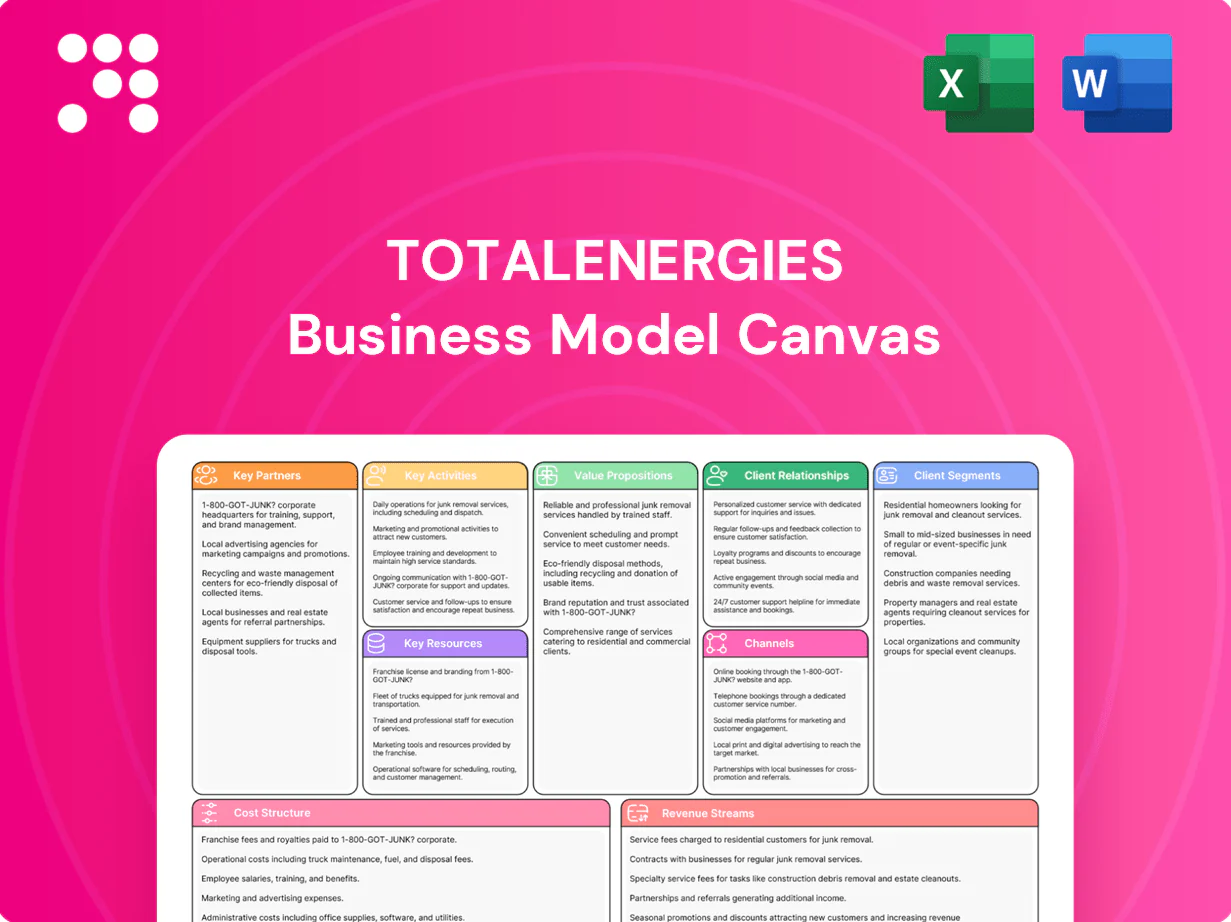
TotalEnergies Business Model Canvas

Business Model Canvas: Value Creation Across Upstream, Downstream & Renewables
Discover how TotalEnergies creates and captures value across upstream, downstream, renewables and integrated services in a concise Business Model Canvas—covering customer segments, key activities, partnerships, and revenue drivers. Download the full, editable canvas to benchmark strategy, inform investments, and drive actionable decisions.
Partnerships

NOCs and Upstream JVs
Joint ventures with national oil companies secure access to reserves and stabilize long-term supply, noting NOCs hold roughly 85% of global proved oil reserves. These partnerships share geological risk and capital intensity across exploration and production, lowering exposure for TotalEnergies. They provide local market insight and license continuity, and co-development improves project economics and political alignment.
Renewables & Storage Technology
TotalEnergies' alliances with solar, wind and battery technology providers accelerate low-carbon deployment by leveraging proven designs and manufacturing scale; PV module prices have fallen ~90% since 2010 and battery pack costs averaged $132/kWh in 2023 (BNEF). Partners provide performance warranties that reduce project risk, shortening time-to-market and lowering LCOE. Co-innovation improves grid integration and flexibility via advanced storage and control systems.

EPC, O&M, and Engineering Firms
EPC partners execute complex projects on schedule, enabling TotalEnergies to deploy assets across its operations in more than 130 countries. O&M specialists raise uptime, safety, and lifecycle efficiency, cutting operational interruptions and extending asset life. Framework agreements standardize costs and quality across geographies. These ties materially de-risk megaproject execution and scaling.

Grid Operators and Offtakers
Grid operators and offtakers enable interconnection and dispatch of TotalEnergies power assets, supporting its renewables build-up (target ~35 GW by 2025). Long-term offtake agreements, typically 15–20 years, underpin bankability and attract project financing. Close coordination reduces curtailment, improves grid stability and lowers revenue volatility when offtakers are investment-grade.
- Interconnection: transmission operators
- Bankability: 15–20y PPAs
- Scale: ~35 GW target by 2025
- Benefit: lower revenue volatility
Academia, Startups, and Carbon Partners
Research institutions and startups drive innovation in biofuels, CCUS and green gases, supporting TotalEnergies pilots that have scaled to dozens of demonstrations by 2024 and helped derisk commercial rollouts.
Carbon credit developers and MRV providers enable decarbonization strategies and reporting, while partnerships expand optionality across power, fuels and CCUS value chains.
- R&D collaborations: academia + startups
- Pilots: dozens by 2024
- MRV/carbon credit partners
- Optionality across CCUS, biofuels, green gases
NOC JVs secure ~85% reserves; 35 GW renewables target and cheaper PV/batteries boost bankability
TotalEnergies leverages NOC JVs (NOCs hold ~85% proved oil reserves) to secure reserves and share E&P risk. Renewable tech and EPC partners drive ~35 GW target by 2025, with PV prices down ~90% since 2010 and battery packs ~$132/kWh in 2023. Long-term 15–20y PPAs and grid operators improve bankability and lower revenue volatility. R&D/CCUS partners supported dozens of pilots by 2024.
| Partner | Metric | 2023–24 |
|---|---|---|
| NOCs/JVs | Reserve access | ~85% global reserves |
| Renewables/EPC | Capacity target | ~35 GW by 2025 |
| Tech/R&D | Pilots | Dozens by 2024 |
What is included in the product
 Detailed Word Document
A comprehensive, pre-written Business Model Canvas for TotalEnergies outlining its nine blocks—customer segments, value propositions, channels, customer relationships, revenue streams, key resources, key activities, key partnerships, and cost structure—reflecting integrated oil & gas, low-carbon energy transition strategy. Ideal for presentations and investor discussions, it includes competitive analysis, SWOT-linked insights, and actionable validation points.

 Customizable Excel Spreadsheet
High-level view of TotalEnergies' business model with editable cells—quickly identify core components, align energy transition priorities, and save hours of formatting for boardroom-ready strategy reviews and team collaboration.
Activities

Exploration & Production
Identify, appraise and develop hydrocarbon resources with disciplined capital allocation, targeting 2.7 million boe/d production in 2024 and upstream capex of about €8.5bn to prioritize high-return projects.
Apply subsurface analytics and reservoir modelling to optimize recovery and flatten decline curves, improving recovery factors and lowering unit operating costs.
Manage HSE and regulatory compliance across the asset lifecycle with strict safety KPIs and emissions monitoring, balancing legacy fields and selective new plays to sustain cash flow and transition readiness.
Refining & Petrochemicals
Operate refineries and integrated chemicals complexes to supply fuels and feedstocks while continuously optimizing yields, energy intensity and turnaround cycles for cost and uptime improvements. Produce lubricants, polymers and specialty products to capture diversified margins across mobility and industry. Advance decarbonization through energy-efficiency projects and bio-feedstock integration to lower lifecycle emissions.

LNG & Gas Marketing
Develop and operate liquefaction, shipping, regas and downstream supply chains to deliver flexible LNG volumes, aligning with a global LNG market of roughly 380–390 million tonnes in 2024 (IEA). Hedge and trade across hubs (TTF, Henry Hub, JKM) to balance seasonal flows and price exposure while structuring long-term SPAs and flexible contracts to secure customer demand. Enhance reliability with storage and swing capacity to mitigate supply shocks and seasonal peaks.

Renewables Development
TotalEnergies originates, permits, finances and builds utility-scale solar, wind and storage to meet its 35 GW by 2030 target, leveraging ~6 GW operational as a 2023–2024 baseline; it competes in auctions and bilateral PPAs using bankable structures to secure long-term revenue. Hybridization and grid services are optimized to capture premiums while digital monitoring and remote operations maximize availability and performance.
- Originate, permit, finance, build
- Compete in auctions & PPAs (bankable)
- Optimize hybrids & grid services for premiums
- Operate with digital monitoring for performance
Downstream Marketing & Mobility
TotalEnergies runs roughly 17,000 service stations globally (2024), provides B2B fuel supply and is rapidly scaling EV charging and mobility services while offering convenience retail, lubricants and fleet solutions to deepen share of wallet.
- Network: ~17,000 service stations (2024)
- Offerings: retail, lubricants, fleet solutions, B2B fuel
- Growth: scaling EV charging & mobility
- Data: personalization to improve loyalty economics
- Operations: safety, quality, brand consistency at scale
2.7m boe/d, €8.5bn capex, 35 GW renewables - integrated energy strategy
Identify, appraise and develop hydrocarbons (2.7m boe/d target 2024) with disciplined capex (~€8.5bn upstream 2024) to prioritize high-return projects.
Operate refineries, chemicals and LNG value chains while hedging exposure across TTF/Henry Hub/JKM and maintaining storage/swing capacity.
Build 35 GW renewables by 2030 (≈6 GW operational 2023–24) and run ~17,000 service stations (2024) while scaling EV charging.
| Metric | Value |
|---|---|
| Production | 2.7m boe/d |
| Upstream capex 2024 | €8.5bn |
| Renewables | 35 GW by 2030 (≈6 GW) |
| Stations | ~17,000 (2024) |
Preview Before You Purchase
Business Model Canvas
The document previewed here is the actual TotalEnergies Business Model Canvas—not a mockup—and contains the exact content and structure you’ll receive after purchase. When you buy, you’ll immediately download the same complete, editable file ready for presentation, analysis, and use. No placeholders, no omissions—what you see is the final deliverable.

Business Model Canvas: Value Creation Across Upstream, Downstream & Renewables
Discover how TotalEnergies creates and captures value across upstream, downstream, renewables and integrated services in a concise Business Model Canvas—covering customer segments, key activities, partnerships, and revenue drivers. Download the full, editable canvas to benchmark strategy, inform investments, and drive actionable decisions.
Partnerships
NOCs and Upstream JVs
Joint ventures with national oil companies secure access to reserves and stabilize long-term supply, noting NOCs hold roughly 85% of global proved oil reserves. These partnerships share geological risk and capital intensity across exploration and production, lowering exposure for TotalEnergies. They provide local market insight and license continuity, and co-development improves project economics and political alignment.
Renewables & Storage Technology
TotalEnergies' alliances with solar, wind and battery technology providers accelerate low-carbon deployment by leveraging proven designs and manufacturing scale; PV module prices have fallen ~90% since 2010 and battery pack costs averaged $132/kWh in 2023 (BNEF). Partners provide performance warranties that reduce project risk, shortening time-to-market and lowering LCOE. Co-innovation improves grid integration and flexibility via advanced storage and control systems.
EPC, O&M, and Engineering Firms
EPC partners execute complex projects on schedule, enabling TotalEnergies to deploy assets across its operations in more than 130 countries. O&M specialists raise uptime, safety, and lifecycle efficiency, cutting operational interruptions and extending asset life. Framework agreements standardize costs and quality across geographies. These ties materially de-risk megaproject execution and scaling.
Grid Operators and Offtakers
Grid operators and offtakers enable interconnection and dispatch of TotalEnergies power assets, supporting its renewables build-up (target ~35 GW by 2025). Long-term offtake agreements, typically 15–20 years, underpin bankability and attract project financing. Close coordination reduces curtailment, improves grid stability and lowers revenue volatility when offtakers are investment-grade.
- Interconnection: transmission operators
- Bankability: 15–20y PPAs
- Scale: ~35 GW target by 2025
- Benefit: lower revenue volatility
Academia, Startups, and Carbon Partners
Research institutions and startups drive innovation in biofuels, CCUS and green gases, supporting TotalEnergies pilots that have scaled to dozens of demonstrations by 2024 and helped derisk commercial rollouts.
Carbon credit developers and MRV providers enable decarbonization strategies and reporting, while partnerships expand optionality across power, fuels and CCUS value chains.
- R&D collaborations: academia + startups
- Pilots: dozens by 2024
- MRV/carbon credit partners
- Optionality across CCUS, biofuels, green gases
NOC JVs secure ~85% reserves; 35 GW renewables target and cheaper PV/batteries boost bankability
TotalEnergies leverages NOC JVs (NOCs hold ~85% proved oil reserves) to secure reserves and share E&P risk. Renewable tech and EPC partners drive ~35 GW target by 2025, with PV prices down ~90% since 2010 and battery packs ~$132/kWh in 2023. Long-term 15–20y PPAs and grid operators improve bankability and lower revenue volatility. R&D/CCUS partners supported dozens of pilots by 2024.
| Partner | Metric | 2023–24 |
|---|---|---|
| NOCs/JVs | Reserve access | ~85% global reserves |
| Renewables/EPC | Capacity target | ~35 GW by 2025 |
| Tech/R&D | Pilots | Dozens by 2024 |
What is included in the product
Detailed Word Document
A comprehensive, pre-written Business Model Canvas for TotalEnergies outlining its nine blocks—customer segments, value propositions, channels, customer relationships, revenue streams, key resources, key activities, key partnerships, and cost structure—reflecting integrated oil & gas, low-carbon energy transition strategy. Ideal for presentations and investor discussions, it includes competitive analysis, SWOT-linked insights, and actionable validation points.
Customizable Excel Spreadsheet
High-level view of TotalEnergies' business model with editable cells—quickly identify core components, align energy transition priorities, and save hours of formatting for boardroom-ready strategy reviews and team collaboration.
Activities
Exploration & Production
Identify, appraise and develop hydrocarbon resources with disciplined capital allocation, targeting 2.7 million boe/d production in 2024 and upstream capex of about €8.5bn to prioritize high-return projects.
Apply subsurface analytics and reservoir modelling to optimize recovery and flatten decline curves, improving recovery factors and lowering unit operating costs.
Manage HSE and regulatory compliance across the asset lifecycle with strict safety KPIs and emissions monitoring, balancing legacy fields and selective new plays to sustain cash flow and transition readiness.
Refining & Petrochemicals
Operate refineries and integrated chemicals complexes to supply fuels and feedstocks while continuously optimizing yields, energy intensity and turnaround cycles for cost and uptime improvements. Produce lubricants, polymers and specialty products to capture diversified margins across mobility and industry. Advance decarbonization through energy-efficiency projects and bio-feedstock integration to lower lifecycle emissions.
LNG & Gas Marketing
Develop and operate liquefaction, shipping, regas and downstream supply chains to deliver flexible LNG volumes, aligning with a global LNG market of roughly 380–390 million tonnes in 2024 (IEA). Hedge and trade across hubs (TTF, Henry Hub, JKM) to balance seasonal flows and price exposure while structuring long-term SPAs and flexible contracts to secure customer demand. Enhance reliability with storage and swing capacity to mitigate supply shocks and seasonal peaks.
Renewables Development
TotalEnergies originates, permits, finances and builds utility-scale solar, wind and storage to meet its 35 GW by 2030 target, leveraging ~6 GW operational as a 2023–2024 baseline; it competes in auctions and bilateral PPAs using bankable structures to secure long-term revenue. Hybridization and grid services are optimized to capture premiums while digital monitoring and remote operations maximize availability and performance.
- Originate, permit, finance, build
- Compete in auctions & PPAs (bankable)
- Optimize hybrids & grid services for premiums
- Operate with digital monitoring for performance
Downstream Marketing & Mobility
TotalEnergies runs roughly 17,000 service stations globally (2024), provides B2B fuel supply and is rapidly scaling EV charging and mobility services while offering convenience retail, lubricants and fleet solutions to deepen share of wallet.
- Network: ~17,000 service stations (2024)
- Offerings: retail, lubricants, fleet solutions, B2B fuel
- Growth: scaling EV charging & mobility
- Data: personalization to improve loyalty economics
- Operations: safety, quality, brand consistency at scale
2.7m boe/d, €8.5bn capex, 35 GW renewables - integrated energy strategy
Identify, appraise and develop hydrocarbons (2.7m boe/d target 2024) with disciplined capex (~€8.5bn upstream 2024) to prioritize high-return projects.
Operate refineries, chemicals and LNG value chains while hedging exposure across TTF/Henry Hub/JKM and maintaining storage/swing capacity.
Build 35 GW renewables by 2030 (≈6 GW operational 2023–24) and run ~17,000 service stations (2024) while scaling EV charging.
| Metric | Value |
|---|---|
| Production | 2.7m boe/d |
| Upstream capex 2024 | €8.5bn |
| Renewables | 35 GW by 2030 (≈6 GW) |
| Stations | ~17,000 (2024) |
Preview Before You Purchase
Business Model Canvas
The document previewed here is the actual TotalEnergies Business Model Canvas—not a mockup—and contains the exact content and structure you’ll receive after purchase. When you buy, you’ll immediately download the same complete, editable file ready for presentation, analysis, and use. No placeholders, no omissions—what you see is the final deliverable.
Description
Business Model Canvas: Value Creation Across Upstream, Downstream & Renewables
Discover how TotalEnergies creates and captures value across upstream, downstream, renewables and integrated services in a concise Business Model Canvas—covering customer segments, key activities, partnerships, and revenue drivers. Download the full, editable canvas to benchmark strategy, inform investments, and drive actionable decisions.
Partnerships
NOCs and Upstream JVs
Joint ventures with national oil companies secure access to reserves and stabilize long-term supply, noting NOCs hold roughly 85% of global proved oil reserves. These partnerships share geological risk and capital intensity across exploration and production, lowering exposure for TotalEnergies. They provide local market insight and license continuity, and co-development improves project economics and political alignment.
Renewables & Storage Technology
TotalEnergies' alliances with solar, wind and battery technology providers accelerate low-carbon deployment by leveraging proven designs and manufacturing scale; PV module prices have fallen ~90% since 2010 and battery pack costs averaged $132/kWh in 2023 (BNEF). Partners provide performance warranties that reduce project risk, shortening time-to-market and lowering LCOE. Co-innovation improves grid integration and flexibility via advanced storage and control systems.
EPC, O&M, and Engineering Firms
EPC partners execute complex projects on schedule, enabling TotalEnergies to deploy assets across its operations in more than 130 countries. O&M specialists raise uptime, safety, and lifecycle efficiency, cutting operational interruptions and extending asset life. Framework agreements standardize costs and quality across geographies. These ties materially de-risk megaproject execution and scaling.
Grid Operators and Offtakers
Grid operators and offtakers enable interconnection and dispatch of TotalEnergies power assets, supporting its renewables build-up (target ~35 GW by 2025). Long-term offtake agreements, typically 15–20 years, underpin bankability and attract project financing. Close coordination reduces curtailment, improves grid stability and lowers revenue volatility when offtakers are investment-grade.
- Interconnection: transmission operators
- Bankability: 15–20y PPAs
- Scale: ~35 GW target by 2025
- Benefit: lower revenue volatility
Academia, Startups, and Carbon Partners
Research institutions and startups drive innovation in biofuels, CCUS and green gases, supporting TotalEnergies pilots that have scaled to dozens of demonstrations by 2024 and helped derisk commercial rollouts.
Carbon credit developers and MRV providers enable decarbonization strategies and reporting, while partnerships expand optionality across power, fuels and CCUS value chains.
- R&D collaborations: academia + startups
- Pilots: dozens by 2024
- MRV/carbon credit partners
- Optionality across CCUS, biofuels, green gases
NOC JVs secure ~85% reserves; 35 GW renewables target and cheaper PV/batteries boost bankability
TotalEnergies leverages NOC JVs (NOCs hold ~85% proved oil reserves) to secure reserves and share E&P risk. Renewable tech and EPC partners drive ~35 GW target by 2025, with PV prices down ~90% since 2010 and battery packs ~$132/kWh in 2023. Long-term 15–20y PPAs and grid operators improve bankability and lower revenue volatility. R&D/CCUS partners supported dozens of pilots by 2024.
| Partner | Metric | 2023–24 |
|---|---|---|
| NOCs/JVs | Reserve access | ~85% global reserves |
| Renewables/EPC | Capacity target | ~35 GW by 2025 |
| Tech/R&D | Pilots | Dozens by 2024 |
What is included in the product
Detailed Word Document
A comprehensive, pre-written Business Model Canvas for TotalEnergies outlining its nine blocks—customer segments, value propositions, channels, customer relationships, revenue streams, key resources, key activities, key partnerships, and cost structure—reflecting integrated oil & gas, low-carbon energy transition strategy. Ideal for presentations and investor discussions, it includes competitive analysis, SWOT-linked insights, and actionable validation points.
Customizable Excel Spreadsheet
High-level view of TotalEnergies' business model with editable cells—quickly identify core components, align energy transition priorities, and save hours of formatting for boardroom-ready strategy reviews and team collaboration.
Activities
Exploration & Production
Identify, appraise and develop hydrocarbon resources with disciplined capital allocation, targeting 2.7 million boe/d production in 2024 and upstream capex of about €8.5bn to prioritize high-return projects.
Apply subsurface analytics and reservoir modelling to optimize recovery and flatten decline curves, improving recovery factors and lowering unit operating costs.
Manage HSE and regulatory compliance across the asset lifecycle with strict safety KPIs and emissions monitoring, balancing legacy fields and selective new plays to sustain cash flow and transition readiness.
Refining & Petrochemicals
Operate refineries and integrated chemicals complexes to supply fuels and feedstocks while continuously optimizing yields, energy intensity and turnaround cycles for cost and uptime improvements. Produce lubricants, polymers and specialty products to capture diversified margins across mobility and industry. Advance decarbonization through energy-efficiency projects and bio-feedstock integration to lower lifecycle emissions.
LNG & Gas Marketing
Develop and operate liquefaction, shipping, regas and downstream supply chains to deliver flexible LNG volumes, aligning with a global LNG market of roughly 380–390 million tonnes in 2024 (IEA). Hedge and trade across hubs (TTF, Henry Hub, JKM) to balance seasonal flows and price exposure while structuring long-term SPAs and flexible contracts to secure customer demand. Enhance reliability with storage and swing capacity to mitigate supply shocks and seasonal peaks.
Renewables Development
TotalEnergies originates, permits, finances and builds utility-scale solar, wind and storage to meet its 35 GW by 2030 target, leveraging ~6 GW operational as a 2023–2024 baseline; it competes in auctions and bilateral PPAs using bankable structures to secure long-term revenue. Hybridization and grid services are optimized to capture premiums while digital monitoring and remote operations maximize availability and performance.
- Originate, permit, finance, build
- Compete in auctions & PPAs (bankable)
- Optimize hybrids & grid services for premiums
- Operate with digital monitoring for performance
Downstream Marketing & Mobility
TotalEnergies runs roughly 17,000 service stations globally (2024), provides B2B fuel supply and is rapidly scaling EV charging and mobility services while offering convenience retail, lubricants and fleet solutions to deepen share of wallet.
- Network: ~17,000 service stations (2024)
- Offerings: retail, lubricants, fleet solutions, B2B fuel
- Growth: scaling EV charging & mobility
- Data: personalization to improve loyalty economics
- Operations: safety, quality, brand consistency at scale
2.7m boe/d, €8.5bn capex, 35 GW renewables - integrated energy strategy
Identify, appraise and develop hydrocarbons (2.7m boe/d target 2024) with disciplined capex (~€8.5bn upstream 2024) to prioritize high-return projects.
Operate refineries, chemicals and LNG value chains while hedging exposure across TTF/Henry Hub/JKM and maintaining storage/swing capacity.
Build 35 GW renewables by 2030 (≈6 GW operational 2023–24) and run ~17,000 service stations (2024) while scaling EV charging.
| Metric | Value |
|---|---|
| Production | 2.7m boe/d |
| Upstream capex 2024 | €8.5bn |
| Renewables | 35 GW by 2030 (≈6 GW) |
| Stations | ~17,000 (2024) |
Preview Before You Purchase
Business Model Canvas
The document previewed here is the actual TotalEnergies Business Model Canvas—not a mockup—and contains the exact content and structure you’ll receive after purchase. When you buy, you’ll immediately download the same complete, editable file ready for presentation, analysis, and use. No placeholders, no omissions—what you see is the final deliverable.











