Toyota Motor Boston Consulting Group Matrix

See the Bigger Picture
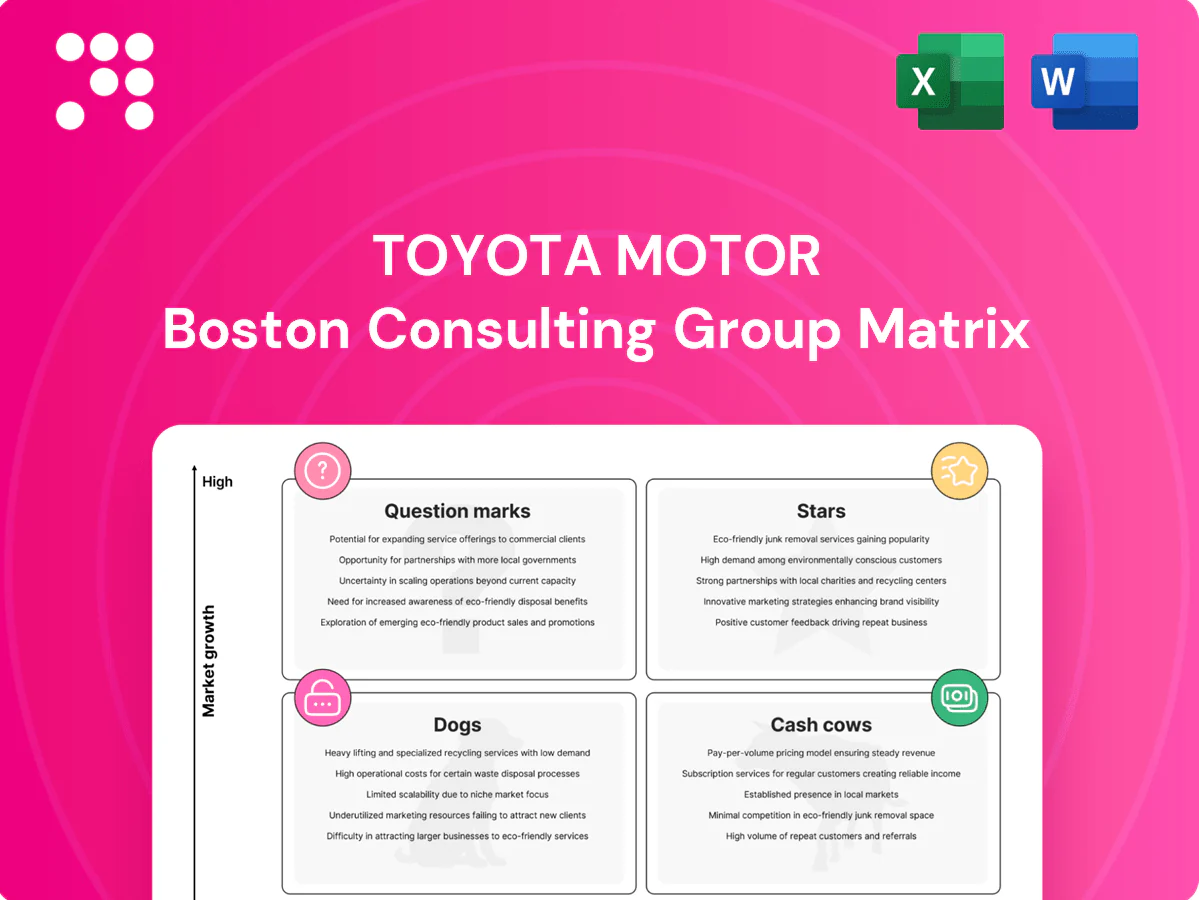
Toyota’s BCG Matrix snapshot shows which models are driving growth, which fund the business, and which may be dragging you down — a quick map of product health and cash flow. This preview teases the story; buy the full BCG Matrix to get quadrant-by-quadrant placements, clear investment priorities, and tactical moves tailored to Toyota’s markets. Get the full report in Word and Excel and skip the guesswork — actionable insights you can present and act on today.
Stars

Hybrid lineup (Prius, RAV4 Hybrid, Corolla Hybrid)
High growth, high share — Toyota wrote the hybrid playbook and still owns it; Prius, RAV4 Hybrid and Corolla Hybrid anchor a segment where demand keeps climbing as fleets and households chase efficiency without range anxiety. Hybrids soak up capex in batteries and marketing but pay back through volume and pricing power. Toyota has sold over 20 million hybrids worldwide since 1997, so keep feeding this engine to mature into even bigger cash later.
Global SUVs/CUVs (RAV4, Corolla Cross, Highlander)
Global SUVs/CUVs (RAV4, Corolla Cross, Highlander) sit in Toyota’s Stars quadrant as SUVs keep expanding; Toyota holds top-tier share with SUVs/CUVs representing about 30% of group volume in 2024. RAV4 remains the volume beast (~760,000 units global 2024) with a ~60% hybrid mix boosting margins. Competition forces heavy promo and placement, but strong demand and hybrid economics mean holding share will convert these into prime milkers as growth cools.

North America mid-size pickups (Tacoma)
North America mid-size pickup segment keeps expanding and Tacoma remains sticky with 2023 US sales of 165,662, anchoring roughly one of Toyota’s strongest light-truck positions.
New‑generation Tacoma (2024) adds i-FORCE MAX hybrid powertrains and higher average transaction prices, while Toyota Genuine Accessories and TRD options drive aftermarket margin upside.
Production, trim complexity and marketing require heavy capital, so Toyota’s play is defend the throne and scale capacity where regional demand concentrates.

Emerging markets trucks (Hilux, IMV platform)
Construction, logistics, and small business formation keep emerging markets expanding, with IMF 2024 projecting emerging market growth near 4.1%; Hilux leadership and trust drive repeat buys and government fleet adoption, but currency swings and policy risks persist, so continue investing in localized specs and rugged aftersales to lock share.
- IMF 2024: EM growth ~4.1%
- Hilux: strong repeat/government demand
- Priority: local specs + robust aftersales
Lexus hybrids in growth luxury pockets
Lexus hybrids are gaining in select luxury pockets as luxury rebounds in regions like China and the Middle East; their hybrid tech offers a compelling mix of lower total cost of ownership and refinement that resonates with reliability-first buyers and supports strong share among that cohort.
Sustained brand investment and elevated dealer experience are required to scale penetration; if Lexus maintains share as the segment expands, hybrids can transition from a growth Stars position to a cash cow.
- Position: Stars
- Strengths: TCO + refinement, reliability-led share
- Opportunities: China, Middle East expansion
- Needs: sustained brand spend, dealer experience
- Upside: could graduate to Cash Cow if share holds
Hybrids and SUVs drive growth; Tacoma i-FORCE MAX lifts ASPs
Toys Stars: hybrids (20M sold since 1997) and SUVs/CUVs (≈30% group volume in 2024; RAV4 ~760,000 units 2024) drive high growth/high share; Tacoma sticky (US 2023 sales 165,662) with new i-FORCE MAX boosting ASPs. Heavy capex in powertrain/production required, but strong hybrid mix and regional SUV demand should convert Stars to future cash cows as growth moderates.
| Segment | 2024 metric | Note |
|---|---|---|
| Hybrids | 20M units cumulative | Volume + margin tailwinds |
| RAV4 | ~760,000 units | ~60% hybrid mix |
| SUVs/CUVs | ~30% group vol (2024) | Top-tier share |
| Tacoma | 165,662 US (2023) | i-FORCE MAX ups ASP |
What is included in the product
 Detailed Word Document
BCG analysis of Toyota: Stars (EVs), Cash Cows (hybrids), Question Marks (mobility services), Dogs (low-margin models); invest, hold, divest.

 Customizable Excel Spreadsheet
One-page Toyota BCG Matrix pinpointing weak units and growth bets for fast C-level decisions.
Cash Cows

Corolla and Camry (mature global sedans)
Corolla and Camry, with Corolla’s cumulative sales exceeding 50 million units and Camry’s over 19 million, form Toyota’s cash cows—massive installed base drives steady replacement cycles and predictable margins. Growth for global sedans is flat-to-declining, but scale economics and proven tooling keep cash flowing. Promotional spend is lower than SUVs; loyalty sustains volumes while Toyota optimizes trims and cost.
Toyota Financial Services (retail loans & leasing)
Toyota Financial Services, operating in 30+ countries, delivers high share and disciplined credit underwriting with sticky dealer relationships that generate dependable cash flow.
Growth is modest but attractive yields and cross-sell (insurance, aftercare) keep the meter running, funding R&D and cushioning cyclical downturns while supporting dividend capacity.
Maintain tight credit quality metrics and seamless digital origination/servicing to preserve this cash-cow franchise and keep milking.

After-sales service network
After-sales service bays track car parc, not market growth, and Toyota’s massive installed base—9.76 million vehicles sold in 2023—creates a large, predictable service funnel. Parts, maintenance plans and certified pre-owned programs generate recurring cash with low incremental capex once the network is built. Leaning into parts availability and service efficiency can meaningfully nudge aftermarket margins and free cash flow.

Parts & accessories (OEM)
Parts & accessories (OEM) are high-margin add-ons riding Toyota’s giant installed base; FY2024 consolidated revenue was about 36.1 trillion JPY, and parts sales deliver outsized profitability despite low unit growth. Take rates are predictable and bundling with new-vehicle sales raises attachment, while minimal market growth makes steady cash generation. Keep catalogs fresh and logistics sharp — easy milk.
- High-margin recurring revenue
- Predictable take rate; bundling boosts attachment
- Low growth, high profitability
- Focus: catalogs, inventory, logistics
Conventional ICE powertrains
Conventional ICE powertrains: mature, fully amortized, and still sold in bulk across many regions; Toyota sold roughly 10 million vehicles worldwide in 2023 with ICE models comprising the majority, delivering strong unit economics even as regulatory headwinds rise; not a growth story but a cash fountain today used to fund the electrified pivot.
- Mature cash generator
- High unit margins
- Funds EV transition
Corolla, Camry & TFS: protect margins, parts logistics and credit quality to sustain cash flow
Corolla (>50m) and Camry (>19m) plus TFS and aftermarket parts are Toyota’s cash cows, funding R&D and dividends; FY2024 revenue ~36.1 trillion JPY and 9.76m vehicles sold in 2023 underpin predictable cash flow. Focus: maintain margins, credit quality, parts logistics to sustain free cash generation.
| Metric | Value |
|---|---|
| FY2024 revenue | 36.1 trillion JPY |
| Vehicles sold (2023) | 9.76 million |
| Corolla cumulative | >50 million |
| Camry cumulative | >19 million |
Full Transparency, Always
Toyota Motor BCG Matrix
The file you're previewing is the final Toyota Motor BCG Matrix you'll receive after purchase—no watermarks, no placeholders. It maps Toyota’s brands and business units into stars, cash cows, question marks, and dogs with clear visuals and concise analysis. Ready to download, edit, or present immediately. This is the exact, production-ready report—no surprises, just strategic clarity.

See the Bigger Picture
Toyota’s BCG Matrix snapshot shows which models are driving growth, which fund the business, and which may be dragging you down — a quick map of product health and cash flow. This preview teases the story; buy the full BCG Matrix to get quadrant-by-quadrant placements, clear investment priorities, and tactical moves tailored to Toyota’s markets. Get the full report in Word and Excel and skip the guesswork — actionable insights you can present and act on today.
Stars
Hybrid lineup (Prius, RAV4 Hybrid, Corolla Hybrid)
High growth, high share — Toyota wrote the hybrid playbook and still owns it; Prius, RAV4 Hybrid and Corolla Hybrid anchor a segment where demand keeps climbing as fleets and households chase efficiency without range anxiety. Hybrids soak up capex in batteries and marketing but pay back through volume and pricing power. Toyota has sold over 20 million hybrids worldwide since 1997, so keep feeding this engine to mature into even bigger cash later.
Global SUVs/CUVs (RAV4, Corolla Cross, Highlander)
Global SUVs/CUVs (RAV4, Corolla Cross, Highlander) sit in Toyota’s Stars quadrant as SUVs keep expanding; Toyota holds top-tier share with SUVs/CUVs representing about 30% of group volume in 2024. RAV4 remains the volume beast (~760,000 units global 2024) with a ~60% hybrid mix boosting margins. Competition forces heavy promo and placement, but strong demand and hybrid economics mean holding share will convert these into prime milkers as growth cools.
North America mid-size pickups (Tacoma)
North America mid-size pickup segment keeps expanding and Tacoma remains sticky with 2023 US sales of 165,662, anchoring roughly one of Toyota’s strongest light-truck positions.
New‑generation Tacoma (2024) adds i-FORCE MAX hybrid powertrains and higher average transaction prices, while Toyota Genuine Accessories and TRD options drive aftermarket margin upside.
Production, trim complexity and marketing require heavy capital, so Toyota’s play is defend the throne and scale capacity where regional demand concentrates.
Emerging markets trucks (Hilux, IMV platform)
Construction, logistics, and small business formation keep emerging markets expanding, with IMF 2024 projecting emerging market growth near 4.1%; Hilux leadership and trust drive repeat buys and government fleet adoption, but currency swings and policy risks persist, so continue investing in localized specs and rugged aftersales to lock share.
- IMF 2024: EM growth ~4.1%
- Hilux: strong repeat/government demand
- Priority: local specs + robust aftersales
Lexus hybrids in growth luxury pockets
Lexus hybrids are gaining in select luxury pockets as luxury rebounds in regions like China and the Middle East; their hybrid tech offers a compelling mix of lower total cost of ownership and refinement that resonates with reliability-first buyers and supports strong share among that cohort.
Sustained brand investment and elevated dealer experience are required to scale penetration; if Lexus maintains share as the segment expands, hybrids can transition from a growth Stars position to a cash cow.
- Position: Stars
- Strengths: TCO + refinement, reliability-led share
- Opportunities: China, Middle East expansion
- Needs: sustained brand spend, dealer experience
- Upside: could graduate to Cash Cow if share holds
Hybrids and SUVs drive growth; Tacoma i-FORCE MAX lifts ASPs
Toys Stars: hybrids (20M sold since 1997) and SUVs/CUVs (≈30% group volume in 2024; RAV4 ~760,000 units 2024) drive high growth/high share; Tacoma sticky (US 2023 sales 165,662) with new i-FORCE MAX boosting ASPs. Heavy capex in powertrain/production required, but strong hybrid mix and regional SUV demand should convert Stars to future cash cows as growth moderates.
| Segment | 2024 metric | Note |
|---|---|---|
| Hybrids | 20M units cumulative | Volume + margin tailwinds |
| RAV4 | ~760,000 units | ~60% hybrid mix |
| SUVs/CUVs | ~30% group vol (2024) | Top-tier share |
| Tacoma | 165,662 US (2023) | i-FORCE MAX ups ASP |
What is included in the product
Detailed Word Document
BCG analysis of Toyota: Stars (EVs), Cash Cows (hybrids), Question Marks (mobility services), Dogs (low-margin models); invest, hold, divest.
Customizable Excel Spreadsheet
One-page Toyota BCG Matrix pinpointing weak units and growth bets for fast C-level decisions.
Cash Cows
Corolla and Camry (mature global sedans)
Corolla and Camry, with Corolla’s cumulative sales exceeding 50 million units and Camry’s over 19 million, form Toyota’s cash cows—massive installed base drives steady replacement cycles and predictable margins. Growth for global sedans is flat-to-declining, but scale economics and proven tooling keep cash flowing. Promotional spend is lower than SUVs; loyalty sustains volumes while Toyota optimizes trims and cost.
Toyota Financial Services (retail loans & leasing)
Toyota Financial Services, operating in 30+ countries, delivers high share and disciplined credit underwriting with sticky dealer relationships that generate dependable cash flow.
Growth is modest but attractive yields and cross-sell (insurance, aftercare) keep the meter running, funding R&D and cushioning cyclical downturns while supporting dividend capacity.
Maintain tight credit quality metrics and seamless digital origination/servicing to preserve this cash-cow franchise and keep milking.
After-sales service network
After-sales service bays track car parc, not market growth, and Toyota’s massive installed base—9.76 million vehicles sold in 2023—creates a large, predictable service funnel. Parts, maintenance plans and certified pre-owned programs generate recurring cash with low incremental capex once the network is built. Leaning into parts availability and service efficiency can meaningfully nudge aftermarket margins and free cash flow.
Parts & accessories (OEM)
Parts & accessories (OEM) are high-margin add-ons riding Toyota’s giant installed base; FY2024 consolidated revenue was about 36.1 trillion JPY, and parts sales deliver outsized profitability despite low unit growth. Take rates are predictable and bundling with new-vehicle sales raises attachment, while minimal market growth makes steady cash generation. Keep catalogs fresh and logistics sharp — easy milk.
- High-margin recurring revenue
- Predictable take rate; bundling boosts attachment
- Low growth, high profitability
- Focus: catalogs, inventory, logistics
Conventional ICE powertrains
Conventional ICE powertrains: mature, fully amortized, and still sold in bulk across many regions; Toyota sold roughly 10 million vehicles worldwide in 2023 with ICE models comprising the majority, delivering strong unit economics even as regulatory headwinds rise; not a growth story but a cash fountain today used to fund the electrified pivot.
- Mature cash generator
- High unit margins
- Funds EV transition
Corolla, Camry & TFS: protect margins, parts logistics and credit quality to sustain cash flow
Corolla (>50m) and Camry (>19m) plus TFS and aftermarket parts are Toyota’s cash cows, funding R&D and dividends; FY2024 revenue ~36.1 trillion JPY and 9.76m vehicles sold in 2023 underpin predictable cash flow. Focus: maintain margins, credit quality, parts logistics to sustain free cash generation.
| Metric | Value |
|---|---|
| FY2024 revenue | 36.1 trillion JPY |
| Vehicles sold (2023) | 9.76 million |
| Corolla cumulative | >50 million |
| Camry cumulative | >19 million |
Full Transparency, Always
Toyota Motor BCG Matrix
The file you're previewing is the final Toyota Motor BCG Matrix you'll receive after purchase—no watermarks, no placeholders. It maps Toyota’s brands and business units into stars, cash cows, question marks, and dogs with clear visuals and concise analysis. Ready to download, edit, or present immediately. This is the exact, production-ready report—no surprises, just strategic clarity.
Description
See the Bigger Picture
Toyota’s BCG Matrix snapshot shows which models are driving growth, which fund the business, and which may be dragging you down — a quick map of product health and cash flow. This preview teases the story; buy the full BCG Matrix to get quadrant-by-quadrant placements, clear investment priorities, and tactical moves tailored to Toyota’s markets. Get the full report in Word and Excel and skip the guesswork — actionable insights you can present and act on today.
Stars
Hybrid lineup (Prius, RAV4 Hybrid, Corolla Hybrid)
High growth, high share — Toyota wrote the hybrid playbook and still owns it; Prius, RAV4 Hybrid and Corolla Hybrid anchor a segment where demand keeps climbing as fleets and households chase efficiency without range anxiety. Hybrids soak up capex in batteries and marketing but pay back through volume and pricing power. Toyota has sold over 20 million hybrids worldwide since 1997, so keep feeding this engine to mature into even bigger cash later.
Global SUVs/CUVs (RAV4, Corolla Cross, Highlander)
Global SUVs/CUVs (RAV4, Corolla Cross, Highlander) sit in Toyota’s Stars quadrant as SUVs keep expanding; Toyota holds top-tier share with SUVs/CUVs representing about 30% of group volume in 2024. RAV4 remains the volume beast (~760,000 units global 2024) with a ~60% hybrid mix boosting margins. Competition forces heavy promo and placement, but strong demand and hybrid economics mean holding share will convert these into prime milkers as growth cools.
North America mid-size pickups (Tacoma)
North America mid-size pickup segment keeps expanding and Tacoma remains sticky with 2023 US sales of 165,662, anchoring roughly one of Toyota’s strongest light-truck positions.
New‑generation Tacoma (2024) adds i-FORCE MAX hybrid powertrains and higher average transaction prices, while Toyota Genuine Accessories and TRD options drive aftermarket margin upside.
Production, trim complexity and marketing require heavy capital, so Toyota’s play is defend the throne and scale capacity where regional demand concentrates.
Emerging markets trucks (Hilux, IMV platform)
Construction, logistics, and small business formation keep emerging markets expanding, with IMF 2024 projecting emerging market growth near 4.1%; Hilux leadership and trust drive repeat buys and government fleet adoption, but currency swings and policy risks persist, so continue investing in localized specs and rugged aftersales to lock share.
- IMF 2024: EM growth ~4.1%
- Hilux: strong repeat/government demand
- Priority: local specs + robust aftersales
Lexus hybrids in growth luxury pockets
Lexus hybrids are gaining in select luxury pockets as luxury rebounds in regions like China and the Middle East; their hybrid tech offers a compelling mix of lower total cost of ownership and refinement that resonates with reliability-first buyers and supports strong share among that cohort.
Sustained brand investment and elevated dealer experience are required to scale penetration; if Lexus maintains share as the segment expands, hybrids can transition from a growth Stars position to a cash cow.
- Position: Stars
- Strengths: TCO + refinement, reliability-led share
- Opportunities: China, Middle East expansion
- Needs: sustained brand spend, dealer experience
- Upside: could graduate to Cash Cow if share holds
Hybrids and SUVs drive growth; Tacoma i-FORCE MAX lifts ASPs
Toys Stars: hybrids (20M sold since 1997) and SUVs/CUVs (≈30% group volume in 2024; RAV4 ~760,000 units 2024) drive high growth/high share; Tacoma sticky (US 2023 sales 165,662) with new i-FORCE MAX boosting ASPs. Heavy capex in powertrain/production required, but strong hybrid mix and regional SUV demand should convert Stars to future cash cows as growth moderates.
| Segment | 2024 metric | Note |
|---|---|---|
| Hybrids | 20M units cumulative | Volume + margin tailwinds |
| RAV4 | ~760,000 units | ~60% hybrid mix |
| SUVs/CUVs | ~30% group vol (2024) | Top-tier share |
| Tacoma | 165,662 US (2023) | i-FORCE MAX ups ASP |
What is included in the product
Detailed Word Document
BCG analysis of Toyota: Stars (EVs), Cash Cows (hybrids), Question Marks (mobility services), Dogs (low-margin models); invest, hold, divest.
Customizable Excel Spreadsheet
One-page Toyota BCG Matrix pinpointing weak units and growth bets for fast C-level decisions.
Cash Cows
Corolla and Camry (mature global sedans)
Corolla and Camry, with Corolla’s cumulative sales exceeding 50 million units and Camry’s over 19 million, form Toyota’s cash cows—massive installed base drives steady replacement cycles and predictable margins. Growth for global sedans is flat-to-declining, but scale economics and proven tooling keep cash flowing. Promotional spend is lower than SUVs; loyalty sustains volumes while Toyota optimizes trims and cost.
Toyota Financial Services (retail loans & leasing)
Toyota Financial Services, operating in 30+ countries, delivers high share and disciplined credit underwriting with sticky dealer relationships that generate dependable cash flow.
Growth is modest but attractive yields and cross-sell (insurance, aftercare) keep the meter running, funding R&D and cushioning cyclical downturns while supporting dividend capacity.
Maintain tight credit quality metrics and seamless digital origination/servicing to preserve this cash-cow franchise and keep milking.
After-sales service network
After-sales service bays track car parc, not market growth, and Toyota’s massive installed base—9.76 million vehicles sold in 2023—creates a large, predictable service funnel. Parts, maintenance plans and certified pre-owned programs generate recurring cash with low incremental capex once the network is built. Leaning into parts availability and service efficiency can meaningfully nudge aftermarket margins and free cash flow.
Parts & accessories (OEM)
Parts & accessories (OEM) are high-margin add-ons riding Toyota’s giant installed base; FY2024 consolidated revenue was about 36.1 trillion JPY, and parts sales deliver outsized profitability despite low unit growth. Take rates are predictable and bundling with new-vehicle sales raises attachment, while minimal market growth makes steady cash generation. Keep catalogs fresh and logistics sharp — easy milk.
- High-margin recurring revenue
- Predictable take rate; bundling boosts attachment
- Low growth, high profitability
- Focus: catalogs, inventory, logistics
Conventional ICE powertrains
Conventional ICE powertrains: mature, fully amortized, and still sold in bulk across many regions; Toyota sold roughly 10 million vehicles worldwide in 2023 with ICE models comprising the majority, delivering strong unit economics even as regulatory headwinds rise; not a growth story but a cash fountain today used to fund the electrified pivot.
- Mature cash generator
- High unit margins
- Funds EV transition
Corolla, Camry & TFS: protect margins, parts logistics and credit quality to sustain cash flow
Corolla (>50m) and Camry (>19m) plus TFS and aftermarket parts are Toyota’s cash cows, funding R&D and dividends; FY2024 revenue ~36.1 trillion JPY and 9.76m vehicles sold in 2023 underpin predictable cash flow. Focus: maintain margins, credit quality, parts logistics to sustain free cash generation.
| Metric | Value |
|---|---|
| FY2024 revenue | 36.1 trillion JPY |
| Vehicles sold (2023) | 9.76 million |
| Corolla cumulative | >50 million |
| Camry cumulative | >19 million |
Full Transparency, Always
Toyota Motor BCG Matrix
The file you're previewing is the final Toyota Motor BCG Matrix you'll receive after purchase—no watermarks, no placeholders. It maps Toyota’s brands and business units into stars, cash cows, question marks, and dogs with clear visuals and concise analysis. Ready to download, edit, or present immediately. This is the exact, production-ready report—no surprises, just strategic clarity.











