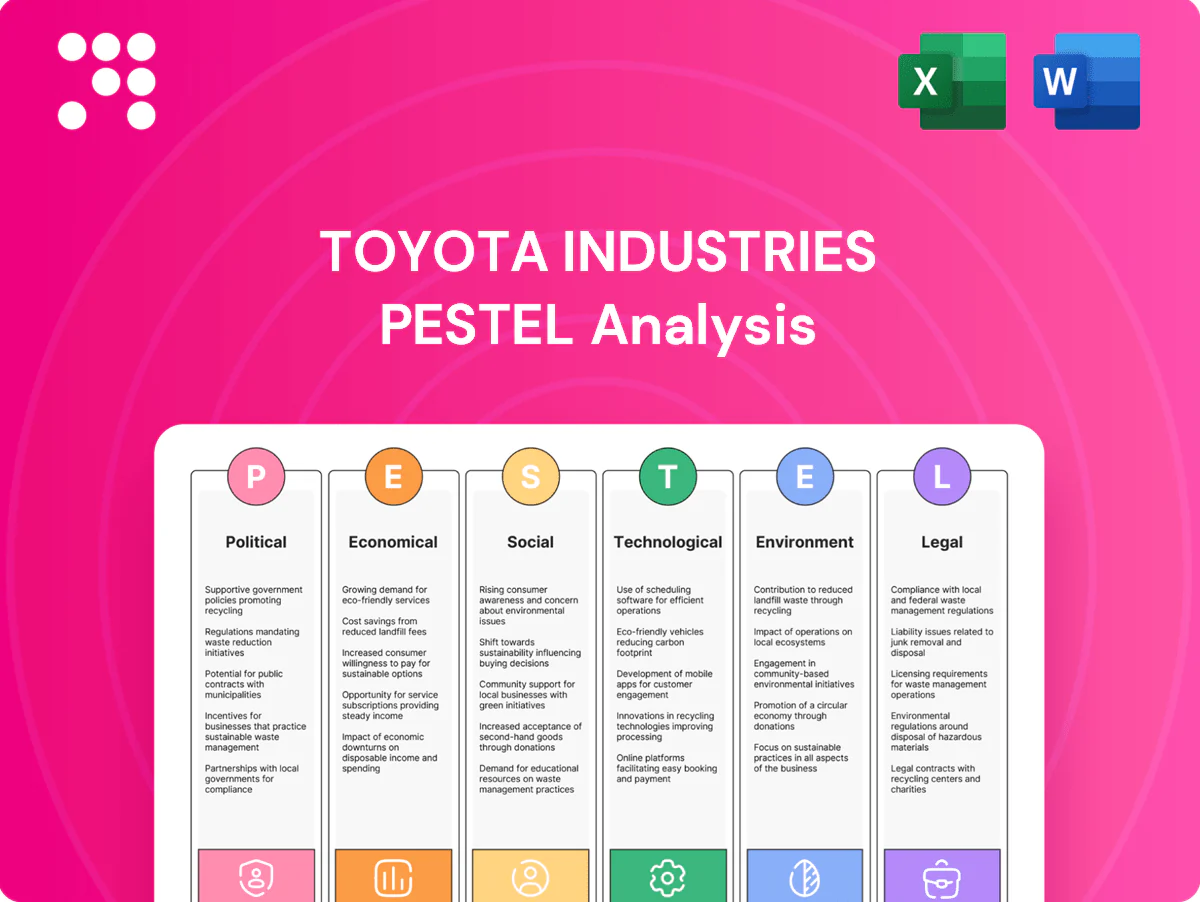
Toyota Industries PESTLE Analysis

Your Competitive Advantage Starts with This Report
Our PESTLE analysis of Toyota Industries reveals how political regulations, shifting economic conditions, technological innovation, social trends, and environmental and legal pressures shape its competitive position. Use these insights to anticipate risks and uncover growth opportunities. Purchase the full report for the complete, ready-to-use breakdown and actionable recommendations.
Political factors

Trade policy volatility
Shifts in tariffs and trade agreements — e.g., US Section 301 tariffs on roughly $360bn of Chinese goods and the EU-Japan EPA (in force 2019 covering >99% of tariff lines) — directly affect cross-border sales of Toyota Industries' forklifts, compressors and components. US-China and EU-Japan policy changes can raise sourcing costs and force price moves. Diversifying manufacturing footprints, using FTZs and local-for-local production plus proactive customs optimization reduce exposure.
Industrial subsidies
Government incentives shape demand: US Inflation Reduction Act allocated about $369 billion for clean energy, the EU Recovery and Resilience Facility totals roughly €672.5 billion, and Japan targets carbon neutrality by 2050 with a national hydrogen strategy. Subsidy eligibility can materially lower customers’ TCO for material‑handling fleets; aligning roadmaps with national programs raises procurement win rates, while monitoring claw‑backs and compliance remains essential.

Geopolitical supply risk
Regional tensions can disrupt semiconductors (global market $527B in 2023), steel (≈1.8 billion tonnes global crude in 2023) and rare earths (China 58% of production in 2023), while widening sanctions and export controls constrain electronics and advanced compressors. Toyota Industries boosts resilience via multi-sourcing and buffer inventories, and uses geographical risk mapping to steer CAPEX location choices and supply-chain investments.

Public procurement & infrastructure
Government infrastructure and smart-port investments are driving orders for Toyota Industries logistics solutions, with global smart-port spending surpassing 4 billion USD in 2024 and rising double-digits year-on-year, boosting demand for automated forklifts and container-handling systems. Buy-local procurement rules in several markets shift bid strategy toward local production and JV partnerships. Long public budget cycles require early engagement and strict specs alignment; compliance with tender rules is mandatory.
- Smart-port spend 2024: >4B USD
- Buy-local: affects localization & JV strategy
- Early engagement: essential for long budget cycles
- Compliance: public tender rules mandatory
Labor & immigration policy
- Work visas: skilled talent access
- 2.33M foreign workers in Japan (2023)
- Minimum wage pressures: US federal $7.25/hr
- Higher automation demand where labor scarce
- Continuous workforce-policy monitoring
Trade policy and incentives reshape electrified equipment sourcing amid chip and rare-earth risks
Tariff shifts and trade policy (eg US Section 301, EU-Japan EPA) directly affect Toyota Industries’ cross-border sales and sourcing costs. Government incentives (IRA ~$369B, EU RRF €672.5B, Japan carbon-neutral by 2050) and smart-port spend (>4B USD 2024) drive demand for electrified and automated equipment. Regional tensions risk semiconductors ($527B 2023) and rare earths (China 58% 2023), forcing multi-sourcing.
| Political Factor | Key 2023/24 Data |
|---|---|
| Clean-energy incentives | IRA ~$369B; EU RRF €672.5B |
| Smart-port spend | >4B USD (2024) |
| Semiconductors | $527B (2023) |
| Rare earths | China 58% (2023) |
What is included in the product
 Detailed Word Document
Explores how Political, Economic, Social, Technological, Environmental and Legal factors uniquely impact Toyota Industries, with each section backed by current data and trends to reveal actionable threats and opportunities for executives, consultants, and entrepreneurs and to support strategy, scenario planning, and investor-grade reporting.

 Customizable Excel Spreadsheet
A concise, visually segmented PESTLE summary for Toyota Industries that distills regulatory, economic, and technological risks into an easily shareable slide or meeting note to speed strategic alignment.
Economic factors

Global capex cycles
Enterprise capex in 2024—notably warehouse and factory upgrades—directly lifts forklift and AGV demand as the global warehouse automation market exceeded roughly $22 billion in 2023 and is forecast to grow double digits through 2028; downturns delay fleet renewals and cut short-cycle orders, while multi-industry diversification (manufacturing, retail, ports) reduces revenue volatility and equipment+service bundling lifts recurring revenue and stabilizes margins.
FX fluctuations
Yen volatility (around 150 JPY/USD in 2024) and USD, EUR and RMB swings materially affect Toyota Industries’ product competitiveness and margins across markets; a weaker yen boosts export competitiveness but compresses dollar- and euro-linked input costs. The company reduces exposure through natural hedging via local production/sourcing (high overseas production footprint), pricing clauses and financial hedges to protect cash flows. FX also alters consolidated profit via translation of overseas earnings.

Commodity prices
Steel, copper, aluminum and plastics swings directly reshape Toyota Industries BOM; LME copper near $8,500/ton and aluminium ~ $2,200/ton (mid‑2025) raise input costs, while hot‑rolled steel spot around $800/ton shifts vehicle and compressor margins. Rising energy prices (global Brent ~$85/barrel) change compressor operating‑cost narratives for customers. Long‑term contracts and design‑to‑cost reduce exposure, but timely cost pass‑through remains critical to protect margins.

Interest rates & credit
Higher global policy rates—US Fed funds 5.25–5.50% in 2024–25—raise fleet leasing costs and can slow orders for Toyota Industries’ material-handling equipment. Customer access to credit directly affects automation adoption, while vendor financing and flexible leases increasingly sustain demand. Working capital efficiency becomes more critical as receivables and inventory cycles tighten.
- Higher rates: US Fed 5.25–5.50% (2024–25)
- Leasing costs up, order risk
- Vendor finance and flexible leases sustain demand
- Working capital focus: tighter receivables/inventory
Automation ROI & productivity
Wage inflation (4–6% in major markets 2023–24) and rising throughput demands make AGVs/AMRs compelling for Toyota Industries, with industry payback commonly cited at 12–24 months; clear ROI models have sped adoption across 3PL and e-commerce after global e-commerce sales hit about 5.7 trillion USD in 2022. Recurring service and software subscriptions lift lifetime value and annuity-like revenue, while persistent macro productivity shortfalls create structural tailwinds for automation spend.
- Wage inflation: 4–6% (major markets, 2023–24)
- AGV/AMR payback: 12–24 months (industry reports)
- E-commerce scale: ~5.7T USD sales (2022)
- Subscriptions: higher LTV, recurring revenue
Trade policy and incentives reshape electrified equipment sourcing amid chip and rare-earth risks
Warehouse automation demand (> $22B global market 2023) and rising wages (4–6% 2023–24) boost forklift/AGV sales; payback 12–24 months. FX (JPY ~150/USD in 2024) and Fed rates 5.25–5.50% (2024–25) affect margins, leasing and order timing. Commodity costs (Cu ~$8,500/t, Al ~$2,200/t, HRC ~$800/t, Brent ~$85/bbl) pressure BOM but long contracts/hedges mitigate.
| Metric | Value |
|---|---|
| Warehouse automation | > $22B (2023) |
| JPY/USD | ~150 (2024) |
| Fed funds | 5.25–5.50% (2024–25) |
| Copper/Al/Steel/Brent | $8,500/$2,200/$800/$85 |
Preview Before You Purchase
Toyota Industries PESTLE Analysis
The preview shown here is the exact Toyota Industries PESTLE Analysis document you’ll receive after purchase—fully formatted and ready to use. It covers political, economic, social, technological, legal, and environmental factors with professional structure and actionable insights. What you see is the final file available for immediate download post-payment.

Your Competitive Advantage Starts with This Report
Our PESTLE analysis of Toyota Industries reveals how political regulations, shifting economic conditions, technological innovation, social trends, and environmental and legal pressures shape its competitive position. Use these insights to anticipate risks and uncover growth opportunities. Purchase the full report for the complete, ready-to-use breakdown and actionable recommendations.
Political factors
Trade policy volatility
Shifts in tariffs and trade agreements — e.g., US Section 301 tariffs on roughly $360bn of Chinese goods and the EU-Japan EPA (in force 2019 covering >99% of tariff lines) — directly affect cross-border sales of Toyota Industries' forklifts, compressors and components. US-China and EU-Japan policy changes can raise sourcing costs and force price moves. Diversifying manufacturing footprints, using FTZs and local-for-local production plus proactive customs optimization reduce exposure.
Industrial subsidies
Government incentives shape demand: US Inflation Reduction Act allocated about $369 billion for clean energy, the EU Recovery and Resilience Facility totals roughly €672.5 billion, and Japan targets carbon neutrality by 2050 with a national hydrogen strategy. Subsidy eligibility can materially lower customers’ TCO for material‑handling fleets; aligning roadmaps with national programs raises procurement win rates, while monitoring claw‑backs and compliance remains essential.
Geopolitical supply risk
Regional tensions can disrupt semiconductors (global market $527B in 2023), steel (≈1.8 billion tonnes global crude in 2023) and rare earths (China 58% of production in 2023), while widening sanctions and export controls constrain electronics and advanced compressors. Toyota Industries boosts resilience via multi-sourcing and buffer inventories, and uses geographical risk mapping to steer CAPEX location choices and supply-chain investments.
Public procurement & infrastructure
Government infrastructure and smart-port investments are driving orders for Toyota Industries logistics solutions, with global smart-port spending surpassing 4 billion USD in 2024 and rising double-digits year-on-year, boosting demand for automated forklifts and container-handling systems. Buy-local procurement rules in several markets shift bid strategy toward local production and JV partnerships. Long public budget cycles require early engagement and strict specs alignment; compliance with tender rules is mandatory.
- Smart-port spend 2024: >4B USD
- Buy-local: affects localization & JV strategy
- Early engagement: essential for long budget cycles
- Compliance: public tender rules mandatory
Labor & immigration policy
- Work visas: skilled talent access
- 2.33M foreign workers in Japan (2023)
- Minimum wage pressures: US federal $7.25/hr
- Higher automation demand where labor scarce
- Continuous workforce-policy monitoring
Trade policy and incentives reshape electrified equipment sourcing amid chip and rare-earth risks
Tariff shifts and trade policy (eg US Section 301, EU-Japan EPA) directly affect Toyota Industries’ cross-border sales and sourcing costs. Government incentives (IRA ~$369B, EU RRF €672.5B, Japan carbon-neutral by 2050) and smart-port spend (>4B USD 2024) drive demand for electrified and automated equipment. Regional tensions risk semiconductors ($527B 2023) and rare earths (China 58% 2023), forcing multi-sourcing.
| Political Factor | Key 2023/24 Data |
|---|---|
| Clean-energy incentives | IRA ~$369B; EU RRF €672.5B |
| Smart-port spend | >4B USD (2024) |
| Semiconductors | $527B (2023) |
| Rare earths | China 58% (2023) |
What is included in the product
Detailed Word Document
Explores how Political, Economic, Social, Technological, Environmental and Legal factors uniquely impact Toyota Industries, with each section backed by current data and trends to reveal actionable threats and opportunities for executives, consultants, and entrepreneurs and to support strategy, scenario planning, and investor-grade reporting.
Customizable Excel Spreadsheet
A concise, visually segmented PESTLE summary for Toyota Industries that distills regulatory, economic, and technological risks into an easily shareable slide or meeting note to speed strategic alignment.
Economic factors
Global capex cycles
Enterprise capex in 2024—notably warehouse and factory upgrades—directly lifts forklift and AGV demand as the global warehouse automation market exceeded roughly $22 billion in 2023 and is forecast to grow double digits through 2028; downturns delay fleet renewals and cut short-cycle orders, while multi-industry diversification (manufacturing, retail, ports) reduces revenue volatility and equipment+service bundling lifts recurring revenue and stabilizes margins.
FX fluctuations
Yen volatility (around 150 JPY/USD in 2024) and USD, EUR and RMB swings materially affect Toyota Industries’ product competitiveness and margins across markets; a weaker yen boosts export competitiveness but compresses dollar- and euro-linked input costs. The company reduces exposure through natural hedging via local production/sourcing (high overseas production footprint), pricing clauses and financial hedges to protect cash flows. FX also alters consolidated profit via translation of overseas earnings.
Commodity prices
Steel, copper, aluminum and plastics swings directly reshape Toyota Industries BOM; LME copper near $8,500/ton and aluminium ~ $2,200/ton (mid‑2025) raise input costs, while hot‑rolled steel spot around $800/ton shifts vehicle and compressor margins. Rising energy prices (global Brent ~$85/barrel) change compressor operating‑cost narratives for customers. Long‑term contracts and design‑to‑cost reduce exposure, but timely cost pass‑through remains critical to protect margins.
Interest rates & credit
Higher global policy rates—US Fed funds 5.25–5.50% in 2024–25—raise fleet leasing costs and can slow orders for Toyota Industries’ material-handling equipment. Customer access to credit directly affects automation adoption, while vendor financing and flexible leases increasingly sustain demand. Working capital efficiency becomes more critical as receivables and inventory cycles tighten.
- Higher rates: US Fed 5.25–5.50% (2024–25)
- Leasing costs up, order risk
- Vendor finance and flexible leases sustain demand
- Working capital focus: tighter receivables/inventory
Automation ROI & productivity
Wage inflation (4–6% in major markets 2023–24) and rising throughput demands make AGVs/AMRs compelling for Toyota Industries, with industry payback commonly cited at 12–24 months; clear ROI models have sped adoption across 3PL and e-commerce after global e-commerce sales hit about 5.7 trillion USD in 2022. Recurring service and software subscriptions lift lifetime value and annuity-like revenue, while persistent macro productivity shortfalls create structural tailwinds for automation spend.
- Wage inflation: 4–6% (major markets, 2023–24)
- AGV/AMR payback: 12–24 months (industry reports)
- E-commerce scale: ~5.7T USD sales (2022)
- Subscriptions: higher LTV, recurring revenue
Trade policy and incentives reshape electrified equipment sourcing amid chip and rare-earth risks
Warehouse automation demand (> $22B global market 2023) and rising wages (4–6% 2023–24) boost forklift/AGV sales; payback 12–24 months. FX (JPY ~150/USD in 2024) and Fed rates 5.25–5.50% (2024–25) affect margins, leasing and order timing. Commodity costs (Cu ~$8,500/t, Al ~$2,200/t, HRC ~$800/t, Brent ~$85/bbl) pressure BOM but long contracts/hedges mitigate.
| Metric | Value |
|---|---|
| Warehouse automation | > $22B (2023) |
| JPY/USD | ~150 (2024) |
| Fed funds | 5.25–5.50% (2024–25) |
| Copper/Al/Steel/Brent | $8,500/$2,200/$800/$85 |
Preview Before You Purchase
Toyota Industries PESTLE Analysis
The preview shown here is the exact Toyota Industries PESTLE Analysis document you’ll receive after purchase—fully formatted and ready to use. It covers political, economic, social, technological, legal, and environmental factors with professional structure and actionable insights. What you see is the final file available for immediate download post-payment.
Original: $10.00
-65%$10.00
$3.50Description
Your Competitive Advantage Starts with This Report
Our PESTLE analysis of Toyota Industries reveals how political regulations, shifting economic conditions, technological innovation, social trends, and environmental and legal pressures shape its competitive position. Use these insights to anticipate risks and uncover growth opportunities. Purchase the full report for the complete, ready-to-use breakdown and actionable recommendations.
Political factors
Trade policy volatility
Shifts in tariffs and trade agreements — e.g., US Section 301 tariffs on roughly $360bn of Chinese goods and the EU-Japan EPA (in force 2019 covering >99% of tariff lines) — directly affect cross-border sales of Toyota Industries' forklifts, compressors and components. US-China and EU-Japan policy changes can raise sourcing costs and force price moves. Diversifying manufacturing footprints, using FTZs and local-for-local production plus proactive customs optimization reduce exposure.
Industrial subsidies
Government incentives shape demand: US Inflation Reduction Act allocated about $369 billion for clean energy, the EU Recovery and Resilience Facility totals roughly €672.5 billion, and Japan targets carbon neutrality by 2050 with a national hydrogen strategy. Subsidy eligibility can materially lower customers’ TCO for material‑handling fleets; aligning roadmaps with national programs raises procurement win rates, while monitoring claw‑backs and compliance remains essential.
Geopolitical supply risk
Regional tensions can disrupt semiconductors (global market $527B in 2023), steel (≈1.8 billion tonnes global crude in 2023) and rare earths (China 58% of production in 2023), while widening sanctions and export controls constrain electronics and advanced compressors. Toyota Industries boosts resilience via multi-sourcing and buffer inventories, and uses geographical risk mapping to steer CAPEX location choices and supply-chain investments.
Public procurement & infrastructure
Government infrastructure and smart-port investments are driving orders for Toyota Industries logistics solutions, with global smart-port spending surpassing 4 billion USD in 2024 and rising double-digits year-on-year, boosting demand for automated forklifts and container-handling systems. Buy-local procurement rules in several markets shift bid strategy toward local production and JV partnerships. Long public budget cycles require early engagement and strict specs alignment; compliance with tender rules is mandatory.
- Smart-port spend 2024: >4B USD
- Buy-local: affects localization & JV strategy
- Early engagement: essential for long budget cycles
- Compliance: public tender rules mandatory
Labor & immigration policy
- Work visas: skilled talent access
- 2.33M foreign workers in Japan (2023)
- Minimum wage pressures: US federal $7.25/hr
- Higher automation demand where labor scarce
- Continuous workforce-policy monitoring
Trade policy and incentives reshape electrified equipment sourcing amid chip and rare-earth risks
Tariff shifts and trade policy (eg US Section 301, EU-Japan EPA) directly affect Toyota Industries’ cross-border sales and sourcing costs. Government incentives (IRA ~$369B, EU RRF €672.5B, Japan carbon-neutral by 2050) and smart-port spend (>4B USD 2024) drive demand for electrified and automated equipment. Regional tensions risk semiconductors ($527B 2023) and rare earths (China 58% 2023), forcing multi-sourcing.
| Political Factor | Key 2023/24 Data |
|---|---|
| Clean-energy incentives | IRA ~$369B; EU RRF €672.5B |
| Smart-port spend | >4B USD (2024) |
| Semiconductors | $527B (2023) |
| Rare earths | China 58% (2023) |
What is included in the product
Detailed Word Document
Explores how Political, Economic, Social, Technological, Environmental and Legal factors uniquely impact Toyota Industries, with each section backed by current data and trends to reveal actionable threats and opportunities for executives, consultants, and entrepreneurs and to support strategy, scenario planning, and investor-grade reporting.
Customizable Excel Spreadsheet
A concise, visually segmented PESTLE summary for Toyota Industries that distills regulatory, economic, and technological risks into an easily shareable slide or meeting note to speed strategic alignment.
Economic factors
Global capex cycles
Enterprise capex in 2024—notably warehouse and factory upgrades—directly lifts forklift and AGV demand as the global warehouse automation market exceeded roughly $22 billion in 2023 and is forecast to grow double digits through 2028; downturns delay fleet renewals and cut short-cycle orders, while multi-industry diversification (manufacturing, retail, ports) reduces revenue volatility and equipment+service bundling lifts recurring revenue and stabilizes margins.
FX fluctuations
Yen volatility (around 150 JPY/USD in 2024) and USD, EUR and RMB swings materially affect Toyota Industries’ product competitiveness and margins across markets; a weaker yen boosts export competitiveness but compresses dollar- and euro-linked input costs. The company reduces exposure through natural hedging via local production/sourcing (high overseas production footprint), pricing clauses and financial hedges to protect cash flows. FX also alters consolidated profit via translation of overseas earnings.
Commodity prices
Steel, copper, aluminum and plastics swings directly reshape Toyota Industries BOM; LME copper near $8,500/ton and aluminium ~ $2,200/ton (mid‑2025) raise input costs, while hot‑rolled steel spot around $800/ton shifts vehicle and compressor margins. Rising energy prices (global Brent ~$85/barrel) change compressor operating‑cost narratives for customers. Long‑term contracts and design‑to‑cost reduce exposure, but timely cost pass‑through remains critical to protect margins.
Interest rates & credit
Higher global policy rates—US Fed funds 5.25–5.50% in 2024–25—raise fleet leasing costs and can slow orders for Toyota Industries’ material-handling equipment. Customer access to credit directly affects automation adoption, while vendor financing and flexible leases increasingly sustain demand. Working capital efficiency becomes more critical as receivables and inventory cycles tighten.
- Higher rates: US Fed 5.25–5.50% (2024–25)
- Leasing costs up, order risk
- Vendor finance and flexible leases sustain demand
- Working capital focus: tighter receivables/inventory
Automation ROI & productivity
Wage inflation (4–6% in major markets 2023–24) and rising throughput demands make AGVs/AMRs compelling for Toyota Industries, with industry payback commonly cited at 12–24 months; clear ROI models have sped adoption across 3PL and e-commerce after global e-commerce sales hit about 5.7 trillion USD in 2022. Recurring service and software subscriptions lift lifetime value and annuity-like revenue, while persistent macro productivity shortfalls create structural tailwinds for automation spend.
- Wage inflation: 4–6% (major markets, 2023–24)
- AGV/AMR payback: 12–24 months (industry reports)
- E-commerce scale: ~5.7T USD sales (2022)
- Subscriptions: higher LTV, recurring revenue
Trade policy and incentives reshape electrified equipment sourcing amid chip and rare-earth risks
Warehouse automation demand (> $22B global market 2023) and rising wages (4–6% 2023–24) boost forklift/AGV sales; payback 12–24 months. FX (JPY ~150/USD in 2024) and Fed rates 5.25–5.50% (2024–25) affect margins, leasing and order timing. Commodity costs (Cu ~$8,500/t, Al ~$2,200/t, HRC ~$800/t, Brent ~$85/bbl) pressure BOM but long contracts/hedges mitigate.
| Metric | Value |
|---|---|
| Warehouse automation | > $22B (2023) |
| JPY/USD | ~150 (2024) |
| Fed funds | 5.25–5.50% (2024–25) |
| Copper/Al/Steel/Brent | $8,500/$2,200/$800/$85 |
Preview Before You Purchase
Toyota Industries PESTLE Analysis
The preview shown here is the exact Toyota Industries PESTLE Analysis document you’ll receive after purchase—fully formatted and ready to use. It covers political, economic, social, technological, legal, and environmental factors with professional structure and actionable insights. What you see is the final file available for immediate download post-payment.











