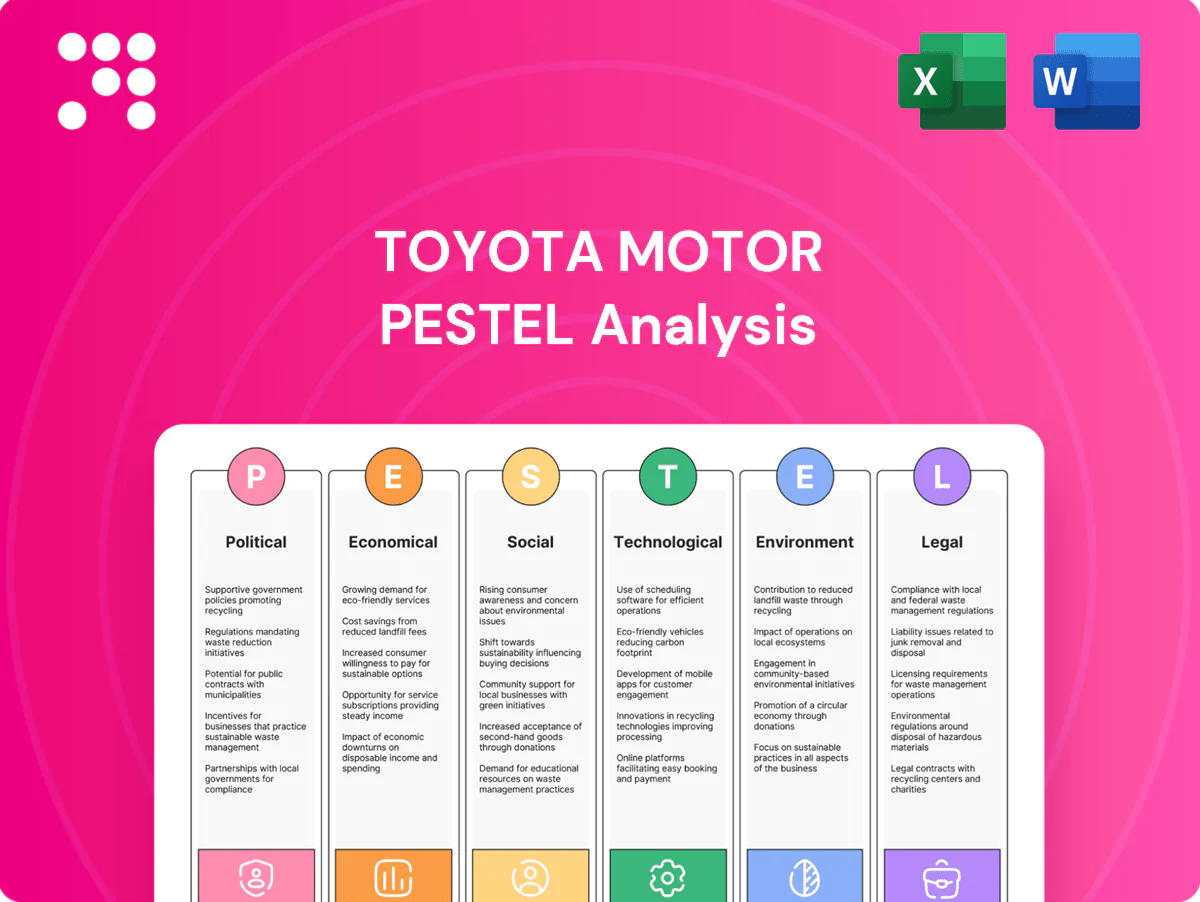
Toyota Motor PESTLE Analysis

Make Smarter Strategic Decisions with a Complete PESTEL View
Discover how political shifts, economic cycles, and rapid technological change are reshaping Toyota Motor’s strategic landscape in our concise PESTLE overview; perfect for investors and strategists seeking clarity. Purchase the full analysis for actionable insights, data-driven risk assessments, and ready-to-use recommendations you can download instantly.
Political factors

Trade policies and tariffs impact global vehicle flows
Shifts in US (2.5% passenger cars, 25% light trucks), EU (about 10% external tariff) and China (around 15% passenger car import tariff) regimes can materially alter Toyota’s export economics and pricing power. Localization hedges duties but requires multi‑billion USD capex; Toyota operates over 70 plants in 28 countries enabling supply rerouting. Ongoing geopolitical tensions force regular scenario planning across markets.
Government incentives for EVs and hybrids steer product mix
Subsidies and tax credits such as the US Inflation Reduction Act credit up to $7,500 and national subsidies in Europe and Asia, plus ZEV mandates (California 2035, UK new‑ICE ban 2030), push Toyota to reallocate between BEVs, HEVs and PHEVs; markets with strong incentives accelerate BEV uptake despite higher unit costs. Policy uncertainty risks stranded BEV investments, while Toyota’s hybrid expertise and its roughly $70bn electrification commitment through 2030 provide portfolio flexibility across cycles.

Industrial policies and local content rules shape sourcing
The IRA offers up to $7,500 EV tax credit tied to strict local content and mineral rules; EU Battery Regulation mandates traceability, recycled-content and a battery passport phased in to 2027; ASEAN typically requires ~40% regional value content for tariff/preference eligibility. Compliance forces supplier relocation and joint ventures, makes battery‑precursor sourcing a geopolitical issue, and compels Toyota to trade cost, credit eligibility and supply resilience.

Political stability in manufacturing hubs affects continuity
Political volatility in key hubs — elections in the US (Nov 2024) and India (Apr–May 2024), Thailand (Nov 2023), plus recurring labor actions such as the 2023 US auto strikes — can interrupt Toyota production and supply chains; contingency inventory and multi-source tooling are used to limit downtime. Secure logistics corridors are critical and insurance/risk premiums can spike suddenly, increasing operating costs.
- Strikes: 2023 US auto strike example
- Elections: US 2024, India 2024, Thailand 2023
- Mitigation: contingency inventory, multi-source tooling
- Risks: logistics security, rising insurance premiums
Sanctions and export controls constrain technology access
US-led export controls expanded in 2023–24, restricting advanced semiconductors and EDA software that underpin ADAS and connected services, creating supply‑chain risk for Toyota’s sensor and ECU sourcing. Country-specific sanctions since 2022 (notably Russia) have limited market access and local partnerships. Compliance and export-control systems must be robust across all entities, and dual-use technologies require heightened licensing and oversight.
- impact: ADAS/connectivity supply risk due to 2023–24 controls
- market: sanctions since 2022 constrain presence/partners
- compliance: enterprise-wide export controls needed
- tech: dual-use items face stricter licensing
Tariffs, incentives and chip limits reshape automaker costs; 70bn EV hedge
Tightening tariffs (US 2.5% cars/25% light trucks; China ~15% car import) and incentives (US IRA up to 7,500) materially affect Toyota’s pricing and localization capex; Toyota runs >70 plants in 28 countries and pledged ~70bn USD to electrification through 2030 to hedge. Geopolitical/export controls (2023–24 semiconductor limits) and election/labor risks raise supply, compliance and insurance costs. Regulatory rules (EU battery regs, ZEV mandates) force supplier relocation and eligibility trade‑offs.
| Factor | Key Data | Impact |
|---|---|---|
| Tariffs | US 2.5%/25%, China ~15% | Export economics, localize plants |
| Incentives | IRA up to 7,500; BEV mandates (CA 2035) | Drives BEV uptake, eligibility costs |
| Supply controls | 2023–24 chip export limits | ADAS/ECU sourcing risk |
What is included in the product
 Detailed Word Document
Explores how macro-environmental factors uniquely affect Toyota Motor across Political, Economic, Social, Technological, Environmental and Legal dimensions, with data-backed trends, forward-looking insights and detailed sub-points to support executives, investors and strategists in identifying risks, opportunities and actionable responses.

 Customizable Excel Spreadsheet
A clean, visually segmented PESTLE summary for Toyota that’s easy to drop into presentations, editable for region- or business-line notes, and ideal for quick team alignment on external risks and market positioning.
Economic factors

Interest rates and credit cycles drive auto demand
Higher rates raise monthly payments and slow retail sales and leasing; with US policy rates at 5.25–5.50% and average new‑car loan rates near 8% in 2024, demand softened. Toyota Financial Services offsets some pressure via tailored APRs, balloon and lease programs to sustain volume. Credit normalization cut residual values roughly 10–15% from 2021 peaks, shifting mix toward lower‑risk trims. Divergent regional rates (US, Eurozone, Japan) complicate pricing and hedging globally.
Exchange rate volatility impacts margins and pricing
Yen moves directly affect Toyota’s export competitiveness and yen-denominated profit translation; Toyota sold about 10.5 million vehicles worldwide in 2023, magnifying FX effects on margins. Hedging programs smooth reported earnings but cannot fully offset sharp swings in USD/JPY or EUR/JPY. Ongoing localized sourcing and production reduce currency exposure over time, while pricing actions must balance brand positioning and demand elasticity.

Commodity and logistics costs pressure profitability
Steel, aluminum, battery materials and freight rate spikes have compressed Toyota’s margins by raising input and logistics costs across production and EV supply chains. Long-term purchasing contracts and material substitution strategies (e.g., reducing cobalt, shifting alloys) mitigate volatility. Even as global supply chains normalize, input-cost relief typically lags demand recovery. Ongoing kaizen and productivity gains help offset structural inflation.

Consumer shifts between segments affect mix
Preference swings to SUVs and crossovers—about 70% of US light‑vehicle sales in 2024 per Cox Automotive—boost Toyota’s revenue per unit as larger, higher‑margin models sell well; fleet and commercial cycles (stable demand for Hilux/Proace) smooth volatility; emerging markets favor affordable, durable models (strong Toyota sales in ASEAN/Latin America); Toyota’s broad lineup and ~10% global market share in 2024 enable agile allocation.
- SUV/CUV share US ~70% (2024)
- Toyota global share ~10% (2024)
- Commercial/fleet models add stability
- Emerging markets drive demand for affordable models
Macroeconomic growth in key regions sets volume trajectory
- US employment: unemployment ~3.6% (mid‑2025)
- China: GDP ~5% (2024), weaker consumer confidence
- India/ASEAN: India ~7% (2024), ASEAN ~4.5%–5%
- Strategy: competitive pricing, feature mix, flexible capacity
Tariffs, incentives and chip limits reshape automaker costs; 70bn EV hedge
Higher rates (US policy 5.25–5.50% mid‑2024; avg new‑car loan ≈8% in 2024) and residuals down ~10–15% from 2021 hit demand and margins; TFS uses tailored APRs/leases to sustain volume. Yen volatility affects translation—Toyota sold ~10.5M vehicles (2023); hedging and local production soften FX. SUV share US ~70% (2024); global share ~10% (2024).
| Metric | Value |
|---|---|
| US policy rate | 5.25–5.50% |
| Avg new‑car loan (2024) | ≈8% |
| Toyota sales (2023) | ≈10.5M |
| US SUV share (2024) | ≈70% |
Preview the Actual Deliverable
Toyota Motor PESTLE Analysis
The Toyota Motor PESTLE analysis examines political, economic, social, technological, legal, and environmental factors shaping Toyota’s strategic position, including trade policy impacts, supply‑chain risks, EV and hybrid technology trends, regulatory compliance, and sustainability initiatives. The preview shown here is the exact document you’ll receive after purchase—fully formatted and ready to use. It’s the final, downloadable file with no placeholders.

Make Smarter Strategic Decisions with a Complete PESTEL View
Discover how political shifts, economic cycles, and rapid technological change are reshaping Toyota Motor’s strategic landscape in our concise PESTLE overview; perfect for investors and strategists seeking clarity. Purchase the full analysis for actionable insights, data-driven risk assessments, and ready-to-use recommendations you can download instantly.
Political factors
Trade policies and tariffs impact global vehicle flows
Shifts in US (2.5% passenger cars, 25% light trucks), EU (about 10% external tariff) and China (around 15% passenger car import tariff) regimes can materially alter Toyota’s export economics and pricing power. Localization hedges duties but requires multi‑billion USD capex; Toyota operates over 70 plants in 28 countries enabling supply rerouting. Ongoing geopolitical tensions force regular scenario planning across markets.
Government incentives for EVs and hybrids steer product mix
Subsidies and tax credits such as the US Inflation Reduction Act credit up to $7,500 and national subsidies in Europe and Asia, plus ZEV mandates (California 2035, UK new‑ICE ban 2030), push Toyota to reallocate between BEVs, HEVs and PHEVs; markets with strong incentives accelerate BEV uptake despite higher unit costs. Policy uncertainty risks stranded BEV investments, while Toyota’s hybrid expertise and its roughly $70bn electrification commitment through 2030 provide portfolio flexibility across cycles.
Industrial policies and local content rules shape sourcing
The IRA offers up to $7,500 EV tax credit tied to strict local content and mineral rules; EU Battery Regulation mandates traceability, recycled-content and a battery passport phased in to 2027; ASEAN typically requires ~40% regional value content for tariff/preference eligibility. Compliance forces supplier relocation and joint ventures, makes battery‑precursor sourcing a geopolitical issue, and compels Toyota to trade cost, credit eligibility and supply resilience.
Political stability in manufacturing hubs affects continuity
Political volatility in key hubs — elections in the US (Nov 2024) and India (Apr–May 2024), Thailand (Nov 2023), plus recurring labor actions such as the 2023 US auto strikes — can interrupt Toyota production and supply chains; contingency inventory and multi-source tooling are used to limit downtime. Secure logistics corridors are critical and insurance/risk premiums can spike suddenly, increasing operating costs.
- Strikes: 2023 US auto strike example
- Elections: US 2024, India 2024, Thailand 2023
- Mitigation: contingency inventory, multi-source tooling
- Risks: logistics security, rising insurance premiums
Sanctions and export controls constrain technology access
US-led export controls expanded in 2023–24, restricting advanced semiconductors and EDA software that underpin ADAS and connected services, creating supply‑chain risk for Toyota’s sensor and ECU sourcing. Country-specific sanctions since 2022 (notably Russia) have limited market access and local partnerships. Compliance and export-control systems must be robust across all entities, and dual-use technologies require heightened licensing and oversight.
- impact: ADAS/connectivity supply risk due to 2023–24 controls
- market: sanctions since 2022 constrain presence/partners
- compliance: enterprise-wide export controls needed
- tech: dual-use items face stricter licensing
Tariffs, incentives and chip limits reshape automaker costs; 70bn EV hedge
Tightening tariffs (US 2.5% cars/25% light trucks; China ~15% car import) and incentives (US IRA up to 7,500) materially affect Toyota’s pricing and localization capex; Toyota runs >70 plants in 28 countries and pledged ~70bn USD to electrification through 2030 to hedge. Geopolitical/export controls (2023–24 semiconductor limits) and election/labor risks raise supply, compliance and insurance costs. Regulatory rules (EU battery regs, ZEV mandates) force supplier relocation and eligibility trade‑offs.
| Factor | Key Data | Impact |
|---|---|---|
| Tariffs | US 2.5%/25%, China ~15% | Export economics, localize plants |
| Incentives | IRA up to 7,500; BEV mandates (CA 2035) | Drives BEV uptake, eligibility costs |
| Supply controls | 2023–24 chip export limits | ADAS/ECU sourcing risk |
What is included in the product
Detailed Word Document
Explores how macro-environmental factors uniquely affect Toyota Motor across Political, Economic, Social, Technological, Environmental and Legal dimensions, with data-backed trends, forward-looking insights and detailed sub-points to support executives, investors and strategists in identifying risks, opportunities and actionable responses.
Customizable Excel Spreadsheet
A clean, visually segmented PESTLE summary for Toyota that’s easy to drop into presentations, editable for region- or business-line notes, and ideal for quick team alignment on external risks and market positioning.
Economic factors
Interest rates and credit cycles drive auto demand
Higher rates raise monthly payments and slow retail sales and leasing; with US policy rates at 5.25–5.50% and average new‑car loan rates near 8% in 2024, demand softened. Toyota Financial Services offsets some pressure via tailored APRs, balloon and lease programs to sustain volume. Credit normalization cut residual values roughly 10–15% from 2021 peaks, shifting mix toward lower‑risk trims. Divergent regional rates (US, Eurozone, Japan) complicate pricing and hedging globally.
Exchange rate volatility impacts margins and pricing
Yen moves directly affect Toyota’s export competitiveness and yen-denominated profit translation; Toyota sold about 10.5 million vehicles worldwide in 2023, magnifying FX effects on margins. Hedging programs smooth reported earnings but cannot fully offset sharp swings in USD/JPY or EUR/JPY. Ongoing localized sourcing and production reduce currency exposure over time, while pricing actions must balance brand positioning and demand elasticity.
Commodity and logistics costs pressure profitability
Steel, aluminum, battery materials and freight rate spikes have compressed Toyota’s margins by raising input and logistics costs across production and EV supply chains. Long-term purchasing contracts and material substitution strategies (e.g., reducing cobalt, shifting alloys) mitigate volatility. Even as global supply chains normalize, input-cost relief typically lags demand recovery. Ongoing kaizen and productivity gains help offset structural inflation.
Consumer shifts between segments affect mix
Preference swings to SUVs and crossovers—about 70% of US light‑vehicle sales in 2024 per Cox Automotive—boost Toyota’s revenue per unit as larger, higher‑margin models sell well; fleet and commercial cycles (stable demand for Hilux/Proace) smooth volatility; emerging markets favor affordable, durable models (strong Toyota sales in ASEAN/Latin America); Toyota’s broad lineup and ~10% global market share in 2024 enable agile allocation.
- SUV/CUV share US ~70% (2024)
- Toyota global share ~10% (2024)
- Commercial/fleet models add stability
- Emerging markets drive demand for affordable models
Macroeconomic growth in key regions sets volume trajectory
- US employment: unemployment ~3.6% (mid‑2025)
- China: GDP ~5% (2024), weaker consumer confidence
- India/ASEAN: India ~7% (2024), ASEAN ~4.5%–5%
- Strategy: competitive pricing, feature mix, flexible capacity
Tariffs, incentives and chip limits reshape automaker costs; 70bn EV hedge
Higher rates (US policy 5.25–5.50% mid‑2024; avg new‑car loan ≈8% in 2024) and residuals down ~10–15% from 2021 hit demand and margins; TFS uses tailored APRs/leases to sustain volume. Yen volatility affects translation—Toyota sold ~10.5M vehicles (2023); hedging and local production soften FX. SUV share US ~70% (2024); global share ~10% (2024).
| Metric | Value |
|---|---|
| US policy rate | 5.25–5.50% |
| Avg new‑car loan (2024) | ≈8% |
| Toyota sales (2023) | ≈10.5M |
| US SUV share (2024) | ≈70% |
Preview the Actual Deliverable
Toyota Motor PESTLE Analysis
The Toyota Motor PESTLE analysis examines political, economic, social, technological, legal, and environmental factors shaping Toyota’s strategic position, including trade policy impacts, supply‑chain risks, EV and hybrid technology trends, regulatory compliance, and sustainability initiatives. The preview shown here is the exact document you’ll receive after purchase—fully formatted and ready to use. It’s the final, downloadable file with no placeholders.
Original: $10.00
-65%$10.00
$3.50Description
Make Smarter Strategic Decisions with a Complete PESTEL View
Discover how political shifts, economic cycles, and rapid technological change are reshaping Toyota Motor’s strategic landscape in our concise PESTLE overview; perfect for investors and strategists seeking clarity. Purchase the full analysis for actionable insights, data-driven risk assessments, and ready-to-use recommendations you can download instantly.
Political factors
Trade policies and tariffs impact global vehicle flows
Shifts in US (2.5% passenger cars, 25% light trucks), EU (about 10% external tariff) and China (around 15% passenger car import tariff) regimes can materially alter Toyota’s export economics and pricing power. Localization hedges duties but requires multi‑billion USD capex; Toyota operates over 70 plants in 28 countries enabling supply rerouting. Ongoing geopolitical tensions force regular scenario planning across markets.
Government incentives for EVs and hybrids steer product mix
Subsidies and tax credits such as the US Inflation Reduction Act credit up to $7,500 and national subsidies in Europe and Asia, plus ZEV mandates (California 2035, UK new‑ICE ban 2030), push Toyota to reallocate between BEVs, HEVs and PHEVs; markets with strong incentives accelerate BEV uptake despite higher unit costs. Policy uncertainty risks stranded BEV investments, while Toyota’s hybrid expertise and its roughly $70bn electrification commitment through 2030 provide portfolio flexibility across cycles.
Industrial policies and local content rules shape sourcing
The IRA offers up to $7,500 EV tax credit tied to strict local content and mineral rules; EU Battery Regulation mandates traceability, recycled-content and a battery passport phased in to 2027; ASEAN typically requires ~40% regional value content for tariff/preference eligibility. Compliance forces supplier relocation and joint ventures, makes battery‑precursor sourcing a geopolitical issue, and compels Toyota to trade cost, credit eligibility and supply resilience.
Political stability in manufacturing hubs affects continuity
Political volatility in key hubs — elections in the US (Nov 2024) and India (Apr–May 2024), Thailand (Nov 2023), plus recurring labor actions such as the 2023 US auto strikes — can interrupt Toyota production and supply chains; contingency inventory and multi-source tooling are used to limit downtime. Secure logistics corridors are critical and insurance/risk premiums can spike suddenly, increasing operating costs.
- Strikes: 2023 US auto strike example
- Elections: US 2024, India 2024, Thailand 2023
- Mitigation: contingency inventory, multi-source tooling
- Risks: logistics security, rising insurance premiums
Sanctions and export controls constrain technology access
US-led export controls expanded in 2023–24, restricting advanced semiconductors and EDA software that underpin ADAS and connected services, creating supply‑chain risk for Toyota’s sensor and ECU sourcing. Country-specific sanctions since 2022 (notably Russia) have limited market access and local partnerships. Compliance and export-control systems must be robust across all entities, and dual-use technologies require heightened licensing and oversight.
- impact: ADAS/connectivity supply risk due to 2023–24 controls
- market: sanctions since 2022 constrain presence/partners
- compliance: enterprise-wide export controls needed
- tech: dual-use items face stricter licensing
Tariffs, incentives and chip limits reshape automaker costs; 70bn EV hedge
Tightening tariffs (US 2.5% cars/25% light trucks; China ~15% car import) and incentives (US IRA up to 7,500) materially affect Toyota’s pricing and localization capex; Toyota runs >70 plants in 28 countries and pledged ~70bn USD to electrification through 2030 to hedge. Geopolitical/export controls (2023–24 semiconductor limits) and election/labor risks raise supply, compliance and insurance costs. Regulatory rules (EU battery regs, ZEV mandates) force supplier relocation and eligibility trade‑offs.
| Factor | Key Data | Impact |
|---|---|---|
| Tariffs | US 2.5%/25%, China ~15% | Export economics, localize plants |
| Incentives | IRA up to 7,500; BEV mandates (CA 2035) | Drives BEV uptake, eligibility costs |
| Supply controls | 2023–24 chip export limits | ADAS/ECU sourcing risk |
What is included in the product
Detailed Word Document
Explores how macro-environmental factors uniquely affect Toyota Motor across Political, Economic, Social, Technological, Environmental and Legal dimensions, with data-backed trends, forward-looking insights and detailed sub-points to support executives, investors and strategists in identifying risks, opportunities and actionable responses.
Customizable Excel Spreadsheet
A clean, visually segmented PESTLE summary for Toyota that’s easy to drop into presentations, editable for region- or business-line notes, and ideal for quick team alignment on external risks and market positioning.
Economic factors
Interest rates and credit cycles drive auto demand
Higher rates raise monthly payments and slow retail sales and leasing; with US policy rates at 5.25–5.50% and average new‑car loan rates near 8% in 2024, demand softened. Toyota Financial Services offsets some pressure via tailored APRs, balloon and lease programs to sustain volume. Credit normalization cut residual values roughly 10–15% from 2021 peaks, shifting mix toward lower‑risk trims. Divergent regional rates (US, Eurozone, Japan) complicate pricing and hedging globally.
Exchange rate volatility impacts margins and pricing
Yen moves directly affect Toyota’s export competitiveness and yen-denominated profit translation; Toyota sold about 10.5 million vehicles worldwide in 2023, magnifying FX effects on margins. Hedging programs smooth reported earnings but cannot fully offset sharp swings in USD/JPY or EUR/JPY. Ongoing localized sourcing and production reduce currency exposure over time, while pricing actions must balance brand positioning and demand elasticity.
Commodity and logistics costs pressure profitability
Steel, aluminum, battery materials and freight rate spikes have compressed Toyota’s margins by raising input and logistics costs across production and EV supply chains. Long-term purchasing contracts and material substitution strategies (e.g., reducing cobalt, shifting alloys) mitigate volatility. Even as global supply chains normalize, input-cost relief typically lags demand recovery. Ongoing kaizen and productivity gains help offset structural inflation.
Consumer shifts between segments affect mix
Preference swings to SUVs and crossovers—about 70% of US light‑vehicle sales in 2024 per Cox Automotive—boost Toyota’s revenue per unit as larger, higher‑margin models sell well; fleet and commercial cycles (stable demand for Hilux/Proace) smooth volatility; emerging markets favor affordable, durable models (strong Toyota sales in ASEAN/Latin America); Toyota’s broad lineup and ~10% global market share in 2024 enable agile allocation.
- SUV/CUV share US ~70% (2024)
- Toyota global share ~10% (2024)
- Commercial/fleet models add stability
- Emerging markets drive demand for affordable models
Macroeconomic growth in key regions sets volume trajectory
- US employment: unemployment ~3.6% (mid‑2025)
- China: GDP ~5% (2024), weaker consumer confidence
- India/ASEAN: India ~7% (2024), ASEAN ~4.5%–5%
- Strategy: competitive pricing, feature mix, flexible capacity
Tariffs, incentives and chip limits reshape automaker costs; 70bn EV hedge
Higher rates (US policy 5.25–5.50% mid‑2024; avg new‑car loan ≈8% in 2024) and residuals down ~10–15% from 2021 hit demand and margins; TFS uses tailored APRs/leases to sustain volume. Yen volatility affects translation—Toyota sold ~10.5M vehicles (2023); hedging and local production soften FX. SUV share US ~70% (2024); global share ~10% (2024).
| Metric | Value |
|---|---|
| US policy rate | 5.25–5.50% |
| Avg new‑car loan (2024) | ≈8% |
| Toyota sales (2023) | ≈10.5M |
| US SUV share (2024) | ≈70% |
Preview the Actual Deliverable
Toyota Motor PESTLE Analysis
The Toyota Motor PESTLE analysis examines political, economic, social, technological, legal, and environmental factors shaping Toyota’s strategic position, including trade policy impacts, supply‑chain risks, EV and hybrid technology trends, regulatory compliance, and sustainability initiatives. The preview shown here is the exact document you’ll receive after purchase—fully formatted and ready to use. It’s the final, downloadable file with no placeholders.











