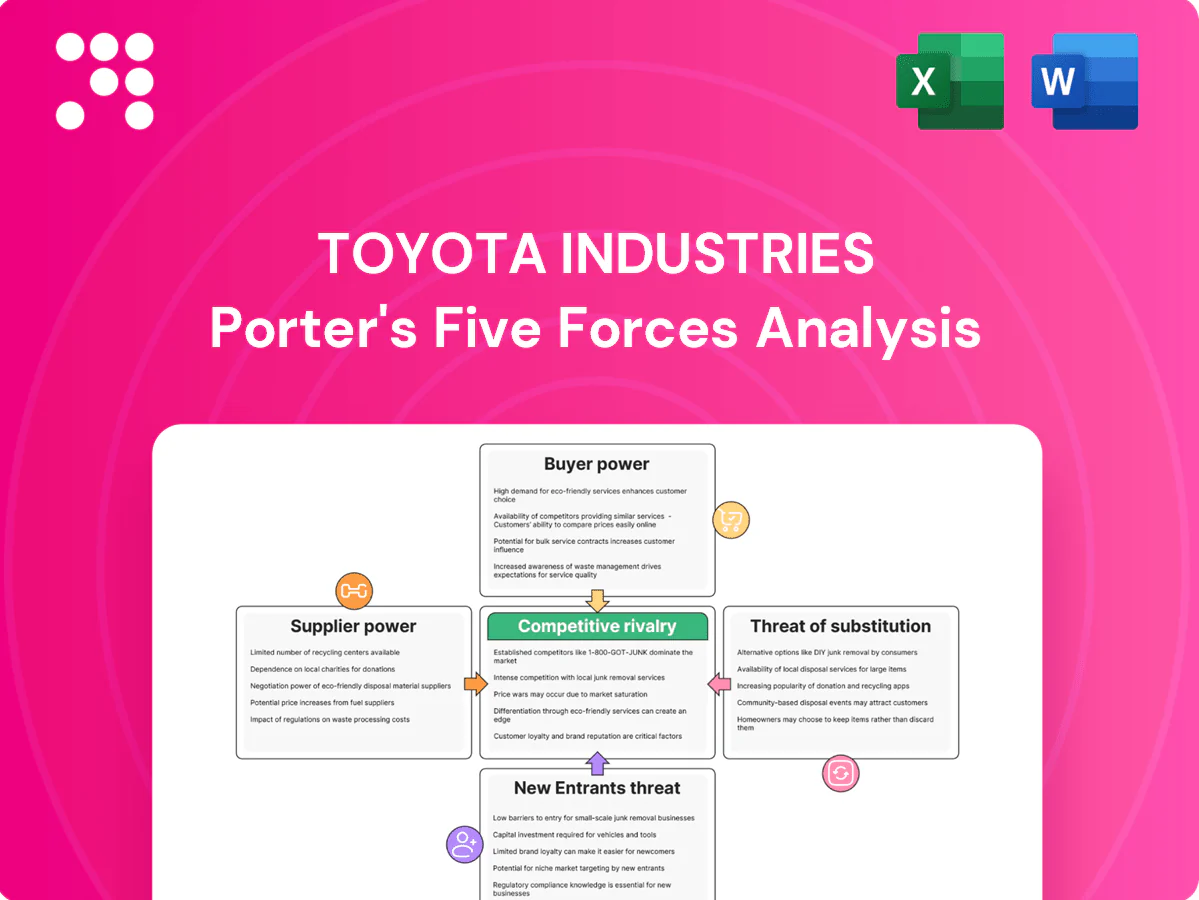
Toyota Industries Porter's Five Forces Analysis

Go Beyond the Preview—Access the Full Strategic Report
Toyota Industries faces moderate supplier power, intense rivalry, and evolving substitute threats as automation and electrification reshape demand. Buyer expectations and capex barriers temper new entrants but strategic moves will matter. This brief scratches the surface—unlock the full Porter's Five Forces Analysis for force-by-force ratings, visuals, and actionable strategy.
Suppliers Bargaining Power

Concentrated critical components
Core inputs—semiconductors, hydraulics, high‑grade steel and precision bearings—are concentrated among a few global suppliers (TSMC held ~54% of wafer foundry share in 2023; top 10 steelmakers produced ~39% of crude steel in 2023), so shortages raise supplier leverage over Toyota Industries. Long‑term contracts and dual‑sourcing blunt risk, but supplier qualification often takes 12–24 months and switching costs remain high. Co‑development with strategic suppliers partially rebalances power.
Automation and software dependencies
Warehouse automation depends on niche sensors, controllers and software from vendors in a global market valued at about US$34 billion in 2024, with equipment lifecycles and support contracts commonly spanning 5–10 years, creating supplier leverage on pricing and service terms. Toyota Industries mitigates this by developing in-house control systems and adopting open interfaces where feasible to reduce lock-in.

Energy and logistics volatility
Input-cost exposure to electricity, fuels and global freight raises indirect supplier power for Toyota Industries, with Brent crude averaging roughly $86/bbl in 2024 and container rates commonly between $1,500–2,000 per FEU that year, intensifying margin pressure during spikes. Surcharge passthrough is uneven across compressors, MHE and automotive components and by region. Hedging and regionalized manufacturing cut volatility but cannot fully neutralize it. Long multistage chains for compressors and MHE parts add delivery and cost risk.

Tiered automotive supply webs
Tiered automotive supply webs force PPAP, quality audits and full traceability, sharply narrowing qualified suppliers and creating strong post-approval stickiness and negotiation leverage for approved vendors. Toyota Group scale and kaizen-driven cost-downs compress supplier margins despite that stickiness; Toyota produced about 9 million vehicles in 2024, reinforcing volume-based purchasing power. Collaborative VAVE programs progressively rebalance bargaining toward Toyota and strategic suppliers.
- PPAP/audits: higher entry barriers
- Toyota ~9M vehicles (2024) => volume leverage
- VAVE/kaizen: margins squeezed, collaboration restores balance
Raw material specification rigidity
Engineering specs for safety-critical parts limit material substitutions, concentrating leverage with upstream mills and chemical suppliers, a dynamic that intensified in 2024 amid tight alloy markets. Framework agreements and should-cost models are used to curb excess pricing. Strategic inventory buffers around critical alloys reduce disruption risk and blunt supplier power.
- Spec rigidity = higher supplier leverage
- 2024 tight alloy markets amplified upstream strength
- Frameworks + should-cost = price discipline
- Inventory buffers = lower disruption risk
Supplier power moderate-high: concentrated wafers/steel; Brent $86, containers $1.5–2k/FEU
Supplier power is moderate‑high: key inputs are concentrated (TSMC ~54% wafer share 2023; top‑10 steelmakers ~39% crude steel 2023) and safety specs limit substitutes. Toyota scale (~9M vehicles 2024) plus VAVE/kaizen and dual‑sourcing reduce leverage. Automation market ~$34B 2024 and input shocks (Brent ~$86/bbl; container $1,500–2,000/FEU 2024) keep supplier risk material.
| Metric | 2024 value |
|---|---|
| Toyota production | ~9M vehicles |
| Automation market | $34B |
| Brent | $86/bbl |
| Container rate | $1,500–2,000/FEU |
What is included in the product
 Detailed Word Document
Uncovers key drivers of competition, customer influence, and market entry risks tailored to Toyota Industries, evaluating supplier and buyer power, threat of substitutes, and competitive rivalry. Highlights disruptive forces, emerging threats, and protective market dynamics to inform strategy, investor reports, and academic analysis.

 Customizable Excel Spreadsheet
One-sheet Porter's Five Forces for Toyota Industries—instantly visualize competitive pressure with a customizable spider chart and clean layout, ready to drop into decks or dashboards.
Customers Bargaining Power

Large fleet and OEM buyers
Major logistics firms and global OEMs buy forklifts, automation and compressors in high volumes, with the global forklift market estimated at $36.8 billion in 2024, enabling aggressive pricing, tight service SLAs and multi-year tenders; switching among top-tier vendors remains feasible, raising buyer leverage. Toyota Industries defends margins using TCO cases and uptime guarantees to win long-term deals.
Aftermarket and service sensitivity
Parts and maintenance form a large value pool in MHE, with the global material handling market estimated at USD 44.9 billion in 2024, making aftermarket revenue critical to margins. Buyers increasingly compare multi-year service contracts and secure bundled discounts often reaching 10–15%. Connected equipment telemetry enables tailored upsells and churn reduction, while Toyota Industries strong dealer network mitigates buyer bargaining through fast, localized responsiveness.

Price transparency and benchmarking
Global competition in forklifts and compressors has sharpened price benchmarks in 2024, enabling buyers to compare offers quickly. Buyers routinely use multi-quote processes and public reference deals to extract concessions. Digital RFQs and e-auctions have intensified pricing pressure by streamlining supplier comparisons. Differentiation through energy efficiency and automation integration remains the primary lever to command premiums.

Customization and integration demands
Automation projects for Toyota Industries require bespoke design, systems integration, and custom software; customers leverage scope changes and acceptance criteria to extract concessions, especially in a global industrial automation market of about $220 billion in 2024. Tight project governance and modular solutions protect margins, while reference sites and performance SLAs cut renegotiation risk.
- Customer leverage: scope change tactics
- Margin defense: modular design, strong governance
- Risk reduction: reference sites, SLAs
Automotive OEM dependency
Supplying engines and HVAC compressors to Toyota Motor and others concentrates revenue—Toyota Motor remained the single largest customer, accounting for around one-third of Toyota Industries consolidated sales in FY2024. OEMs exert leverage over scheduling, target costs and quality, enforcing annual cost-downs despite long-term supply volumes. Joint planning and shared R&D partially offset pressure by enabling stable, multi-year pricing and platform alignment.
- Customer concentration: ~1/3 of sales (FY2024)
- Power to set targets: scheduling, cost, quality
- Long contracts = volume security + year-on-year cost reductions
- Mitigation: joint planning and shared R&D
OEMs and logistics buyers wield RFQ/tender price power; maker defends margins with TCO and SLAs
Major logistics and OEM buyers (forklift market $36.8B; material handling $44.9B; automation $220B in 2024) exert strong price/service leverage via RFQs, e-auctions and multi-year tenders.
Toyota Industries defends margins with TCO cases, uptime SLAs, modular design, telemetry upsells and a dense dealer network.
Customer concentration (Toyota Motor ~33% of sales FY2024) grants scheduling/cost leverage, partly offset by joint R&D and long contracts.
| Metric | 2024 value |
|---|---|
| Global forklift market | $36.8B |
| Material handling market | $44.9B |
| Industrial automation market | $220B |
| Toyota Motor share of sales | ~33% (FY2024) |
Preview Before You Purchase
Toyota Industries Porter's Five Forces Analysis
This preview shows the exact Porter's Five Forces analysis of Toyota Industries you'll receive immediately after purchase—no surprises or placeholders. The document is fully formatted and ready for download and use the moment you buy, covering rivalry, supplier power, buyer power, threats of substitutes and new entrants with data-driven insights. You're viewing the final deliverable.

Go Beyond the Preview—Access the Full Strategic Report
Toyota Industries faces moderate supplier power, intense rivalry, and evolving substitute threats as automation and electrification reshape demand. Buyer expectations and capex barriers temper new entrants but strategic moves will matter. This brief scratches the surface—unlock the full Porter's Five Forces Analysis for force-by-force ratings, visuals, and actionable strategy.
Suppliers Bargaining Power
Concentrated critical components
Core inputs—semiconductors, hydraulics, high‑grade steel and precision bearings—are concentrated among a few global suppliers (TSMC held ~54% of wafer foundry share in 2023; top 10 steelmakers produced ~39% of crude steel in 2023), so shortages raise supplier leverage over Toyota Industries. Long‑term contracts and dual‑sourcing blunt risk, but supplier qualification often takes 12–24 months and switching costs remain high. Co‑development with strategic suppliers partially rebalances power.
Automation and software dependencies
Warehouse automation depends on niche sensors, controllers and software from vendors in a global market valued at about US$34 billion in 2024, with equipment lifecycles and support contracts commonly spanning 5–10 years, creating supplier leverage on pricing and service terms. Toyota Industries mitigates this by developing in-house control systems and adopting open interfaces where feasible to reduce lock-in.
Energy and logistics volatility
Input-cost exposure to electricity, fuels and global freight raises indirect supplier power for Toyota Industries, with Brent crude averaging roughly $86/bbl in 2024 and container rates commonly between $1,500–2,000 per FEU that year, intensifying margin pressure during spikes. Surcharge passthrough is uneven across compressors, MHE and automotive components and by region. Hedging and regionalized manufacturing cut volatility but cannot fully neutralize it. Long multistage chains for compressors and MHE parts add delivery and cost risk.
Tiered automotive supply webs
Tiered automotive supply webs force PPAP, quality audits and full traceability, sharply narrowing qualified suppliers and creating strong post-approval stickiness and negotiation leverage for approved vendors. Toyota Group scale and kaizen-driven cost-downs compress supplier margins despite that stickiness; Toyota produced about 9 million vehicles in 2024, reinforcing volume-based purchasing power. Collaborative VAVE programs progressively rebalance bargaining toward Toyota and strategic suppliers.
- PPAP/audits: higher entry barriers
- Toyota ~9M vehicles (2024) => volume leverage
- VAVE/kaizen: margins squeezed, collaboration restores balance
Raw material specification rigidity
Engineering specs for safety-critical parts limit material substitutions, concentrating leverage with upstream mills and chemical suppliers, a dynamic that intensified in 2024 amid tight alloy markets. Framework agreements and should-cost models are used to curb excess pricing. Strategic inventory buffers around critical alloys reduce disruption risk and blunt supplier power.
- Spec rigidity = higher supplier leverage
- 2024 tight alloy markets amplified upstream strength
- Frameworks + should-cost = price discipline
- Inventory buffers = lower disruption risk
Supplier power moderate-high: concentrated wafers/steel; Brent $86, containers $1.5–2k/FEU
Supplier power is moderate‑high: key inputs are concentrated (TSMC ~54% wafer share 2023; top‑10 steelmakers ~39% crude steel 2023) and safety specs limit substitutes. Toyota scale (~9M vehicles 2024) plus VAVE/kaizen and dual‑sourcing reduce leverage. Automation market ~$34B 2024 and input shocks (Brent ~$86/bbl; container $1,500–2,000/FEU 2024) keep supplier risk material.
| Metric | 2024 value |
|---|---|
| Toyota production | ~9M vehicles |
| Automation market | $34B |
| Brent | $86/bbl |
| Container rate | $1,500–2,000/FEU |
What is included in the product
Detailed Word Document
Uncovers key drivers of competition, customer influence, and market entry risks tailored to Toyota Industries, evaluating supplier and buyer power, threat of substitutes, and competitive rivalry. Highlights disruptive forces, emerging threats, and protective market dynamics to inform strategy, investor reports, and academic analysis.
Customizable Excel Spreadsheet
One-sheet Porter's Five Forces for Toyota Industries—instantly visualize competitive pressure with a customizable spider chart and clean layout, ready to drop into decks or dashboards.
Customers Bargaining Power
Large fleet and OEM buyers
Major logistics firms and global OEMs buy forklifts, automation and compressors in high volumes, with the global forklift market estimated at $36.8 billion in 2024, enabling aggressive pricing, tight service SLAs and multi-year tenders; switching among top-tier vendors remains feasible, raising buyer leverage. Toyota Industries defends margins using TCO cases and uptime guarantees to win long-term deals.
Aftermarket and service sensitivity
Parts and maintenance form a large value pool in MHE, with the global material handling market estimated at USD 44.9 billion in 2024, making aftermarket revenue critical to margins. Buyers increasingly compare multi-year service contracts and secure bundled discounts often reaching 10–15%. Connected equipment telemetry enables tailored upsells and churn reduction, while Toyota Industries strong dealer network mitigates buyer bargaining through fast, localized responsiveness.
Price transparency and benchmarking
Global competition in forklifts and compressors has sharpened price benchmarks in 2024, enabling buyers to compare offers quickly. Buyers routinely use multi-quote processes and public reference deals to extract concessions. Digital RFQs and e-auctions have intensified pricing pressure by streamlining supplier comparisons. Differentiation through energy efficiency and automation integration remains the primary lever to command premiums.
Customization and integration demands
Automation projects for Toyota Industries require bespoke design, systems integration, and custom software; customers leverage scope changes and acceptance criteria to extract concessions, especially in a global industrial automation market of about $220 billion in 2024. Tight project governance and modular solutions protect margins, while reference sites and performance SLAs cut renegotiation risk.
- Customer leverage: scope change tactics
- Margin defense: modular design, strong governance
- Risk reduction: reference sites, SLAs
Automotive OEM dependency
Supplying engines and HVAC compressors to Toyota Motor and others concentrates revenue—Toyota Motor remained the single largest customer, accounting for around one-third of Toyota Industries consolidated sales in FY2024. OEMs exert leverage over scheduling, target costs and quality, enforcing annual cost-downs despite long-term supply volumes. Joint planning and shared R&D partially offset pressure by enabling stable, multi-year pricing and platform alignment.
- Customer concentration: ~1/3 of sales (FY2024)
- Power to set targets: scheduling, cost, quality
- Long contracts = volume security + year-on-year cost reductions
- Mitigation: joint planning and shared R&D
OEMs and logistics buyers wield RFQ/tender price power; maker defends margins with TCO and SLAs
Major logistics and OEM buyers (forklift market $36.8B; material handling $44.9B; automation $220B in 2024) exert strong price/service leverage via RFQs, e-auctions and multi-year tenders.
Toyota Industries defends margins with TCO cases, uptime SLAs, modular design, telemetry upsells and a dense dealer network.
Customer concentration (Toyota Motor ~33% of sales FY2024) grants scheduling/cost leverage, partly offset by joint R&D and long contracts.
| Metric | 2024 value |
|---|---|
| Global forklift market | $36.8B |
| Material handling market | $44.9B |
| Industrial automation market | $220B |
| Toyota Motor share of sales | ~33% (FY2024) |
Preview Before You Purchase
Toyota Industries Porter's Five Forces Analysis
This preview shows the exact Porter's Five Forces analysis of Toyota Industries you'll receive immediately after purchase—no surprises or placeholders. The document is fully formatted and ready for download and use the moment you buy, covering rivalry, supplier power, buyer power, threats of substitutes and new entrants with data-driven insights. You're viewing the final deliverable.
Original: $10.00
-65%$10.00
$3.50Description
Go Beyond the Preview—Access the Full Strategic Report
Toyota Industries faces moderate supplier power, intense rivalry, and evolving substitute threats as automation and electrification reshape demand. Buyer expectations and capex barriers temper new entrants but strategic moves will matter. This brief scratches the surface—unlock the full Porter's Five Forces Analysis for force-by-force ratings, visuals, and actionable strategy.
Suppliers Bargaining Power
Concentrated critical components
Core inputs—semiconductors, hydraulics, high‑grade steel and precision bearings—are concentrated among a few global suppliers (TSMC held ~54% of wafer foundry share in 2023; top 10 steelmakers produced ~39% of crude steel in 2023), so shortages raise supplier leverage over Toyota Industries. Long‑term contracts and dual‑sourcing blunt risk, but supplier qualification often takes 12–24 months and switching costs remain high. Co‑development with strategic suppliers partially rebalances power.
Automation and software dependencies
Warehouse automation depends on niche sensors, controllers and software from vendors in a global market valued at about US$34 billion in 2024, with equipment lifecycles and support contracts commonly spanning 5–10 years, creating supplier leverage on pricing and service terms. Toyota Industries mitigates this by developing in-house control systems and adopting open interfaces where feasible to reduce lock-in.
Energy and logistics volatility
Input-cost exposure to electricity, fuels and global freight raises indirect supplier power for Toyota Industries, with Brent crude averaging roughly $86/bbl in 2024 and container rates commonly between $1,500–2,000 per FEU that year, intensifying margin pressure during spikes. Surcharge passthrough is uneven across compressors, MHE and automotive components and by region. Hedging and regionalized manufacturing cut volatility but cannot fully neutralize it. Long multistage chains for compressors and MHE parts add delivery and cost risk.
Tiered automotive supply webs
Tiered automotive supply webs force PPAP, quality audits and full traceability, sharply narrowing qualified suppliers and creating strong post-approval stickiness and negotiation leverage for approved vendors. Toyota Group scale and kaizen-driven cost-downs compress supplier margins despite that stickiness; Toyota produced about 9 million vehicles in 2024, reinforcing volume-based purchasing power. Collaborative VAVE programs progressively rebalance bargaining toward Toyota and strategic suppliers.
- PPAP/audits: higher entry barriers
- Toyota ~9M vehicles (2024) => volume leverage
- VAVE/kaizen: margins squeezed, collaboration restores balance
Raw material specification rigidity
Engineering specs for safety-critical parts limit material substitutions, concentrating leverage with upstream mills and chemical suppliers, a dynamic that intensified in 2024 amid tight alloy markets. Framework agreements and should-cost models are used to curb excess pricing. Strategic inventory buffers around critical alloys reduce disruption risk and blunt supplier power.
- Spec rigidity = higher supplier leverage
- 2024 tight alloy markets amplified upstream strength
- Frameworks + should-cost = price discipline
- Inventory buffers = lower disruption risk
Supplier power moderate-high: concentrated wafers/steel; Brent $86, containers $1.5–2k/FEU
Supplier power is moderate‑high: key inputs are concentrated (TSMC ~54% wafer share 2023; top‑10 steelmakers ~39% crude steel 2023) and safety specs limit substitutes. Toyota scale (~9M vehicles 2024) plus VAVE/kaizen and dual‑sourcing reduce leverage. Automation market ~$34B 2024 and input shocks (Brent ~$86/bbl; container $1,500–2,000/FEU 2024) keep supplier risk material.
| Metric | 2024 value |
|---|---|
| Toyota production | ~9M vehicles |
| Automation market | $34B |
| Brent | $86/bbl |
| Container rate | $1,500–2,000/FEU |
What is included in the product
Detailed Word Document
Uncovers key drivers of competition, customer influence, and market entry risks tailored to Toyota Industries, evaluating supplier and buyer power, threat of substitutes, and competitive rivalry. Highlights disruptive forces, emerging threats, and protective market dynamics to inform strategy, investor reports, and academic analysis.
Customizable Excel Spreadsheet
One-sheet Porter's Five Forces for Toyota Industries—instantly visualize competitive pressure with a customizable spider chart and clean layout, ready to drop into decks or dashboards.
Customers Bargaining Power
Large fleet and OEM buyers
Major logistics firms and global OEMs buy forklifts, automation and compressors in high volumes, with the global forklift market estimated at $36.8 billion in 2024, enabling aggressive pricing, tight service SLAs and multi-year tenders; switching among top-tier vendors remains feasible, raising buyer leverage. Toyota Industries defends margins using TCO cases and uptime guarantees to win long-term deals.
Aftermarket and service sensitivity
Parts and maintenance form a large value pool in MHE, with the global material handling market estimated at USD 44.9 billion in 2024, making aftermarket revenue critical to margins. Buyers increasingly compare multi-year service contracts and secure bundled discounts often reaching 10–15%. Connected equipment telemetry enables tailored upsells and churn reduction, while Toyota Industries strong dealer network mitigates buyer bargaining through fast, localized responsiveness.
Price transparency and benchmarking
Global competition in forklifts and compressors has sharpened price benchmarks in 2024, enabling buyers to compare offers quickly. Buyers routinely use multi-quote processes and public reference deals to extract concessions. Digital RFQs and e-auctions have intensified pricing pressure by streamlining supplier comparisons. Differentiation through energy efficiency and automation integration remains the primary lever to command premiums.
Customization and integration demands
Automation projects for Toyota Industries require bespoke design, systems integration, and custom software; customers leverage scope changes and acceptance criteria to extract concessions, especially in a global industrial automation market of about $220 billion in 2024. Tight project governance and modular solutions protect margins, while reference sites and performance SLAs cut renegotiation risk.
- Customer leverage: scope change tactics
- Margin defense: modular design, strong governance
- Risk reduction: reference sites, SLAs
Automotive OEM dependency
Supplying engines and HVAC compressors to Toyota Motor and others concentrates revenue—Toyota Motor remained the single largest customer, accounting for around one-third of Toyota Industries consolidated sales in FY2024. OEMs exert leverage over scheduling, target costs and quality, enforcing annual cost-downs despite long-term supply volumes. Joint planning and shared R&D partially offset pressure by enabling stable, multi-year pricing and platform alignment.
- Customer concentration: ~1/3 of sales (FY2024)
- Power to set targets: scheduling, cost, quality
- Long contracts = volume security + year-on-year cost reductions
- Mitigation: joint planning and shared R&D
OEMs and logistics buyers wield RFQ/tender price power; maker defends margins with TCO and SLAs
Major logistics and OEM buyers (forklift market $36.8B; material handling $44.9B; automation $220B in 2024) exert strong price/service leverage via RFQs, e-auctions and multi-year tenders.
Toyota Industries defends margins with TCO cases, uptime SLAs, modular design, telemetry upsells and a dense dealer network.
Customer concentration (Toyota Motor ~33% of sales FY2024) grants scheduling/cost leverage, partly offset by joint R&D and long contracts.
| Metric | 2024 value |
|---|---|
| Global forklift market | $36.8B |
| Material handling market | $44.9B |
| Industrial automation market | $220B |
| Toyota Motor share of sales | ~33% (FY2024) |
Preview Before You Purchase
Toyota Industries Porter's Five Forces Analysis
This preview shows the exact Porter's Five Forces analysis of Toyota Industries you'll receive immediately after purchase—no surprises or placeholders. The document is fully formatted and ready for download and use the moment you buy, covering rivalry, supplier power, buyer power, threats of substitutes and new entrants with data-driven insights. You're viewing the final deliverable.











