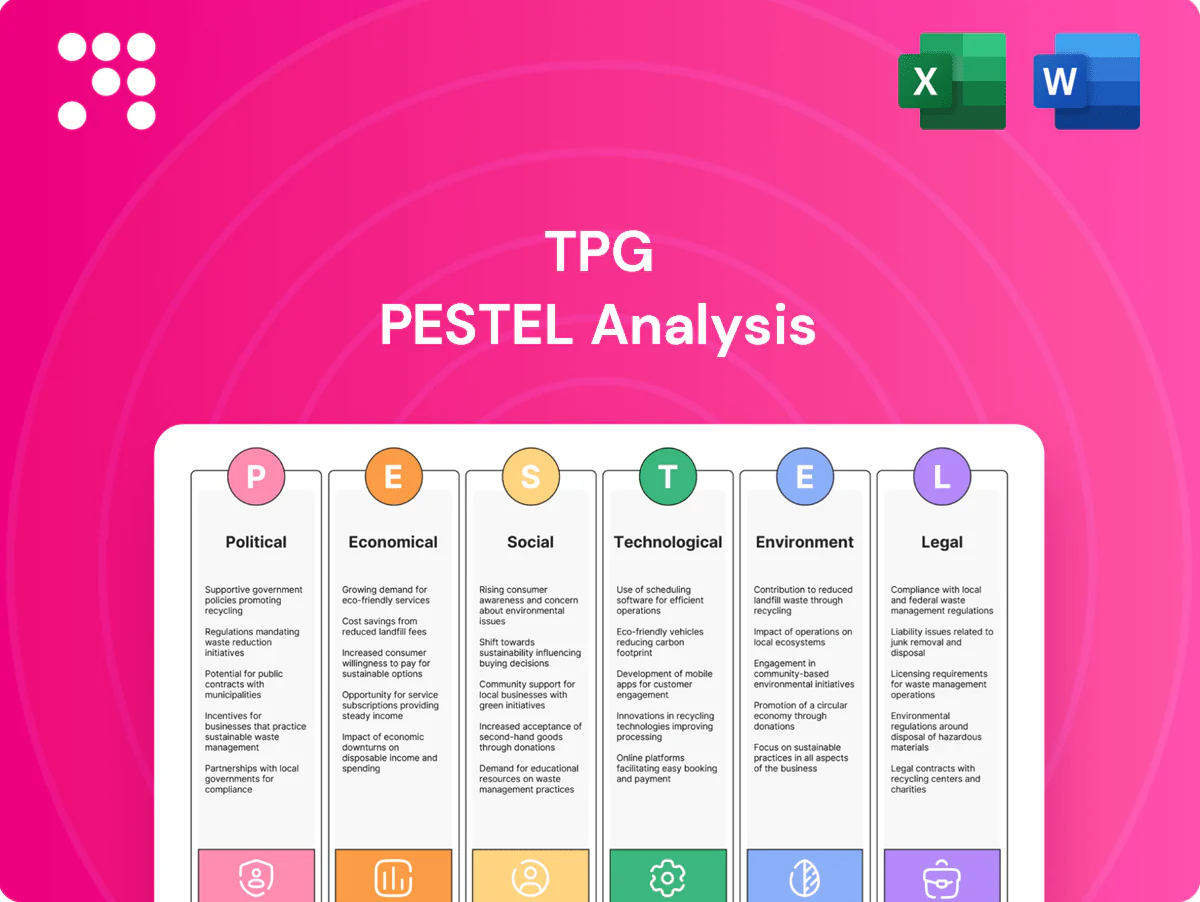
TPG PESTLE Analysis

Make Smarter Strategic Decisions with a Complete PESTEL View
Unlock how political, economic, social, technological, legal, and environmental forces are shaping TPG’s strategy with our concise PESTLE Analysis—packed with actionable insights for investors and strategists. Ready-made and fully sourced, it saves you time and sharpens decisions; purchase the full report for the complete, editable breakdown.
Political factors

Federal telecom policy direction
Federal priorities on digital infrastructure, regional connectivity and competition—shaping funding and rules for fibre backhaul and 5G—are central for TPG as Australia (population ~26 million) targets national coverage; policy shifts can accelerate rollouts or redirect subsidies toward the NBN. TPG must align bids and build plans with changing Commonwealth agendas and actively engage departments and inquiries to mitigate policy risk.
Regulator stance and market structure
ACCC oversight of mergers, wholesale access and pricing continues to shape TPG’s margins and strategy, with active reviews in 2024–25 potentially altering access terms and regulated pricing. Decisions on MVNO arrangements, spectrum trading and infrastructure sharing among the three national carriers directly influence competitive intensity and capex returns. Prior court outcomes set legal precedents but leave regulatory uncertainty; proactive compliance and evidence-based submissions are essential.

Spectrum allocation and auctions
Government-managed auctions set upfront costs and coverage obligations for bands such as 700 MHz, 3.5 GHz and 26 GHz; licenses commonly mandate rural rollout, quality benchmarks and interference management. License conditions drive rural coverage timelines and QoS metrics; mid-band (3.5 GHz) blocks of ~100 MHz deliver macro capacity while low-band 700 MHz ensures propagation. Outcomes shape 5G capacity, mid/low balance and 6G sub-THz readiness (>100 GHz), so capital planning must budget for auction timelines and reserve prices set by regulators.

Geopolitical supply chain pressures
Geopolitical supply-chain pressures force TPG to avoid restricted vendors and manage country-of-origin risk, altering equipment choices after major export-control actions (eg US Entity List measures since 2019) and expanded sanctions in 2022–24. Diversifying RAN, core and optical suppliers reduces exposure to sanction or export-control shocks. Logistics disruptions continue to extend lead times for radios, semiconductors and CPE, while government security guidance tightens procurement standards.
- Vendor restrictions: Entity List & sanctions
- Diversification: RAN/core/optical suppliers
- Logistics: longer lead times for radios/semis/CPE
- Procurement: stricter gov security guidance
State and local permitting
Planning approvals for towers, small cells and fiber runs vary significantly by state and local council, creating heterogeneous timelines across Australia. Delays in wayleaves and environmental clearances can meaningfully slow rollouts, while mandatory community consultation adds both time and cost. Streamlined engagement with councils and landholders accelerates densification and fixed network expansion.
- Variable approval timelines by council
- Wayleave/environmental delays increase capex and schedule risk
- Community consultation adds cost and weeks/months
Federal priorities, spectrum auctions and ACCC reviews reshape Australia's fibre and 5G rollout
Federal digital-infrastructure priorities and NBN policy shifts shape funding and rollout timing for fibre backhaul and 5G across Australia (population ~26.1 million in 2024). ACCC reviews in 2024–25 continue to influence wholesale terms, pricing and merger approvals. Spectrum auctions (700 MHz, 3.5 GHz, 26 GHz) set coverage obligations and capex timing; supply-chain/vendor restrictions raise procurement and lead-time risk.
| Topic | 2024–25 datapoint | Impact |
|---|---|---|
| Population | ~26.1M (2024) | National coverage scale |
| Regulation | ACCC reviews 2024–25 | Wholesale/pricing risk |
| Spectrum | 700 MHz, 3.5 GHz, 26 GHz | Rollout obligations |
What is included in the product
 Detailed Word Document
Explores how macro-environmental factors affect TPG across Political, Economic, Social, Technological, Environmental and Legal dimensions, with data-backed trends and region-specific regulatory context; designed for executives, consultants and investors, it offers detailed sub-points, forward-looking scenario insights, and ready-to-insert formatting to identify threats, opportunities and strategic actions.

 Customizable Excel Spreadsheet
Concise, visually segmented TPG PESTLE summaries relieve research and alignment bottlenecks by highlighting key political, economic, social, technological, legal and environmental risks for quick decision-making and easy insertion into presentations or team briefs.
Economic factors

Inflation and interest rate impacts
Higher borrowing costs—RBA cash rate ~4.35% (mid‑2025)—raise debt servicing for capex‑heavy networks, squeezing free cash flow. Inflation (Australian CPI ~3.4% in 2024) lifts opex (energy, labor, leases) and CPE costs. CPI‑linked pricing can protect ARPU but may drive churn; balance sheet flexibility is essential to sustain multi‑year investment cycles.
ARPU pressure and competition
Price competition from incumbents and MVNOs (≈15% market share) is compressing mobile and broadband ARPU for TPG, with Australian mobile ARPU down ~2–4% YoY in telco sector trends through 2024. Bundling, speed-tier upsell and value-added services have lifted yield—NBN wholesale dynamics (average access charges near A$40–45/month in 2024) squeeze retail margins. A shift to customer lifetime value reduces promo-driven ARPU dilution.

Capex intensity and returns
5G, fiber backhaul and core upgrades drive sustained capex—GSMA estimates roughly 1.1 trillion USD of mobile network capex 2020–2025—pressuring returns. Network-sharing and tower deals can cut capex by up to 40%, materially improving ROIC and free cash flow. Phasing builds by demand density typically shortens payback to 3–5 years in urban corridors. Robust project governance limits industry overruns, which average around 20%, protecting margins.

Population growth and migration
Population gains in metro corridors expand TPGs addressable market as Australia reached about 26.6 million in 2024 (ABS) with net overseas migration ~484,000 in 2023–24, concentrating growth in Sydney, Melbourne and Brisbane; new estates and densification shift capacity hotspots; international students and migrants (≈650,000 in 2024) drive prepaid and data-heavy usage, so localized build plans capture growth pockets.
- Metro growth: 26.6M (2024)
- MOM: ~484k (2023–24)
- Intl students: ≈650k (2024)
- Implication: target densification hotspots
Currency and equipment costs
AUD volatility—around an average of US$0.67 in 2024—raises costs for imported network gear and handsets for TPG; hedging programs reduce near-term FX swings but cannot offset long-term currency trends, so procurement strategy and contract terms matter. Multi-vendor sourcing and strategic inventory timing smooth price spikes and recover margin pressure.
- AUD average ~US$0.67 (2024)
- Hedging mitigates short-term swings
- Multi-vendor sourcing = price leverage
- Inventory timing smooths cost spikes
Federal priorities, spectrum auctions and ACCC reviews reshape Australia's fibre and 5G rollout
Higher rates (RBA ~4.35% mid‑2025) and 2024 CPI ~3.4% raise opex and capex servicing; mobile ARPU down ~2–4% YoY amid MVNO competition (~15% share). NBN access A$40–45/mo and AUD ~US$0.67 (2024) pressure margins; network-sharing and staged builds shorten payback to ~3–5 years.
| Metric | Value |
|---|---|
| RBA cash rate | ~4.35% (mid‑2025) |
| CPI | ~3.4% (2024) |
| AUD | ~US$0.67 (2024) |
| MVNO share | ~15% |
| NBN access | A$40–45/mo (2024) |
Same Document Delivered
TPG PESTLE Analysis
The preview shown here is the exact TPG PESTLE Analysis document you’ll receive after purchase—fully formatted and ready to use. The layout, content, and structure visible are identical to the downloadable file delivered immediately after payment. No placeholders or teasers—this is the final, professionally structured file you’ll own.

Make Smarter Strategic Decisions with a Complete PESTEL View
Unlock how political, economic, social, technological, legal, and environmental forces are shaping TPG’s strategy with our concise PESTLE Analysis—packed with actionable insights for investors and strategists. Ready-made and fully sourced, it saves you time and sharpens decisions; purchase the full report for the complete, editable breakdown.
Political factors
Federal telecom policy direction
Federal priorities on digital infrastructure, regional connectivity and competition—shaping funding and rules for fibre backhaul and 5G—are central for TPG as Australia (population ~26 million) targets national coverage; policy shifts can accelerate rollouts or redirect subsidies toward the NBN. TPG must align bids and build plans with changing Commonwealth agendas and actively engage departments and inquiries to mitigate policy risk.
Regulator stance and market structure
ACCC oversight of mergers, wholesale access and pricing continues to shape TPG’s margins and strategy, with active reviews in 2024–25 potentially altering access terms and regulated pricing. Decisions on MVNO arrangements, spectrum trading and infrastructure sharing among the three national carriers directly influence competitive intensity and capex returns. Prior court outcomes set legal precedents but leave regulatory uncertainty; proactive compliance and evidence-based submissions are essential.
Spectrum allocation and auctions
Government-managed auctions set upfront costs and coverage obligations for bands such as 700 MHz, 3.5 GHz and 26 GHz; licenses commonly mandate rural rollout, quality benchmarks and interference management. License conditions drive rural coverage timelines and QoS metrics; mid-band (3.5 GHz) blocks of ~100 MHz deliver macro capacity while low-band 700 MHz ensures propagation. Outcomes shape 5G capacity, mid/low balance and 6G sub-THz readiness (>100 GHz), so capital planning must budget for auction timelines and reserve prices set by regulators.
Geopolitical supply chain pressures
Geopolitical supply-chain pressures force TPG to avoid restricted vendors and manage country-of-origin risk, altering equipment choices after major export-control actions (eg US Entity List measures since 2019) and expanded sanctions in 2022–24. Diversifying RAN, core and optical suppliers reduces exposure to sanction or export-control shocks. Logistics disruptions continue to extend lead times for radios, semiconductors and CPE, while government security guidance tightens procurement standards.
- Vendor restrictions: Entity List & sanctions
- Diversification: RAN/core/optical suppliers
- Logistics: longer lead times for radios/semis/CPE
- Procurement: stricter gov security guidance
State and local permitting
Planning approvals for towers, small cells and fiber runs vary significantly by state and local council, creating heterogeneous timelines across Australia. Delays in wayleaves and environmental clearances can meaningfully slow rollouts, while mandatory community consultation adds both time and cost. Streamlined engagement with councils and landholders accelerates densification and fixed network expansion.
- Variable approval timelines by council
- Wayleave/environmental delays increase capex and schedule risk
- Community consultation adds cost and weeks/months
Federal priorities, spectrum auctions and ACCC reviews reshape Australia's fibre and 5G rollout
Federal digital-infrastructure priorities and NBN policy shifts shape funding and rollout timing for fibre backhaul and 5G across Australia (population ~26.1 million in 2024). ACCC reviews in 2024–25 continue to influence wholesale terms, pricing and merger approvals. Spectrum auctions (700 MHz, 3.5 GHz, 26 GHz) set coverage obligations and capex timing; supply-chain/vendor restrictions raise procurement and lead-time risk.
| Topic | 2024–25 datapoint | Impact |
|---|---|---|
| Population | ~26.1M (2024) | National coverage scale |
| Regulation | ACCC reviews 2024–25 | Wholesale/pricing risk |
| Spectrum | 700 MHz, 3.5 GHz, 26 GHz | Rollout obligations |
What is included in the product
Detailed Word Document
Explores how macro-environmental factors affect TPG across Political, Economic, Social, Technological, Environmental and Legal dimensions, with data-backed trends and region-specific regulatory context; designed for executives, consultants and investors, it offers detailed sub-points, forward-looking scenario insights, and ready-to-insert formatting to identify threats, opportunities and strategic actions.
Customizable Excel Spreadsheet
Concise, visually segmented TPG PESTLE summaries relieve research and alignment bottlenecks by highlighting key political, economic, social, technological, legal and environmental risks for quick decision-making and easy insertion into presentations or team briefs.
Economic factors
Inflation and interest rate impacts
Higher borrowing costs—RBA cash rate ~4.35% (mid‑2025)—raise debt servicing for capex‑heavy networks, squeezing free cash flow. Inflation (Australian CPI ~3.4% in 2024) lifts opex (energy, labor, leases) and CPE costs. CPI‑linked pricing can protect ARPU but may drive churn; balance sheet flexibility is essential to sustain multi‑year investment cycles.
ARPU pressure and competition
Price competition from incumbents and MVNOs (≈15% market share) is compressing mobile and broadband ARPU for TPG, with Australian mobile ARPU down ~2–4% YoY in telco sector trends through 2024. Bundling, speed-tier upsell and value-added services have lifted yield—NBN wholesale dynamics (average access charges near A$40–45/month in 2024) squeeze retail margins. A shift to customer lifetime value reduces promo-driven ARPU dilution.
Capex intensity and returns
5G, fiber backhaul and core upgrades drive sustained capex—GSMA estimates roughly 1.1 trillion USD of mobile network capex 2020–2025—pressuring returns. Network-sharing and tower deals can cut capex by up to 40%, materially improving ROIC and free cash flow. Phasing builds by demand density typically shortens payback to 3–5 years in urban corridors. Robust project governance limits industry overruns, which average around 20%, protecting margins.
Population growth and migration
Population gains in metro corridors expand TPGs addressable market as Australia reached about 26.6 million in 2024 (ABS) with net overseas migration ~484,000 in 2023–24, concentrating growth in Sydney, Melbourne and Brisbane; new estates and densification shift capacity hotspots; international students and migrants (≈650,000 in 2024) drive prepaid and data-heavy usage, so localized build plans capture growth pockets.
- Metro growth: 26.6M (2024)
- MOM: ~484k (2023–24)
- Intl students: ≈650k (2024)
- Implication: target densification hotspots
Currency and equipment costs
AUD volatility—around an average of US$0.67 in 2024—raises costs for imported network gear and handsets for TPG; hedging programs reduce near-term FX swings but cannot offset long-term currency trends, so procurement strategy and contract terms matter. Multi-vendor sourcing and strategic inventory timing smooth price spikes and recover margin pressure.
- AUD average ~US$0.67 (2024)
- Hedging mitigates short-term swings
- Multi-vendor sourcing = price leverage
- Inventory timing smooths cost spikes
Federal priorities, spectrum auctions and ACCC reviews reshape Australia's fibre and 5G rollout
Higher rates (RBA ~4.35% mid‑2025) and 2024 CPI ~3.4% raise opex and capex servicing; mobile ARPU down ~2–4% YoY amid MVNO competition (~15% share). NBN access A$40–45/mo and AUD ~US$0.67 (2024) pressure margins; network-sharing and staged builds shorten payback to ~3–5 years.
| Metric | Value |
|---|---|
| RBA cash rate | ~4.35% (mid‑2025) |
| CPI | ~3.4% (2024) |
| AUD | ~US$0.67 (2024) |
| MVNO share | ~15% |
| NBN access | A$40–45/mo (2024) |
Same Document Delivered
TPG PESTLE Analysis
The preview shown here is the exact TPG PESTLE Analysis document you’ll receive after purchase—fully formatted and ready to use. The layout, content, and structure visible are identical to the downloadable file delivered immediately after payment. No placeholders or teasers—this is the final, professionally structured file you’ll own.
Description
Make Smarter Strategic Decisions with a Complete PESTEL View
Unlock how political, economic, social, technological, legal, and environmental forces are shaping TPG’s strategy with our concise PESTLE Analysis—packed with actionable insights for investors and strategists. Ready-made and fully sourced, it saves you time and sharpens decisions; purchase the full report for the complete, editable breakdown.
Political factors
Federal telecom policy direction
Federal priorities on digital infrastructure, regional connectivity and competition—shaping funding and rules for fibre backhaul and 5G—are central for TPG as Australia (population ~26 million) targets national coverage; policy shifts can accelerate rollouts or redirect subsidies toward the NBN. TPG must align bids and build plans with changing Commonwealth agendas and actively engage departments and inquiries to mitigate policy risk.
Regulator stance and market structure
ACCC oversight of mergers, wholesale access and pricing continues to shape TPG’s margins and strategy, with active reviews in 2024–25 potentially altering access terms and regulated pricing. Decisions on MVNO arrangements, spectrum trading and infrastructure sharing among the three national carriers directly influence competitive intensity and capex returns. Prior court outcomes set legal precedents but leave regulatory uncertainty; proactive compliance and evidence-based submissions are essential.
Spectrum allocation and auctions
Government-managed auctions set upfront costs and coverage obligations for bands such as 700 MHz, 3.5 GHz and 26 GHz; licenses commonly mandate rural rollout, quality benchmarks and interference management. License conditions drive rural coverage timelines and QoS metrics; mid-band (3.5 GHz) blocks of ~100 MHz deliver macro capacity while low-band 700 MHz ensures propagation. Outcomes shape 5G capacity, mid/low balance and 6G sub-THz readiness (>100 GHz), so capital planning must budget for auction timelines and reserve prices set by regulators.
Geopolitical supply chain pressures
Geopolitical supply-chain pressures force TPG to avoid restricted vendors and manage country-of-origin risk, altering equipment choices after major export-control actions (eg US Entity List measures since 2019) and expanded sanctions in 2022–24. Diversifying RAN, core and optical suppliers reduces exposure to sanction or export-control shocks. Logistics disruptions continue to extend lead times for radios, semiconductors and CPE, while government security guidance tightens procurement standards.
- Vendor restrictions: Entity List & sanctions
- Diversification: RAN/core/optical suppliers
- Logistics: longer lead times for radios/semis/CPE
- Procurement: stricter gov security guidance
State and local permitting
Planning approvals for towers, small cells and fiber runs vary significantly by state and local council, creating heterogeneous timelines across Australia. Delays in wayleaves and environmental clearances can meaningfully slow rollouts, while mandatory community consultation adds both time and cost. Streamlined engagement with councils and landholders accelerates densification and fixed network expansion.
- Variable approval timelines by council
- Wayleave/environmental delays increase capex and schedule risk
- Community consultation adds cost and weeks/months
Federal priorities, spectrum auctions and ACCC reviews reshape Australia's fibre and 5G rollout
Federal digital-infrastructure priorities and NBN policy shifts shape funding and rollout timing for fibre backhaul and 5G across Australia (population ~26.1 million in 2024). ACCC reviews in 2024–25 continue to influence wholesale terms, pricing and merger approvals. Spectrum auctions (700 MHz, 3.5 GHz, 26 GHz) set coverage obligations and capex timing; supply-chain/vendor restrictions raise procurement and lead-time risk.
| Topic | 2024–25 datapoint | Impact |
|---|---|---|
| Population | ~26.1M (2024) | National coverage scale |
| Regulation | ACCC reviews 2024–25 | Wholesale/pricing risk |
| Spectrum | 700 MHz, 3.5 GHz, 26 GHz | Rollout obligations |
What is included in the product
Detailed Word Document
Explores how macro-environmental factors affect TPG across Political, Economic, Social, Technological, Environmental and Legal dimensions, with data-backed trends and region-specific regulatory context; designed for executives, consultants and investors, it offers detailed sub-points, forward-looking scenario insights, and ready-to-insert formatting to identify threats, opportunities and strategic actions.
Customizable Excel Spreadsheet
Concise, visually segmented TPG PESTLE summaries relieve research and alignment bottlenecks by highlighting key political, economic, social, technological, legal and environmental risks for quick decision-making and easy insertion into presentations or team briefs.
Economic factors
Inflation and interest rate impacts
Higher borrowing costs—RBA cash rate ~4.35% (mid‑2025)—raise debt servicing for capex‑heavy networks, squeezing free cash flow. Inflation (Australian CPI ~3.4% in 2024) lifts opex (energy, labor, leases) and CPE costs. CPI‑linked pricing can protect ARPU but may drive churn; balance sheet flexibility is essential to sustain multi‑year investment cycles.
ARPU pressure and competition
Price competition from incumbents and MVNOs (≈15% market share) is compressing mobile and broadband ARPU for TPG, with Australian mobile ARPU down ~2–4% YoY in telco sector trends through 2024. Bundling, speed-tier upsell and value-added services have lifted yield—NBN wholesale dynamics (average access charges near A$40–45/month in 2024) squeeze retail margins. A shift to customer lifetime value reduces promo-driven ARPU dilution.
Capex intensity and returns
5G, fiber backhaul and core upgrades drive sustained capex—GSMA estimates roughly 1.1 trillion USD of mobile network capex 2020–2025—pressuring returns. Network-sharing and tower deals can cut capex by up to 40%, materially improving ROIC and free cash flow. Phasing builds by demand density typically shortens payback to 3–5 years in urban corridors. Robust project governance limits industry overruns, which average around 20%, protecting margins.
Population growth and migration
Population gains in metro corridors expand TPGs addressable market as Australia reached about 26.6 million in 2024 (ABS) with net overseas migration ~484,000 in 2023–24, concentrating growth in Sydney, Melbourne and Brisbane; new estates and densification shift capacity hotspots; international students and migrants (≈650,000 in 2024) drive prepaid and data-heavy usage, so localized build plans capture growth pockets.
- Metro growth: 26.6M (2024)
- MOM: ~484k (2023–24)
- Intl students: ≈650k (2024)
- Implication: target densification hotspots
Currency and equipment costs
AUD volatility—around an average of US$0.67 in 2024—raises costs for imported network gear and handsets for TPG; hedging programs reduce near-term FX swings but cannot offset long-term currency trends, so procurement strategy and contract terms matter. Multi-vendor sourcing and strategic inventory timing smooth price spikes and recover margin pressure.
- AUD average ~US$0.67 (2024)
- Hedging mitigates short-term swings
- Multi-vendor sourcing = price leverage
- Inventory timing smooths cost spikes
Federal priorities, spectrum auctions and ACCC reviews reshape Australia's fibre and 5G rollout
Higher rates (RBA ~4.35% mid‑2025) and 2024 CPI ~3.4% raise opex and capex servicing; mobile ARPU down ~2–4% YoY amid MVNO competition (~15% share). NBN access A$40–45/mo and AUD ~US$0.67 (2024) pressure margins; network-sharing and staged builds shorten payback to ~3–5 years.
| Metric | Value |
|---|---|
| RBA cash rate | ~4.35% (mid‑2025) |
| CPI | ~3.4% (2024) |
| AUD | ~US$0.67 (2024) |
| MVNO share | ~15% |
| NBN access | A$40–45/mo (2024) |
Same Document Delivered
TPG PESTLE Analysis
The preview shown here is the exact TPG PESTLE Analysis document you’ll receive after purchase—fully formatted and ready to use. The layout, content, and structure visible are identical to the downloadable file delivered immediately after payment. No placeholders or teasers—this is the final, professionally structured file you’ll own.











