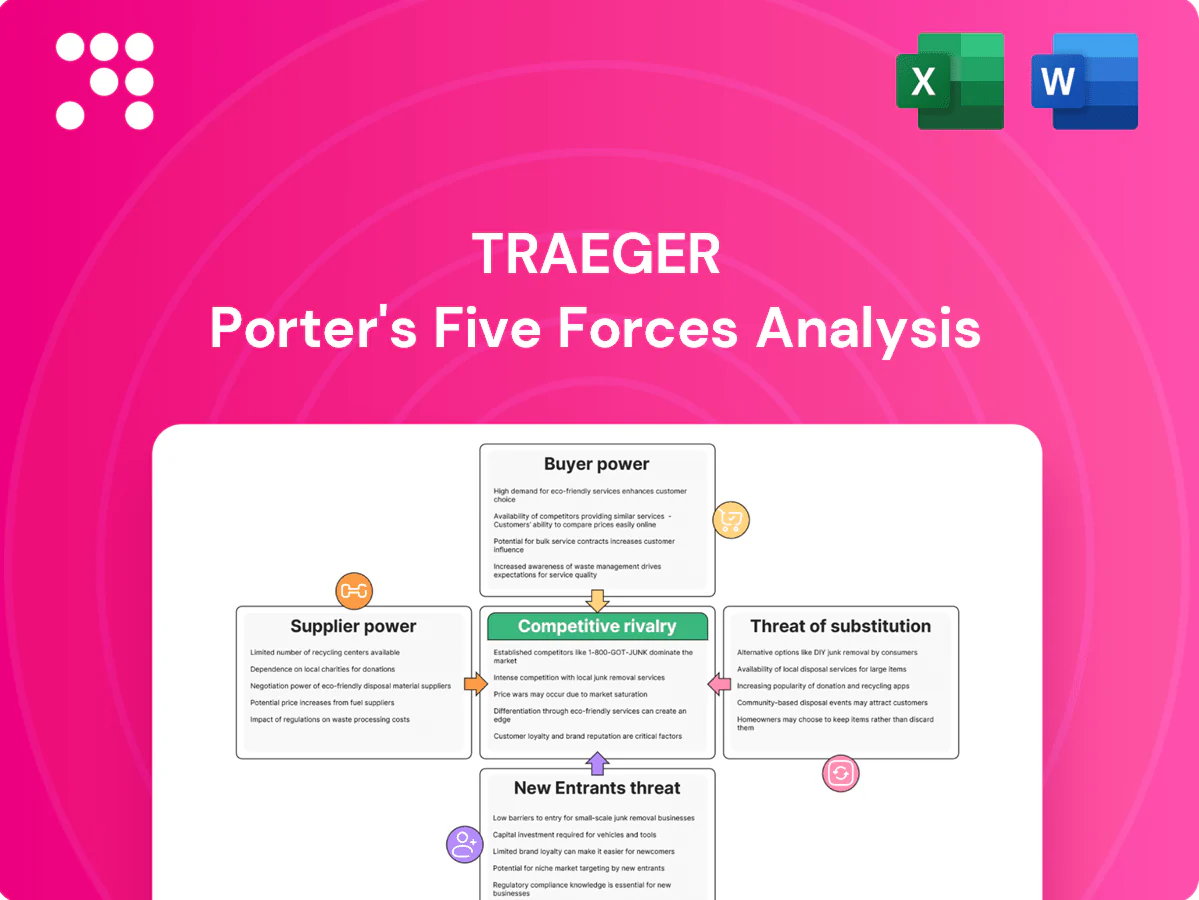
Traeger Porter's Five Forces Analysis

Don't Miss the Bigger Picture
Traeger's Porter's Five Forces snapshot highlights competitive intensity across suppliers, buyers, substitutes and new entrants and pinpoints where Traeger holds leverage or faces pressure. The brief flags strategic risks and growth levers but stops short of granular ratings and data. Unlock the full Porter's Five Forces Analysis to see force-by-force scores, visuals, and actionable recommendations tailored to Traeger.
Suppliers Bargaining Power

Concentrated pellet and flavor-wood sourcing
Food-grade hardwood pellet and flavor-wood sourcing is highly concentrated, with far fewer certified mills producing consistent pellet sizing and premium blends than generic fuel vendors, raising effective switching costs and QC risks. Regional forestry disruptions in 2023–2024, including droughts and storm losses in key Southeastern and Pacific Northwest stands, tightened available supply. That concentration gives certified suppliers clear leverage to press prices and contractual terms.
OEM manufacturing and critical components
As of 2024 Traeger relies on contract manufacturers for metal fabrication, electronic controllers, augers and temperature probes, concentrating sourcing with a limited set of OEMs. Specialized electronics and firmware-compatible parts limit substitution and raise switching costs. Capacity constraints or quality issues at those few OEMs can quickly disrupt production and inventory turns. This dependence elevates supplier bargaining power.

Logistics, freight, and seasonal surges
Grills are bulky and highly seasonal, concentrating shipments in spring/summer and stressing ocean freight, ports and domestic trucking; in 2024 peak-season windows saw carrier surcharges and spot rates spike as much as 40% on certain lanes. Carriers and drayage firms can push through higher rates when capacity tightens, shifting volatility into landed costs. Freight swings in 2024 materially compressed retail margins, giving logistics providers episodic bargaining power.

Private-label and co-pack for consumables
Rubs, sauces, and pellets commonly use co-packers holding SQF, BRC or HACCP certifications; switching co-packers requires reformulation, supplier audits and packaging retooling, while typical shelf-life for dry rubs/pellets is 12–24 months, constraining flexibility and increasing dependency on established co-packers.
- MOQ pressure: many co-packers require large minimum runs
- Lead-time impact: audits and retooling extend timelines
- Pricing power: certification and shelf-life constraints raise supplier influence
Input inflation and commodity pass-through
Input inflation—notably swings in steel and electronics—flows quickly into supplier quotes for Traeger grills, and with strong demand suppliers often pass costs to OEMs faster than brands can raise retail; Section 301 tariffs on many Chinese goods remain at up to 25%, amplifying pass-through. Currency moves and tariff shifts in 2024 heightened this asymmetry, strengthening supplier power in inflationary cycles.
- Steel/electronics volatility → faster supplier reprices
- Tariffs (Section 301 up to 25%) amplify cost pass-through
- Demand-driven asymmetry increases supplier leverage
Concentrated pellet and OEM supply raises costs, QC risk; freight +40%, tariffs up to 25%
Certified hardwood pellet and flavor-wood supply is concentrated, raising switching costs and QC risk after 2023–24 regional disruptions. Traeger’s reliance on a few metal/electronics OEMs and certified co-packers limits substitution and elevates supplier leverage. Freight and input inflation (steel/electronics) plus Section 301 tariffs (up to 25%) amplify supplier pricing power.
| Input | 2024 metric |
|---|---|
| Top pellet mills | Top 3 ≈60% supply |
| OEM parts | Top 4 ≈70% reliance |
| Peak freight | Spot +40% |
| Tariffs | Section 301 up to 25% |
What is included in the product
 Detailed Word Document
Tailored exclusively for Traeger, this Porter's Five Forces overview uncovers key drivers of competition, supplier and buyer power, substitutes and entrant threats, and highlights disruptive trends and market dynamics that influence pricing, profitability and strategic positioning.

 Customizable Excel Spreadsheet
One-sheet Traeger Porter's Five Forces that visualizes competitive pressure with an editable spider chart—easy to customize, copy into decks, and update for shifting market dynamics.
Customers Bargaining Power

Retail channel concentration
Large home-improvement and club retailers such as Home Depot (2023 net sales $157.4 billion) and Lowe’s (2023 net sales $96.3 billion) command significant shelf and endcap control, with volume and traffic that are hard for Traeger to replace quickly. These buyers negotiate aggressive terms including coop marketing, promotional funding, and liberal returns policies, compressing supplier margins. The concentration of such retailers raises buyer bargaining power and increases Traeger’s dependence on a few large customers.
Informed consumers and easy price comparisons
Shoppers routinely benchmark features and prices across pellet, gas and charcoal grills online, with 77% of consumers consulting reviews before purchase (BrightLocal 2023) and the influencer marketing market reaching about 21 billion USD in 2024 (Statista), compressing perceived differentiation; visible holiday promotions (peak discounting windows) and high price/feature transparency elevate buyer leverage on both price and specs.

Moderate switching costs for grills
Pellet and accessory ecosystems increase repeat purchases but consumers often switch brands at the next grill purchase, so existing pellet inventories produce only modest lock-in. Warranty coverage and dealer/service networks reduce churn but do not eliminate it. Pre-purchase buyers retain higher leverage through comparison shopping and reviews, keeping buyer power at a moderate level.

Accessory and consumable cross-shopping
Accessory and consumable cross-shopping is high: rubs, sauces and generic pellets face numerous alternatives at similar price points, enabling retailers to swap facings to private label quickly; U.S. grocery private-label penetration was about 20% in 2024, lowering margins on non-core SKUs. Consumers trial flavors and brands with low risk, accelerating churn and eroding Traeger’s pricing power on accessories and consumables.
- High substitution: many SKU-level alternatives
- Retail agility: private-label swap enabled
- Low switching cost: consumer trial behavior
- Financial impact: ~20% private-label penetration (2024) depresses non-core margins
Economic sensitivity and deal-seeking
- Discretionary spend sensitivity — buyers delay or downgrade
- Retailer promotions — bundles/private-label to maintain volume
- Macro leverage — higher markdowns and tougher payment terms
Retailer shelf power, reviews 77%, private-label 20%, inflation 3.4%
Large retailers (Home Depot $157.4B, Lowe’s $96.3B 2023) exert strong terms and shelf control; online price/transparency (77% consult reviews 2023) boosts buyer leverage. Low switching costs, high SKU substitution and ~20% private-label penetration (2024) compress non-core margins. Cyclicality and 3.4% US inflation (2024) increase promo sensitivity and markdown risk.
| Metric | Value | Year |
|---|---|---|
| Home Depot sales | $157.4B | 2023 |
| Lowe’s sales | $96.3B | 2023 |
| Review consult | 77% | 2023 |
| Private-label | ~20% | 2024 |
| US inflation | 3.4% | 2024 |
Full Version Awaits
Traeger Porter's Five Forces Analysis
This Traeger Porter's Five Forces Analysis is the exact, fully formatted document you’re previewing and the same file you’ll receive instantly after purchase. It delivers a complete assessment of industry rivalry, supplier and buyer power, threat of substitutes and entrants, and strategic implications. Ready to download and use—no placeholders, no samples, just the final analysis.

Don't Miss the Bigger Picture
Traeger's Porter's Five Forces snapshot highlights competitive intensity across suppliers, buyers, substitutes and new entrants and pinpoints where Traeger holds leverage or faces pressure. The brief flags strategic risks and growth levers but stops short of granular ratings and data. Unlock the full Porter's Five Forces Analysis to see force-by-force scores, visuals, and actionable recommendations tailored to Traeger.
Suppliers Bargaining Power
Concentrated pellet and flavor-wood sourcing
Food-grade hardwood pellet and flavor-wood sourcing is highly concentrated, with far fewer certified mills producing consistent pellet sizing and premium blends than generic fuel vendors, raising effective switching costs and QC risks. Regional forestry disruptions in 2023–2024, including droughts and storm losses in key Southeastern and Pacific Northwest stands, tightened available supply. That concentration gives certified suppliers clear leverage to press prices and contractual terms.
OEM manufacturing and critical components
As of 2024 Traeger relies on contract manufacturers for metal fabrication, electronic controllers, augers and temperature probes, concentrating sourcing with a limited set of OEMs. Specialized electronics and firmware-compatible parts limit substitution and raise switching costs. Capacity constraints or quality issues at those few OEMs can quickly disrupt production and inventory turns. This dependence elevates supplier bargaining power.
Logistics, freight, and seasonal surges
Grills are bulky and highly seasonal, concentrating shipments in spring/summer and stressing ocean freight, ports and domestic trucking; in 2024 peak-season windows saw carrier surcharges and spot rates spike as much as 40% on certain lanes. Carriers and drayage firms can push through higher rates when capacity tightens, shifting volatility into landed costs. Freight swings in 2024 materially compressed retail margins, giving logistics providers episodic bargaining power.
Private-label and co-pack for consumables
Rubs, sauces, and pellets commonly use co-packers holding SQF, BRC or HACCP certifications; switching co-packers requires reformulation, supplier audits and packaging retooling, while typical shelf-life for dry rubs/pellets is 12–24 months, constraining flexibility and increasing dependency on established co-packers.
- MOQ pressure: many co-packers require large minimum runs
- Lead-time impact: audits and retooling extend timelines
- Pricing power: certification and shelf-life constraints raise supplier influence
Input inflation and commodity pass-through
Input inflation—notably swings in steel and electronics—flows quickly into supplier quotes for Traeger grills, and with strong demand suppliers often pass costs to OEMs faster than brands can raise retail; Section 301 tariffs on many Chinese goods remain at up to 25%, amplifying pass-through. Currency moves and tariff shifts in 2024 heightened this asymmetry, strengthening supplier power in inflationary cycles.
- Steel/electronics volatility → faster supplier reprices
- Tariffs (Section 301 up to 25%) amplify cost pass-through
- Demand-driven asymmetry increases supplier leverage
Concentrated pellet and OEM supply raises costs, QC risk; freight +40%, tariffs up to 25%
Certified hardwood pellet and flavor-wood supply is concentrated, raising switching costs and QC risk after 2023–24 regional disruptions. Traeger’s reliance on a few metal/electronics OEMs and certified co-packers limits substitution and elevates supplier leverage. Freight and input inflation (steel/electronics) plus Section 301 tariffs (up to 25%) amplify supplier pricing power.
| Input | 2024 metric |
|---|---|
| Top pellet mills | Top 3 ≈60% supply |
| OEM parts | Top 4 ≈70% reliance |
| Peak freight | Spot +40% |
| Tariffs | Section 301 up to 25% |
What is included in the product
Detailed Word Document
Tailored exclusively for Traeger, this Porter's Five Forces overview uncovers key drivers of competition, supplier and buyer power, substitutes and entrant threats, and highlights disruptive trends and market dynamics that influence pricing, profitability and strategic positioning.
Customizable Excel Spreadsheet
One-sheet Traeger Porter's Five Forces that visualizes competitive pressure with an editable spider chart—easy to customize, copy into decks, and update for shifting market dynamics.
Customers Bargaining Power
Retail channel concentration
Large home-improvement and club retailers such as Home Depot (2023 net sales $157.4 billion) and Lowe’s (2023 net sales $96.3 billion) command significant shelf and endcap control, with volume and traffic that are hard for Traeger to replace quickly. These buyers negotiate aggressive terms including coop marketing, promotional funding, and liberal returns policies, compressing supplier margins. The concentration of such retailers raises buyer bargaining power and increases Traeger’s dependence on a few large customers.
Informed consumers and easy price comparisons
Shoppers routinely benchmark features and prices across pellet, gas and charcoal grills online, with 77% of consumers consulting reviews before purchase (BrightLocal 2023) and the influencer marketing market reaching about 21 billion USD in 2024 (Statista), compressing perceived differentiation; visible holiday promotions (peak discounting windows) and high price/feature transparency elevate buyer leverage on both price and specs.
Moderate switching costs for grills
Pellet and accessory ecosystems increase repeat purchases but consumers often switch brands at the next grill purchase, so existing pellet inventories produce only modest lock-in. Warranty coverage and dealer/service networks reduce churn but do not eliminate it. Pre-purchase buyers retain higher leverage through comparison shopping and reviews, keeping buyer power at a moderate level.
Accessory and consumable cross-shopping
Accessory and consumable cross-shopping is high: rubs, sauces and generic pellets face numerous alternatives at similar price points, enabling retailers to swap facings to private label quickly; U.S. grocery private-label penetration was about 20% in 2024, lowering margins on non-core SKUs. Consumers trial flavors and brands with low risk, accelerating churn and eroding Traeger’s pricing power on accessories and consumables.
- High substitution: many SKU-level alternatives
- Retail agility: private-label swap enabled
- Low switching cost: consumer trial behavior
- Financial impact: ~20% private-label penetration (2024) depresses non-core margins
Economic sensitivity and deal-seeking
- Discretionary spend sensitivity — buyers delay or downgrade
- Retailer promotions — bundles/private-label to maintain volume
- Macro leverage — higher markdowns and tougher payment terms
Retailer shelf power, reviews 77%, private-label 20%, inflation 3.4%
Large retailers (Home Depot $157.4B, Lowe’s $96.3B 2023) exert strong terms and shelf control; online price/transparency (77% consult reviews 2023) boosts buyer leverage. Low switching costs, high SKU substitution and ~20% private-label penetration (2024) compress non-core margins. Cyclicality and 3.4% US inflation (2024) increase promo sensitivity and markdown risk.
| Metric | Value | Year |
|---|---|---|
| Home Depot sales | $157.4B | 2023 |
| Lowe’s sales | $96.3B | 2023 |
| Review consult | 77% | 2023 |
| Private-label | ~20% | 2024 |
| US inflation | 3.4% | 2024 |
Full Version Awaits
Traeger Porter's Five Forces Analysis
This Traeger Porter's Five Forces Analysis is the exact, fully formatted document you’re previewing and the same file you’ll receive instantly after purchase. It delivers a complete assessment of industry rivalry, supplier and buyer power, threat of substitutes and entrants, and strategic implications. Ready to download and use—no placeholders, no samples, just the final analysis.
Original: $10.00
-65%$10.00
$3.50Description
Don't Miss the Bigger Picture
Traeger's Porter's Five Forces snapshot highlights competitive intensity across suppliers, buyers, substitutes and new entrants and pinpoints where Traeger holds leverage or faces pressure. The brief flags strategic risks and growth levers but stops short of granular ratings and data. Unlock the full Porter's Five Forces Analysis to see force-by-force scores, visuals, and actionable recommendations tailored to Traeger.
Suppliers Bargaining Power
Concentrated pellet and flavor-wood sourcing
Food-grade hardwood pellet and flavor-wood sourcing is highly concentrated, with far fewer certified mills producing consistent pellet sizing and premium blends than generic fuel vendors, raising effective switching costs and QC risks. Regional forestry disruptions in 2023–2024, including droughts and storm losses in key Southeastern and Pacific Northwest stands, tightened available supply. That concentration gives certified suppliers clear leverage to press prices and contractual terms.
OEM manufacturing and critical components
As of 2024 Traeger relies on contract manufacturers for metal fabrication, electronic controllers, augers and temperature probes, concentrating sourcing with a limited set of OEMs. Specialized electronics and firmware-compatible parts limit substitution and raise switching costs. Capacity constraints or quality issues at those few OEMs can quickly disrupt production and inventory turns. This dependence elevates supplier bargaining power.
Logistics, freight, and seasonal surges
Grills are bulky and highly seasonal, concentrating shipments in spring/summer and stressing ocean freight, ports and domestic trucking; in 2024 peak-season windows saw carrier surcharges and spot rates spike as much as 40% on certain lanes. Carriers and drayage firms can push through higher rates when capacity tightens, shifting volatility into landed costs. Freight swings in 2024 materially compressed retail margins, giving logistics providers episodic bargaining power.
Private-label and co-pack for consumables
Rubs, sauces, and pellets commonly use co-packers holding SQF, BRC or HACCP certifications; switching co-packers requires reformulation, supplier audits and packaging retooling, while typical shelf-life for dry rubs/pellets is 12–24 months, constraining flexibility and increasing dependency on established co-packers.
- MOQ pressure: many co-packers require large minimum runs
- Lead-time impact: audits and retooling extend timelines
- Pricing power: certification and shelf-life constraints raise supplier influence
Input inflation and commodity pass-through
Input inflation—notably swings in steel and electronics—flows quickly into supplier quotes for Traeger grills, and with strong demand suppliers often pass costs to OEMs faster than brands can raise retail; Section 301 tariffs on many Chinese goods remain at up to 25%, amplifying pass-through. Currency moves and tariff shifts in 2024 heightened this asymmetry, strengthening supplier power in inflationary cycles.
- Steel/electronics volatility → faster supplier reprices
- Tariffs (Section 301 up to 25%) amplify cost pass-through
- Demand-driven asymmetry increases supplier leverage
Concentrated pellet and OEM supply raises costs, QC risk; freight +40%, tariffs up to 25%
Certified hardwood pellet and flavor-wood supply is concentrated, raising switching costs and QC risk after 2023–24 regional disruptions. Traeger’s reliance on a few metal/electronics OEMs and certified co-packers limits substitution and elevates supplier leverage. Freight and input inflation (steel/electronics) plus Section 301 tariffs (up to 25%) amplify supplier pricing power.
| Input | 2024 metric |
|---|---|
| Top pellet mills | Top 3 ≈60% supply |
| OEM parts | Top 4 ≈70% reliance |
| Peak freight | Spot +40% |
| Tariffs | Section 301 up to 25% |
What is included in the product
Detailed Word Document
Tailored exclusively for Traeger, this Porter's Five Forces overview uncovers key drivers of competition, supplier and buyer power, substitutes and entrant threats, and highlights disruptive trends and market dynamics that influence pricing, profitability and strategic positioning.
Customizable Excel Spreadsheet
One-sheet Traeger Porter's Five Forces that visualizes competitive pressure with an editable spider chart—easy to customize, copy into decks, and update for shifting market dynamics.
Customers Bargaining Power
Retail channel concentration
Large home-improvement and club retailers such as Home Depot (2023 net sales $157.4 billion) and Lowe’s (2023 net sales $96.3 billion) command significant shelf and endcap control, with volume and traffic that are hard for Traeger to replace quickly. These buyers negotiate aggressive terms including coop marketing, promotional funding, and liberal returns policies, compressing supplier margins. The concentration of such retailers raises buyer bargaining power and increases Traeger’s dependence on a few large customers.
Informed consumers and easy price comparisons
Shoppers routinely benchmark features and prices across pellet, gas and charcoal grills online, with 77% of consumers consulting reviews before purchase (BrightLocal 2023) and the influencer marketing market reaching about 21 billion USD in 2024 (Statista), compressing perceived differentiation; visible holiday promotions (peak discounting windows) and high price/feature transparency elevate buyer leverage on both price and specs.
Moderate switching costs for grills
Pellet and accessory ecosystems increase repeat purchases but consumers often switch brands at the next grill purchase, so existing pellet inventories produce only modest lock-in. Warranty coverage and dealer/service networks reduce churn but do not eliminate it. Pre-purchase buyers retain higher leverage through comparison shopping and reviews, keeping buyer power at a moderate level.
Accessory and consumable cross-shopping
Accessory and consumable cross-shopping is high: rubs, sauces and generic pellets face numerous alternatives at similar price points, enabling retailers to swap facings to private label quickly; U.S. grocery private-label penetration was about 20% in 2024, lowering margins on non-core SKUs. Consumers trial flavors and brands with low risk, accelerating churn and eroding Traeger’s pricing power on accessories and consumables.
- High substitution: many SKU-level alternatives
- Retail agility: private-label swap enabled
- Low switching cost: consumer trial behavior
- Financial impact: ~20% private-label penetration (2024) depresses non-core margins
Economic sensitivity and deal-seeking
- Discretionary spend sensitivity — buyers delay or downgrade
- Retailer promotions — bundles/private-label to maintain volume
- Macro leverage — higher markdowns and tougher payment terms
Retailer shelf power, reviews 77%, private-label 20%, inflation 3.4%
Large retailers (Home Depot $157.4B, Lowe’s $96.3B 2023) exert strong terms and shelf control; online price/transparency (77% consult reviews 2023) boosts buyer leverage. Low switching costs, high SKU substitution and ~20% private-label penetration (2024) compress non-core margins. Cyclicality and 3.4% US inflation (2024) increase promo sensitivity and markdown risk.
| Metric | Value | Year |
|---|---|---|
| Home Depot sales | $157.4B | 2023 |
| Lowe’s sales | $96.3B | 2023 |
| Review consult | 77% | 2023 |
| Private-label | ~20% | 2024 |
| US inflation | 3.4% | 2024 |
Full Version Awaits
Traeger Porter's Five Forces Analysis
This Traeger Porter's Five Forces Analysis is the exact, fully formatted document you’re previewing and the same file you’ll receive instantly after purchase. It delivers a complete assessment of industry rivalry, supplier and buyer power, threat of substitutes and entrants, and strategic implications. Ready to download and use—no placeholders, no samples, just the final analysis.











