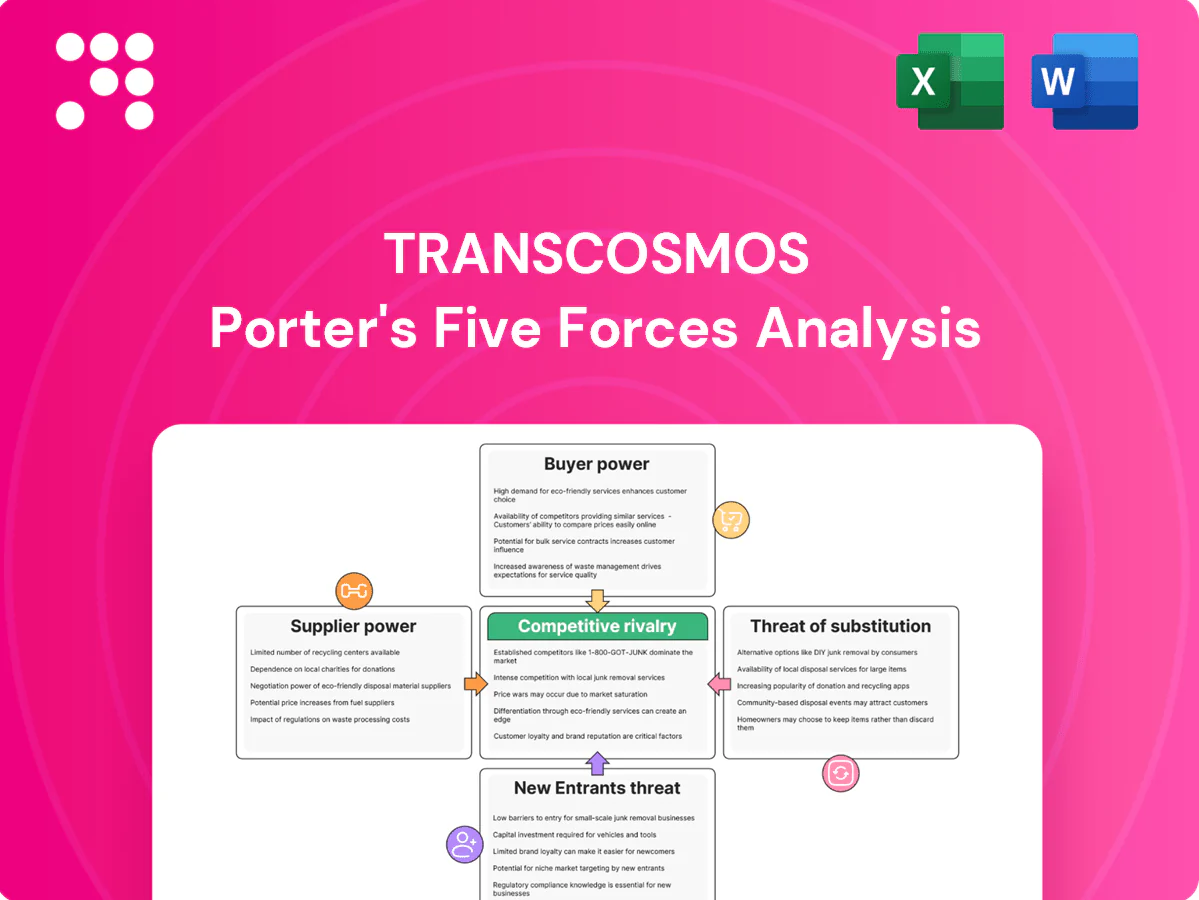
transcosmos Porter's Five Forces Analysis

Elevate Your Analysis with the Complete Porter's Five Forces Analysis
transcosmos faces moderate supplier leverage and shifting buyer expectations as digital outsourcing and e-commerce services intensify competition; cost pressures and client concentration heighten strategic risk, while new entrants and substitutes erode margins in niche segments. This snapshot highlights key tensions and resilience factors. Unlock the full Porter's Five Forces Analysis for force-by-force ratings, visuals, and actionable strategy recommendations.
Suppliers Bargaining Power

Skilled labor dependence
transcosmos depends on large pools of multilingual agents, supervisors and specialists—operating across ~25 countries with roughly 47,000 group staff in FY2024—giving skilled labor clear leverage. Tight labor markets and wage inflation (contact-center wages up ~5% in key hubs in 2024) pressure margins. Robust training, career paths and lower industry attrition targets (~30% vs typical 40%) reduce bargaining power. Automation and workforce-management tools (AI scheduling, RPA) help rebalance dynamics.
Technology platform vendors
Cloud, CCaaS, CRM and analytics vendors exert strong supplier power for transcosmos: in 2024 the cloud IaaS/PaaS market was led by AWS ~32%, Azure ~22% and Google ~11%, creating switching costs and licensing lock-in for contact center suites, AI and RPA. Vendor consolidation and proprietary ecosystems raise dependence, while multi-vendor strategies, open APIs and volume commitments (enterprise discounts) mitigate pricing and support risk.

Telecom and connectivity
Reliable voice/data networks are mission-critical for transcosmos, giving regional carriers leverage over pricing and SLAs as outages can cost customers thousands per hour; major regional carriers often dominate last-mile access. Redundant carriers and rising SD-WAN adoption, with the SD-WAN market estimated around 4–5 billion USD in 2024, lower single-supplier risk. Usage-based pricing and strict QoS requirements can raise operating costs, while long-term bandwidth contracts stabilize unit rates but reduce flexibility.

Data and tooling providers
Access to data enrichment, QA tools and knowledge bases directly affects transcosmos service quality; major hyperscalers and tooling ecosystems (AWS/Azure/GCP ~65% cloud market share in 2024) dominate supply and can set terms, while GDPR and CCPA data-residency rules constrain vendor choice; niche providers often command premiums, and internal/open-source tooling reduces dependency and cost exposure.
- Data residency: GDPR, CCPA
- Hyperscaler share 2024: ~65%
- Niche premium pricing common
- Internal/open-source lowers vendor risk
Real estate and facilities
- Landlord leverage: scarce prime sites
- Demand down: ~40% hybrid adoption (2024)
- Lease rigidity: long-term contracts risk
- Economic cycle: power swings tenant↔landlord
Supplier power moderate-high: 47k, hyperscalers ~65%
Supplier power for transcosmos is moderate–high: labor leverage is strong with ~47,000 staff and contact‑center wages up ~5% in 2024, while hyperscalers (AWS 32%, Azure 22%, GCP 11%; ~65% total) and CCaaS vendors create lock‑in. Network/carrier dependence raises SLA risk, though SD‑WAN adoption (~$4–5bn market 2024) and multi‑vendor/open APIs mitigate it.
| Item | 2024 Metric |
|---|---|
| Group staff | ~47,000 |
| Hyperscaler share | ~65% |
| Wage inflation | ~+5% |
What is included in the product
 Detailed Word Document
Concise Porter's Five Forces analysis of transcosmos that uncovers competitive intensity, buyer and supplier power, threats from new entrants and substitutes, and identifies disruptive trends and strategic levers to protect market share and improve profitability.

 Customizable Excel Spreadsheet
A clear, one-sheet summary of transcosmos's Five Forces—quickly reveals competitive pressures and actionable levers to ease strategic decision-making and operational pain points.
Customers Bargaining Power

Enterprise client concentration
Large enterprise clients with multi-process scopes command strong negotiating power, pushing for volume discounts, outcome-based pricing and strict SLAs; transcosmos reported consolidated revenue of ¥205.4 billion in FY2024, so loss of a marquee account (top 5 clients ~30% of revenue) would be material. Diversifying across sectors and geographies reduces this concentration risk and weakens customer bargaining leverage.
Intense RFP competition
Standardized RFPs let buyers compare price and capability side-by-side, driving intense competition and procurement demands for rate cards, penalties and benchmarking; industry studies in 2024 show such practices can compress vendor margins by up to 15%. Procurement-led proof-of-value pilots further shorten sales cycles and pressure pricing initially. transcosmos can defend rates by differentiating with AI-driven automation, CX design and vertical expertise, where premium win rates exceed commodity bids.

Switching and integration costs
Integration with CRMs, order systems and workflows in 2024 raises tangible switching costs for transcosmos clients, as deep API ties and data mapping extend migration timelines and budgets. Mature knowledge bases and trained contact-center teams further entrench the provider, making full replacement disruptive. Buyers still leverage credible switch threats to extract concessions, while co-invested transformation roadmaps create multi-year lock-in of value.

Performance transparency
Performance transparency: real-time dashboards and SLA scorecards make transcosmos delivery visible, and underperformance now routinely triggers credits or re-bids; in 2024 outcome-linked pricing increased, aligning incentives but raising buyer leverage, while continuous improvement cadences sustain satisfaction and reduce churn.
- Real-time visibility drives enforcement
- Credits/re-bids penalize underperformance
- Continuous improvement preserves NPS
- Outcome pricing boosts buyer bargaining
Global delivery demands
Buyers now demand multilingual, 24/7 omnichannel coverage at scale, forcing transcosmos to flex capacity across regions rapidly and increasing customer negotiating clout; Gartner reported omnichannel service expectations surged through 2024. Complexity raises pricing and SLA pressure, while transcosmos reliance on network breadth and standardized playbooks lowers marginal cost per interaction and shortens ramp times.
- Omnichannel demand: 24/7 global coverage
- Operational need: rapid regional capacity shifts
- Buyer power: higher SLA and price leverage
- Defense: broad network + standardized playbooks
Marquee client risk: top-5 ≈30% of ¥205.4B revenue; 24/7 omnichannel and 15% margin pressure
Large enterprise clients wield strong bargaining power—loss of a marquee account (top 5 ≈30% revenue) would be material to FY2024 consolidated revenue of ¥205.4 billion. Standardized RFPs and omnichannel 24/7 demands compress margins (industry studies show up to 15% pressure) while integration raises switching costs and creates multi-year lock-in. Outcome-linked pricing and real-time SLAs increase buyer leverage but premium AI/CX capabilities support higher win rates.
| Metric | Value |
|---|---|
| FY2024 revenue | ¥205.4 billion |
| Top-5 client share | ≈30% |
| Margin pressure (2024) | up to 15% |
| Omnichannel | 24/7 global demand |
Same Document Delivered
transcosmos Porter's Five Forces Analysis
This preview shows the exact transcosmos Porter's Five Forces analysis you'll receive after purchase—fully formatted, professional, and ready for immediate use. The content here is the complete deliverable, not a sample or mockup, and includes the same insights, evidence and conclusions as the downloadable file. Buy with confidence: instant access to this identical document is granted upon payment.

Elevate Your Analysis with the Complete Porter's Five Forces Analysis
transcosmos faces moderate supplier leverage and shifting buyer expectations as digital outsourcing and e-commerce services intensify competition; cost pressures and client concentration heighten strategic risk, while new entrants and substitutes erode margins in niche segments. This snapshot highlights key tensions and resilience factors. Unlock the full Porter's Five Forces Analysis for force-by-force ratings, visuals, and actionable strategy recommendations.
Suppliers Bargaining Power
Skilled labor dependence
transcosmos depends on large pools of multilingual agents, supervisors and specialists—operating across ~25 countries with roughly 47,000 group staff in FY2024—giving skilled labor clear leverage. Tight labor markets and wage inflation (contact-center wages up ~5% in key hubs in 2024) pressure margins. Robust training, career paths and lower industry attrition targets (~30% vs typical 40%) reduce bargaining power. Automation and workforce-management tools (AI scheduling, RPA) help rebalance dynamics.
Technology platform vendors
Cloud, CCaaS, CRM and analytics vendors exert strong supplier power for transcosmos: in 2024 the cloud IaaS/PaaS market was led by AWS ~32%, Azure ~22% and Google ~11%, creating switching costs and licensing lock-in for contact center suites, AI and RPA. Vendor consolidation and proprietary ecosystems raise dependence, while multi-vendor strategies, open APIs and volume commitments (enterprise discounts) mitigate pricing and support risk.
Telecom and connectivity
Reliable voice/data networks are mission-critical for transcosmos, giving regional carriers leverage over pricing and SLAs as outages can cost customers thousands per hour; major regional carriers often dominate last-mile access. Redundant carriers and rising SD-WAN adoption, with the SD-WAN market estimated around 4–5 billion USD in 2024, lower single-supplier risk. Usage-based pricing and strict QoS requirements can raise operating costs, while long-term bandwidth contracts stabilize unit rates but reduce flexibility.
Data and tooling providers
Access to data enrichment, QA tools and knowledge bases directly affects transcosmos service quality; major hyperscalers and tooling ecosystems (AWS/Azure/GCP ~65% cloud market share in 2024) dominate supply and can set terms, while GDPR and CCPA data-residency rules constrain vendor choice; niche providers often command premiums, and internal/open-source tooling reduces dependency and cost exposure.
- Data residency: GDPR, CCPA
- Hyperscaler share 2024: ~65%
- Niche premium pricing common
- Internal/open-source lowers vendor risk
Real estate and facilities
- Landlord leverage: scarce prime sites
- Demand down: ~40% hybrid adoption (2024)
- Lease rigidity: long-term contracts risk
- Economic cycle: power swings tenant↔landlord
Supplier power moderate-high: 47k, hyperscalers ~65%
Supplier power for transcosmos is moderate–high: labor leverage is strong with ~47,000 staff and contact‑center wages up ~5% in 2024, while hyperscalers (AWS 32%, Azure 22%, GCP 11%; ~65% total) and CCaaS vendors create lock‑in. Network/carrier dependence raises SLA risk, though SD‑WAN adoption (~$4–5bn market 2024) and multi‑vendor/open APIs mitigate it.
| Item | 2024 Metric |
|---|---|
| Group staff | ~47,000 |
| Hyperscaler share | ~65% |
| Wage inflation | ~+5% |
What is included in the product
Detailed Word Document
Concise Porter's Five Forces analysis of transcosmos that uncovers competitive intensity, buyer and supplier power, threats from new entrants and substitutes, and identifies disruptive trends and strategic levers to protect market share and improve profitability.
Customizable Excel Spreadsheet
A clear, one-sheet summary of transcosmos's Five Forces—quickly reveals competitive pressures and actionable levers to ease strategic decision-making and operational pain points.
Customers Bargaining Power
Enterprise client concentration
Large enterprise clients with multi-process scopes command strong negotiating power, pushing for volume discounts, outcome-based pricing and strict SLAs; transcosmos reported consolidated revenue of ¥205.4 billion in FY2024, so loss of a marquee account (top 5 clients ~30% of revenue) would be material. Diversifying across sectors and geographies reduces this concentration risk and weakens customer bargaining leverage.
Intense RFP competition
Standardized RFPs let buyers compare price and capability side-by-side, driving intense competition and procurement demands for rate cards, penalties and benchmarking; industry studies in 2024 show such practices can compress vendor margins by up to 15%. Procurement-led proof-of-value pilots further shorten sales cycles and pressure pricing initially. transcosmos can defend rates by differentiating with AI-driven automation, CX design and vertical expertise, where premium win rates exceed commodity bids.
Switching and integration costs
Integration with CRMs, order systems and workflows in 2024 raises tangible switching costs for transcosmos clients, as deep API ties and data mapping extend migration timelines and budgets. Mature knowledge bases and trained contact-center teams further entrench the provider, making full replacement disruptive. Buyers still leverage credible switch threats to extract concessions, while co-invested transformation roadmaps create multi-year lock-in of value.
Performance transparency
Performance transparency: real-time dashboards and SLA scorecards make transcosmos delivery visible, and underperformance now routinely triggers credits or re-bids; in 2024 outcome-linked pricing increased, aligning incentives but raising buyer leverage, while continuous improvement cadences sustain satisfaction and reduce churn.
- Real-time visibility drives enforcement
- Credits/re-bids penalize underperformance
- Continuous improvement preserves NPS
- Outcome pricing boosts buyer bargaining
Global delivery demands
Buyers now demand multilingual, 24/7 omnichannel coverage at scale, forcing transcosmos to flex capacity across regions rapidly and increasing customer negotiating clout; Gartner reported omnichannel service expectations surged through 2024. Complexity raises pricing and SLA pressure, while transcosmos reliance on network breadth and standardized playbooks lowers marginal cost per interaction and shortens ramp times.
- Omnichannel demand: 24/7 global coverage
- Operational need: rapid regional capacity shifts
- Buyer power: higher SLA and price leverage
- Defense: broad network + standardized playbooks
Marquee client risk: top-5 ≈30% of ¥205.4B revenue; 24/7 omnichannel and 15% margin pressure
Large enterprise clients wield strong bargaining power—loss of a marquee account (top 5 ≈30% revenue) would be material to FY2024 consolidated revenue of ¥205.4 billion. Standardized RFPs and omnichannel 24/7 demands compress margins (industry studies show up to 15% pressure) while integration raises switching costs and creates multi-year lock-in. Outcome-linked pricing and real-time SLAs increase buyer leverage but premium AI/CX capabilities support higher win rates.
| Metric | Value |
|---|---|
| FY2024 revenue | ¥205.4 billion |
| Top-5 client share | ≈30% |
| Margin pressure (2024) | up to 15% |
| Omnichannel | 24/7 global demand |
Same Document Delivered
transcosmos Porter's Five Forces Analysis
This preview shows the exact transcosmos Porter's Five Forces analysis you'll receive after purchase—fully formatted, professional, and ready for immediate use. The content here is the complete deliverable, not a sample or mockup, and includes the same insights, evidence and conclusions as the downloadable file. Buy with confidence: instant access to this identical document is granted upon payment.
Description
Elevate Your Analysis with the Complete Porter's Five Forces Analysis
transcosmos faces moderate supplier leverage and shifting buyer expectations as digital outsourcing and e-commerce services intensify competition; cost pressures and client concentration heighten strategic risk, while new entrants and substitutes erode margins in niche segments. This snapshot highlights key tensions and resilience factors. Unlock the full Porter's Five Forces Analysis for force-by-force ratings, visuals, and actionable strategy recommendations.
Suppliers Bargaining Power
Skilled labor dependence
transcosmos depends on large pools of multilingual agents, supervisors and specialists—operating across ~25 countries with roughly 47,000 group staff in FY2024—giving skilled labor clear leverage. Tight labor markets and wage inflation (contact-center wages up ~5% in key hubs in 2024) pressure margins. Robust training, career paths and lower industry attrition targets (~30% vs typical 40%) reduce bargaining power. Automation and workforce-management tools (AI scheduling, RPA) help rebalance dynamics.
Technology platform vendors
Cloud, CCaaS, CRM and analytics vendors exert strong supplier power for transcosmos: in 2024 the cloud IaaS/PaaS market was led by AWS ~32%, Azure ~22% and Google ~11%, creating switching costs and licensing lock-in for contact center suites, AI and RPA. Vendor consolidation and proprietary ecosystems raise dependence, while multi-vendor strategies, open APIs and volume commitments (enterprise discounts) mitigate pricing and support risk.
Telecom and connectivity
Reliable voice/data networks are mission-critical for transcosmos, giving regional carriers leverage over pricing and SLAs as outages can cost customers thousands per hour; major regional carriers often dominate last-mile access. Redundant carriers and rising SD-WAN adoption, with the SD-WAN market estimated around 4–5 billion USD in 2024, lower single-supplier risk. Usage-based pricing and strict QoS requirements can raise operating costs, while long-term bandwidth contracts stabilize unit rates but reduce flexibility.
Data and tooling providers
Access to data enrichment, QA tools and knowledge bases directly affects transcosmos service quality; major hyperscalers and tooling ecosystems (AWS/Azure/GCP ~65% cloud market share in 2024) dominate supply and can set terms, while GDPR and CCPA data-residency rules constrain vendor choice; niche providers often command premiums, and internal/open-source tooling reduces dependency and cost exposure.
- Data residency: GDPR, CCPA
- Hyperscaler share 2024: ~65%
- Niche premium pricing common
- Internal/open-source lowers vendor risk
Real estate and facilities
- Landlord leverage: scarce prime sites
- Demand down: ~40% hybrid adoption (2024)
- Lease rigidity: long-term contracts risk
- Economic cycle: power swings tenant↔landlord
Supplier power moderate-high: 47k, hyperscalers ~65%
Supplier power for transcosmos is moderate–high: labor leverage is strong with ~47,000 staff and contact‑center wages up ~5% in 2024, while hyperscalers (AWS 32%, Azure 22%, GCP 11%; ~65% total) and CCaaS vendors create lock‑in. Network/carrier dependence raises SLA risk, though SD‑WAN adoption (~$4–5bn market 2024) and multi‑vendor/open APIs mitigate it.
| Item | 2024 Metric |
|---|---|
| Group staff | ~47,000 |
| Hyperscaler share | ~65% |
| Wage inflation | ~+5% |
What is included in the product
Detailed Word Document
Concise Porter's Five Forces analysis of transcosmos that uncovers competitive intensity, buyer and supplier power, threats from new entrants and substitutes, and identifies disruptive trends and strategic levers to protect market share and improve profitability.
Customizable Excel Spreadsheet
A clear, one-sheet summary of transcosmos's Five Forces—quickly reveals competitive pressures and actionable levers to ease strategic decision-making and operational pain points.
Customers Bargaining Power
Enterprise client concentration
Large enterprise clients with multi-process scopes command strong negotiating power, pushing for volume discounts, outcome-based pricing and strict SLAs; transcosmos reported consolidated revenue of ¥205.4 billion in FY2024, so loss of a marquee account (top 5 clients ~30% of revenue) would be material. Diversifying across sectors and geographies reduces this concentration risk and weakens customer bargaining leverage.
Intense RFP competition
Standardized RFPs let buyers compare price and capability side-by-side, driving intense competition and procurement demands for rate cards, penalties and benchmarking; industry studies in 2024 show such practices can compress vendor margins by up to 15%. Procurement-led proof-of-value pilots further shorten sales cycles and pressure pricing initially. transcosmos can defend rates by differentiating with AI-driven automation, CX design and vertical expertise, where premium win rates exceed commodity bids.
Switching and integration costs
Integration with CRMs, order systems and workflows in 2024 raises tangible switching costs for transcosmos clients, as deep API ties and data mapping extend migration timelines and budgets. Mature knowledge bases and trained contact-center teams further entrench the provider, making full replacement disruptive. Buyers still leverage credible switch threats to extract concessions, while co-invested transformation roadmaps create multi-year lock-in of value.
Performance transparency
Performance transparency: real-time dashboards and SLA scorecards make transcosmos delivery visible, and underperformance now routinely triggers credits or re-bids; in 2024 outcome-linked pricing increased, aligning incentives but raising buyer leverage, while continuous improvement cadences sustain satisfaction and reduce churn.
- Real-time visibility drives enforcement
- Credits/re-bids penalize underperformance
- Continuous improvement preserves NPS
- Outcome pricing boosts buyer bargaining
Global delivery demands
Buyers now demand multilingual, 24/7 omnichannel coverage at scale, forcing transcosmos to flex capacity across regions rapidly and increasing customer negotiating clout; Gartner reported omnichannel service expectations surged through 2024. Complexity raises pricing and SLA pressure, while transcosmos reliance on network breadth and standardized playbooks lowers marginal cost per interaction and shortens ramp times.
- Omnichannel demand: 24/7 global coverage
- Operational need: rapid regional capacity shifts
- Buyer power: higher SLA and price leverage
- Defense: broad network + standardized playbooks
Marquee client risk: top-5 ≈30% of ¥205.4B revenue; 24/7 omnichannel and 15% margin pressure
Large enterprise clients wield strong bargaining power—loss of a marquee account (top 5 ≈30% revenue) would be material to FY2024 consolidated revenue of ¥205.4 billion. Standardized RFPs and omnichannel 24/7 demands compress margins (industry studies show up to 15% pressure) while integration raises switching costs and creates multi-year lock-in. Outcome-linked pricing and real-time SLAs increase buyer leverage but premium AI/CX capabilities support higher win rates.
| Metric | Value |
|---|---|
| FY2024 revenue | ¥205.4 billion |
| Top-5 client share | ≈30% |
| Margin pressure (2024) | up to 15% |
| Omnichannel | 24/7 global demand |
Same Document Delivered
transcosmos Porter's Five Forces Analysis
This preview shows the exact transcosmos Porter's Five Forces analysis you'll receive after purchase—fully formatted, professional, and ready for immediate use. The content here is the complete deliverable, not a sample or mockup, and includes the same insights, evidence and conclusions as the downloadable file. Buy with confidence: instant access to this identical document is granted upon payment.











