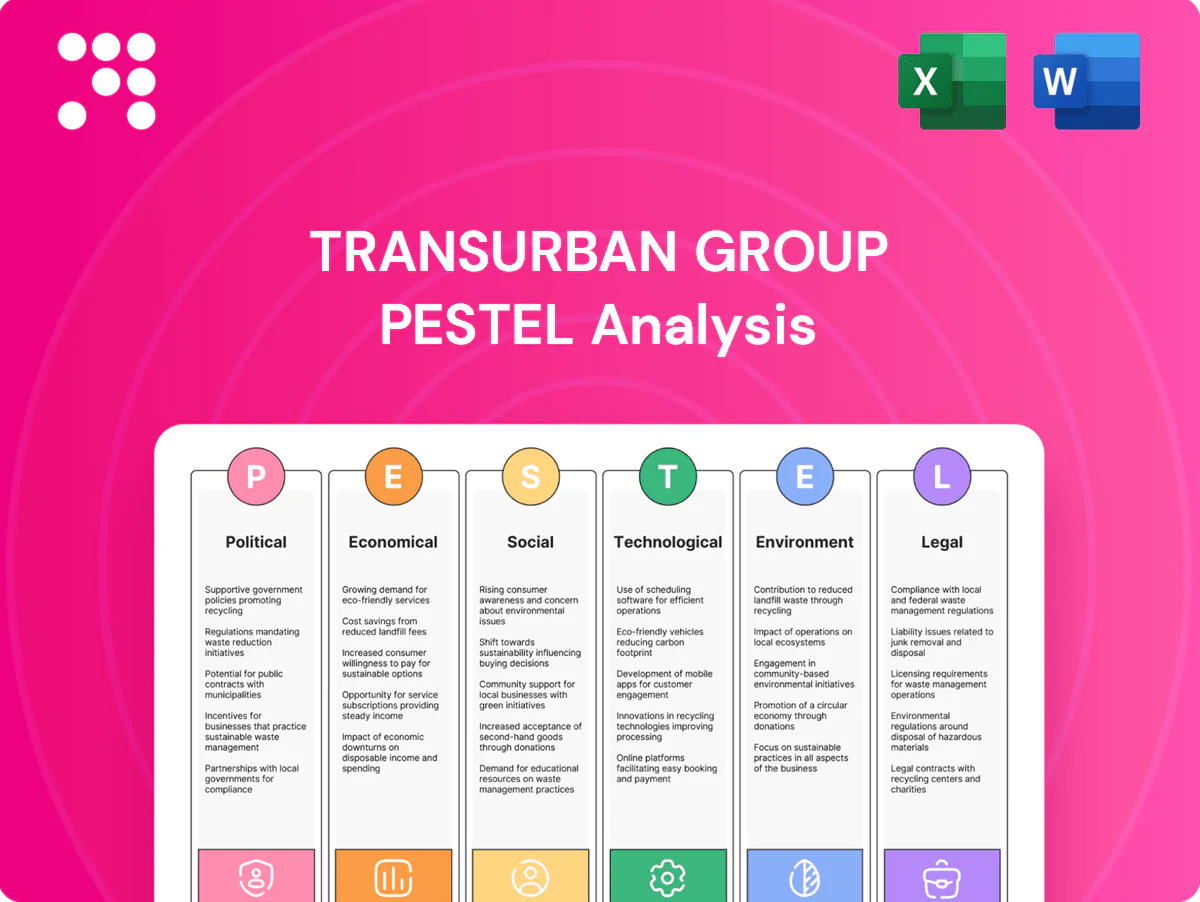
Transurban Group PESTLE Analysis

Your Competitive Advantage Starts with This Report
Our PESTLE Analysis of Transurban Group reveals how regulatory shifts, infrastructure funding, urbanization, tech-driven tolling and environmental scrutiny converge to shape growth and risk. Actionable insights highlight strategic levers and vulnerabilities for investors and planners. Purchase the full report to access the complete, ready-to-use breakdown and forecasts.
Political factors

PPP and concession policy stability
Transurban’s model depends on long-dated PPP frameworks, with concessions commonly exceeding 30 years and operations across Australia, the US and Canada; stable concession terms underpin recoverable capital and FY2024 toll revenue of about A$3.1bn. Shifts in government priorities can change revenue-sharing and extension options, raising bid premia and cost of capital and stalling a multibillion-dollar project pipeline.
Tolling regulation and pricing caps
Governments set toll escalation formulas, discount schemes and hardship reliefs that directly alter Transurban’s multi‑billion dollar cash flows; indexation and relief rules applied at contract level determine revenue predictability. Caps tied to CPI (Australia CPI ~4% in 2024) or fixed schedules limit pricing flexibility during cost spikes. Political pressure can prompt temporary toll freezes or rebates, while clear indexation rules across 30–99 year concessions help preserve real returns.

Election cycles and populist pressures
Election cycles can elevate anti-toll rhetoric, threaten contract renegotiations or delay approvals in markets where Transurban operates (ASX: TCL) across Australia, the US and Canada. Populist policies often favor short-term fee relief over long-term asset sustainability, risking revenue and maintenance funding. Proactive stakeholder engagement preserves license-to-operate, while balanced messaging on congestion reduction and travel-time reliability is critical to withstand political pressure.

Infrastructure stimulus and funding priorities
Public capital programs shape new corridors and enhancements that build Transurban's demand pipeline; Australia’s infrastructure commitments (circa A$120 billion+ over a decade in recent budgets) can accelerate feeder projects onto tolled networks, boosting volumes and revenue. Competing free-road expansions risk diluting traffic and yield, while alignment with national productivity agendas improves partnership and contract prospects.
- Public pipeline: A$120bn+ (recent budgets)
- Stimulus effect: accelerates demand onto assets
- Risk: free-road expansions dilute volumes
- Opportunity: alignment = stronger PPP/partnering
Urban planning and land-use governance
Urban zoning and transit-oriented development reshape origin–destination flows and ramp demand; corridor densification can increase traffic volumes and justify capacity expansion, noting Australia’s population was 26.2 million (ABS, Jun 2024). Integration with public transit policy affects network design and community acceptance, and Transurban’s participation in planning forums improves connectivity outcomes.
- Zoning shifts lift corridor volumes
- Transit integration alters ramp demand
- Planning forums optimize network links
Long PPP tolls, FY2024 A$3.1bn; CPI ~4%; election renegotiation risk
Transurban depends on long PPP concessions (30+ yrs) with FY2024 toll revenue ~A$3.1bn; political shifts can alter revenue-sharing and bid premia. Toll indexation (Australia CPI ~4% in 2024) and caps shape cashflow predictability. Public pipeline (A$120bn+ recent budgets) can boost volumes while free-road projects dilute yields; election cycles raise renegotiation risk.
| Metric | Value |
|---|---|
| FY2024 tolls | A$3.1bn |
| Australia CPI 2024 | ~4% |
| Public pipeline | A$120bn+ |
What is included in the product
 Detailed Word Document
Explores how macro-environmental factors uniquely affect Transurban across Political, Economic, Social, Technological, Environmental and Legal dimensions, providing data-driven trends and forward-looking insights to help executives and investors identify risks, opportunities and strategic responses for toll-road operations in Australia, North America and Europe.

 Customizable Excel Spreadsheet
A concise, PESTLE-segmented Transurban Group briefing that simplifies regulatory, economic and infrastructure risks for quick reference, editable for local context and easily dropped into presentations or team discussions.
Economic factors

Macro growth and traffic elasticity
GDP growth (~2–3% in Australia and North America in 2024) plus employment (unemployment ~3.7% Australia 2024) and population gains (~1–1.5% p.a.) drive vehicle kilometres travelled and toll demand, with VKT near 95–100% of 2019 levels by 2024. Business cycles alter commuter and freight volumes with corridor-specific elasticity, higher for CBD feeders and lower for long-haul freight. Peak vs off-peak sensitivity shifts revenue yield and pricing power. Diversified metro exposure across Melbourne, Sydney, Boston and Montréal smooths localized downturns.
Interest rates and refinancing risk
Capital-intensive concessions rely on long-tenor debt and periodic refinancings—Transurban funds a large portfolio with roughly AUD 18–20bn of group debt and staggered maturities to smooth refinancing risk.
Higher rates (Australian 10-year ~4.2% in 2025) raise WACC, depress equity valuations and compress project IRRs, particularly for long-dated concessions.
Active hedging programs and maturity staggering limit rate shock exposure; investment-grade ratings (S&P BBB+, Moody's Baa2) help reduce funding costs.

Inflation dynamics and indexation
Inflation allows Transurban to lift nominal tolls where CPI indexation applies — Australian CPI eased to about 4.1% in 2024, supporting revenue growth that offsets some cost pressure. Construction inflation in labour, steel and asphalt (spikes of c.10–20% during 2021–23) has compressed project margins. A mismatch between CPI-linked tolls and PPI-linked inputs creates basis risk. Robust EPC contracts and contingency allowances have been used to mitigate overruns.

Fuel prices and mobility behavior
Rising fuel costs (Brent ~USD 83/bbl average in 2024) can reduce discretionary trips while commute and time-sensitive travel remain resilient, sustaining peak toll volumes for Transurban. Growing EV adoption—global new‑car EV share ~14% in 2024—lowers per‑km fuel sensitivity and may stabilize long‑term demand. Freight operators continue to trade higher tolls for time and fuel savings, with price elasticity differing by corridor competitiveness.
- Higher fuel ≈ fewer discretionary trips
- EVs (~14% new sales 2024) reduce fuel-price impact
- Freight: toll vs time/fuel trade-off
- Elasticity varies by corridor
Currency exposure and supply chains
Global sourcing of equipment and materials exposes Transurban to foreign exchange risk during construction, affecting project cashflows and contract margins; cross-border investors monitor dividend translation and the group hedging approach. Supply-chain disruptions can delay milestones and escalate capex and operating costs, while local content policies may reduce FX volatility but constrain vendor flexibility and pricing options.
- FX exposure: affects construction costs and dividend translation
- Hedging: critical for cross-border investor confidence
- Supply-chain: delays raise capex and timetable risk
- Local content: buffers currency swings, limits vendors
Long PPP tolls, FY2024 A$3.1bn; CPI ~4%; election renegotiation risk
Macroeconomic growth (GDP ~2–3% Australia/NA 2024), low unemployment (AU 3.7% 2024) and population gains drive VKT (~95–100% of 2019 by 2024) supporting toll demand; corridor elasticity varies. Capital intensity relies on AUD 18–20bn group debt with 10‑yr yields ~4.2% (AU 2025) raising WACC. CPI indexation (CPI ~4.1% 2024) aids revenue; EVs ~14% new sales 2024 and Brent ~USD83/bbl 2024 shift trip patterns and cost dynamics.
| Metric | Value |
|---|---|
| Group debt | AUD 18–20bn |
| AU 10y | ~4.2% (2025) |
| CPI | 4.1% (2024) |
| EV share | ~14% (2024) |
| Brent | ~USD83/bbl (2024) |
Full Version Awaits
Transurban Group PESTLE Analysis
This Transurban Group PESTLE Analysis preview is the exact document you’ll receive after purchase—fully formatted and ready to use. It delivers concise Political, Economic, Social, Technological, Legal, and Environmental insights tailored to Transurban. The structure is professional and export-ready. No placeholders or surprises—what you see is what you’ll download.

Your Competitive Advantage Starts with This Report
Our PESTLE Analysis of Transurban Group reveals how regulatory shifts, infrastructure funding, urbanization, tech-driven tolling and environmental scrutiny converge to shape growth and risk. Actionable insights highlight strategic levers and vulnerabilities for investors and planners. Purchase the full report to access the complete, ready-to-use breakdown and forecasts.
Political factors
PPP and concession policy stability
Transurban’s model depends on long-dated PPP frameworks, with concessions commonly exceeding 30 years and operations across Australia, the US and Canada; stable concession terms underpin recoverable capital and FY2024 toll revenue of about A$3.1bn. Shifts in government priorities can change revenue-sharing and extension options, raising bid premia and cost of capital and stalling a multibillion-dollar project pipeline.
Tolling regulation and pricing caps
Governments set toll escalation formulas, discount schemes and hardship reliefs that directly alter Transurban’s multi‑billion dollar cash flows; indexation and relief rules applied at contract level determine revenue predictability. Caps tied to CPI (Australia CPI ~4% in 2024) or fixed schedules limit pricing flexibility during cost spikes. Political pressure can prompt temporary toll freezes or rebates, while clear indexation rules across 30–99 year concessions help preserve real returns.
Election cycles and populist pressures
Election cycles can elevate anti-toll rhetoric, threaten contract renegotiations or delay approvals in markets where Transurban operates (ASX: TCL) across Australia, the US and Canada. Populist policies often favor short-term fee relief over long-term asset sustainability, risking revenue and maintenance funding. Proactive stakeholder engagement preserves license-to-operate, while balanced messaging on congestion reduction and travel-time reliability is critical to withstand political pressure.
Infrastructure stimulus and funding priorities
Public capital programs shape new corridors and enhancements that build Transurban's demand pipeline; Australia’s infrastructure commitments (circa A$120 billion+ over a decade in recent budgets) can accelerate feeder projects onto tolled networks, boosting volumes and revenue. Competing free-road expansions risk diluting traffic and yield, while alignment with national productivity agendas improves partnership and contract prospects.
- Public pipeline: A$120bn+ (recent budgets)
- Stimulus effect: accelerates demand onto assets
- Risk: free-road expansions dilute volumes
- Opportunity: alignment = stronger PPP/partnering
Urban planning and land-use governance
Urban zoning and transit-oriented development reshape origin–destination flows and ramp demand; corridor densification can increase traffic volumes and justify capacity expansion, noting Australia’s population was 26.2 million (ABS, Jun 2024). Integration with public transit policy affects network design and community acceptance, and Transurban’s participation in planning forums improves connectivity outcomes.
- Zoning shifts lift corridor volumes
- Transit integration alters ramp demand
- Planning forums optimize network links
Long PPP tolls, FY2024 A$3.1bn; CPI ~4%; election renegotiation risk
Transurban depends on long PPP concessions (30+ yrs) with FY2024 toll revenue ~A$3.1bn; political shifts can alter revenue-sharing and bid premia. Toll indexation (Australia CPI ~4% in 2024) and caps shape cashflow predictability. Public pipeline (A$120bn+ recent budgets) can boost volumes while free-road projects dilute yields; election cycles raise renegotiation risk.
| Metric | Value |
|---|---|
| FY2024 tolls | A$3.1bn |
| Australia CPI 2024 | ~4% |
| Public pipeline | A$120bn+ |
What is included in the product
Detailed Word Document
Explores how macro-environmental factors uniquely affect Transurban across Political, Economic, Social, Technological, Environmental and Legal dimensions, providing data-driven trends and forward-looking insights to help executives and investors identify risks, opportunities and strategic responses for toll-road operations in Australia, North America and Europe.
Customizable Excel Spreadsheet
A concise, PESTLE-segmented Transurban Group briefing that simplifies regulatory, economic and infrastructure risks for quick reference, editable for local context and easily dropped into presentations or team discussions.
Economic factors
Macro growth and traffic elasticity
GDP growth (~2–3% in Australia and North America in 2024) plus employment (unemployment ~3.7% Australia 2024) and population gains (~1–1.5% p.a.) drive vehicle kilometres travelled and toll demand, with VKT near 95–100% of 2019 levels by 2024. Business cycles alter commuter and freight volumes with corridor-specific elasticity, higher for CBD feeders and lower for long-haul freight. Peak vs off-peak sensitivity shifts revenue yield and pricing power. Diversified metro exposure across Melbourne, Sydney, Boston and Montréal smooths localized downturns.
Interest rates and refinancing risk
Capital-intensive concessions rely on long-tenor debt and periodic refinancings—Transurban funds a large portfolio with roughly AUD 18–20bn of group debt and staggered maturities to smooth refinancing risk.
Higher rates (Australian 10-year ~4.2% in 2025) raise WACC, depress equity valuations and compress project IRRs, particularly for long-dated concessions.
Active hedging programs and maturity staggering limit rate shock exposure; investment-grade ratings (S&P BBB+, Moody's Baa2) help reduce funding costs.
Inflation dynamics and indexation
Inflation allows Transurban to lift nominal tolls where CPI indexation applies — Australian CPI eased to about 4.1% in 2024, supporting revenue growth that offsets some cost pressure. Construction inflation in labour, steel and asphalt (spikes of c.10–20% during 2021–23) has compressed project margins. A mismatch between CPI-linked tolls and PPI-linked inputs creates basis risk. Robust EPC contracts and contingency allowances have been used to mitigate overruns.
Fuel prices and mobility behavior
Rising fuel costs (Brent ~USD 83/bbl average in 2024) can reduce discretionary trips while commute and time-sensitive travel remain resilient, sustaining peak toll volumes for Transurban. Growing EV adoption—global new‑car EV share ~14% in 2024—lowers per‑km fuel sensitivity and may stabilize long‑term demand. Freight operators continue to trade higher tolls for time and fuel savings, with price elasticity differing by corridor competitiveness.
- Higher fuel ≈ fewer discretionary trips
- EVs (~14% new sales 2024) reduce fuel-price impact
- Freight: toll vs time/fuel trade-off
- Elasticity varies by corridor
Currency exposure and supply chains
Global sourcing of equipment and materials exposes Transurban to foreign exchange risk during construction, affecting project cashflows and contract margins; cross-border investors monitor dividend translation and the group hedging approach. Supply-chain disruptions can delay milestones and escalate capex and operating costs, while local content policies may reduce FX volatility but constrain vendor flexibility and pricing options.
- FX exposure: affects construction costs and dividend translation
- Hedging: critical for cross-border investor confidence
- Supply-chain: delays raise capex and timetable risk
- Local content: buffers currency swings, limits vendors
Long PPP tolls, FY2024 A$3.1bn; CPI ~4%; election renegotiation risk
Macroeconomic growth (GDP ~2–3% Australia/NA 2024), low unemployment (AU 3.7% 2024) and population gains drive VKT (~95–100% of 2019 by 2024) supporting toll demand; corridor elasticity varies. Capital intensity relies on AUD 18–20bn group debt with 10‑yr yields ~4.2% (AU 2025) raising WACC. CPI indexation (CPI ~4.1% 2024) aids revenue; EVs ~14% new sales 2024 and Brent ~USD83/bbl 2024 shift trip patterns and cost dynamics.
| Metric | Value |
|---|---|
| Group debt | AUD 18–20bn |
| AU 10y | ~4.2% (2025) |
| CPI | 4.1% (2024) |
| EV share | ~14% (2024) |
| Brent | ~USD83/bbl (2024) |
Full Version Awaits
Transurban Group PESTLE Analysis
This Transurban Group PESTLE Analysis preview is the exact document you’ll receive after purchase—fully formatted and ready to use. It delivers concise Political, Economic, Social, Technological, Legal, and Environmental insights tailored to Transurban. The structure is professional and export-ready. No placeholders or surprises—what you see is what you’ll download.
Original: $10.00
-65%$10.00
$3.50Description
Your Competitive Advantage Starts with This Report
Our PESTLE Analysis of Transurban Group reveals how regulatory shifts, infrastructure funding, urbanization, tech-driven tolling and environmental scrutiny converge to shape growth and risk. Actionable insights highlight strategic levers and vulnerabilities for investors and planners. Purchase the full report to access the complete, ready-to-use breakdown and forecasts.
Political factors
PPP and concession policy stability
Transurban’s model depends on long-dated PPP frameworks, with concessions commonly exceeding 30 years and operations across Australia, the US and Canada; stable concession terms underpin recoverable capital and FY2024 toll revenue of about A$3.1bn. Shifts in government priorities can change revenue-sharing and extension options, raising bid premia and cost of capital and stalling a multibillion-dollar project pipeline.
Tolling regulation and pricing caps
Governments set toll escalation formulas, discount schemes and hardship reliefs that directly alter Transurban’s multi‑billion dollar cash flows; indexation and relief rules applied at contract level determine revenue predictability. Caps tied to CPI (Australia CPI ~4% in 2024) or fixed schedules limit pricing flexibility during cost spikes. Political pressure can prompt temporary toll freezes or rebates, while clear indexation rules across 30–99 year concessions help preserve real returns.
Election cycles and populist pressures
Election cycles can elevate anti-toll rhetoric, threaten contract renegotiations or delay approvals in markets where Transurban operates (ASX: TCL) across Australia, the US and Canada. Populist policies often favor short-term fee relief over long-term asset sustainability, risking revenue and maintenance funding. Proactive stakeholder engagement preserves license-to-operate, while balanced messaging on congestion reduction and travel-time reliability is critical to withstand political pressure.
Infrastructure stimulus and funding priorities
Public capital programs shape new corridors and enhancements that build Transurban's demand pipeline; Australia’s infrastructure commitments (circa A$120 billion+ over a decade in recent budgets) can accelerate feeder projects onto tolled networks, boosting volumes and revenue. Competing free-road expansions risk diluting traffic and yield, while alignment with national productivity agendas improves partnership and contract prospects.
- Public pipeline: A$120bn+ (recent budgets)
- Stimulus effect: accelerates demand onto assets
- Risk: free-road expansions dilute volumes
- Opportunity: alignment = stronger PPP/partnering
Urban planning and land-use governance
Urban zoning and transit-oriented development reshape origin–destination flows and ramp demand; corridor densification can increase traffic volumes and justify capacity expansion, noting Australia’s population was 26.2 million (ABS, Jun 2024). Integration with public transit policy affects network design and community acceptance, and Transurban’s participation in planning forums improves connectivity outcomes.
- Zoning shifts lift corridor volumes
- Transit integration alters ramp demand
- Planning forums optimize network links
Long PPP tolls, FY2024 A$3.1bn; CPI ~4%; election renegotiation risk
Transurban depends on long PPP concessions (30+ yrs) with FY2024 toll revenue ~A$3.1bn; political shifts can alter revenue-sharing and bid premia. Toll indexation (Australia CPI ~4% in 2024) and caps shape cashflow predictability. Public pipeline (A$120bn+ recent budgets) can boost volumes while free-road projects dilute yields; election cycles raise renegotiation risk.
| Metric | Value |
|---|---|
| FY2024 tolls | A$3.1bn |
| Australia CPI 2024 | ~4% |
| Public pipeline | A$120bn+ |
What is included in the product
Detailed Word Document
Explores how macro-environmental factors uniquely affect Transurban across Political, Economic, Social, Technological, Environmental and Legal dimensions, providing data-driven trends and forward-looking insights to help executives and investors identify risks, opportunities and strategic responses for toll-road operations in Australia, North America and Europe.
Customizable Excel Spreadsheet
A concise, PESTLE-segmented Transurban Group briefing that simplifies regulatory, economic and infrastructure risks for quick reference, editable for local context and easily dropped into presentations or team discussions.
Economic factors
Macro growth and traffic elasticity
GDP growth (~2–3% in Australia and North America in 2024) plus employment (unemployment ~3.7% Australia 2024) and population gains (~1–1.5% p.a.) drive vehicle kilometres travelled and toll demand, with VKT near 95–100% of 2019 levels by 2024. Business cycles alter commuter and freight volumes with corridor-specific elasticity, higher for CBD feeders and lower for long-haul freight. Peak vs off-peak sensitivity shifts revenue yield and pricing power. Diversified metro exposure across Melbourne, Sydney, Boston and Montréal smooths localized downturns.
Interest rates and refinancing risk
Capital-intensive concessions rely on long-tenor debt and periodic refinancings—Transurban funds a large portfolio with roughly AUD 18–20bn of group debt and staggered maturities to smooth refinancing risk.
Higher rates (Australian 10-year ~4.2% in 2025) raise WACC, depress equity valuations and compress project IRRs, particularly for long-dated concessions.
Active hedging programs and maturity staggering limit rate shock exposure; investment-grade ratings (S&P BBB+, Moody's Baa2) help reduce funding costs.
Inflation dynamics and indexation
Inflation allows Transurban to lift nominal tolls where CPI indexation applies — Australian CPI eased to about 4.1% in 2024, supporting revenue growth that offsets some cost pressure. Construction inflation in labour, steel and asphalt (spikes of c.10–20% during 2021–23) has compressed project margins. A mismatch between CPI-linked tolls and PPI-linked inputs creates basis risk. Robust EPC contracts and contingency allowances have been used to mitigate overruns.
Fuel prices and mobility behavior
Rising fuel costs (Brent ~USD 83/bbl average in 2024) can reduce discretionary trips while commute and time-sensitive travel remain resilient, sustaining peak toll volumes for Transurban. Growing EV adoption—global new‑car EV share ~14% in 2024—lowers per‑km fuel sensitivity and may stabilize long‑term demand. Freight operators continue to trade higher tolls for time and fuel savings, with price elasticity differing by corridor competitiveness.
- Higher fuel ≈ fewer discretionary trips
- EVs (~14% new sales 2024) reduce fuel-price impact
- Freight: toll vs time/fuel trade-off
- Elasticity varies by corridor
Currency exposure and supply chains
Global sourcing of equipment and materials exposes Transurban to foreign exchange risk during construction, affecting project cashflows and contract margins; cross-border investors monitor dividend translation and the group hedging approach. Supply-chain disruptions can delay milestones and escalate capex and operating costs, while local content policies may reduce FX volatility but constrain vendor flexibility and pricing options.
- FX exposure: affects construction costs and dividend translation
- Hedging: critical for cross-border investor confidence
- Supply-chain: delays raise capex and timetable risk
- Local content: buffers currency swings, limits vendors
Long PPP tolls, FY2024 A$3.1bn; CPI ~4%; election renegotiation risk
Macroeconomic growth (GDP ~2–3% Australia/NA 2024), low unemployment (AU 3.7% 2024) and population gains drive VKT (~95–100% of 2019 by 2024) supporting toll demand; corridor elasticity varies. Capital intensity relies on AUD 18–20bn group debt with 10‑yr yields ~4.2% (AU 2025) raising WACC. CPI indexation (CPI ~4.1% 2024) aids revenue; EVs ~14% new sales 2024 and Brent ~USD83/bbl 2024 shift trip patterns and cost dynamics.
| Metric | Value |
|---|---|
| Group debt | AUD 18–20bn |
| AU 10y | ~4.2% (2025) |
| CPI | 4.1% (2024) |
| EV share | ~14% (2024) |
| Brent | ~USD83/bbl (2024) |
Full Version Awaits
Transurban Group PESTLE Analysis
This Transurban Group PESTLE Analysis preview is the exact document you’ll receive after purchase—fully formatted and ready to use. It delivers concise Political, Economic, Social, Technological, Legal, and Environmental insights tailored to Transurban. The structure is professional and export-ready. No placeholders or surprises—what you see is what you’ll download.











