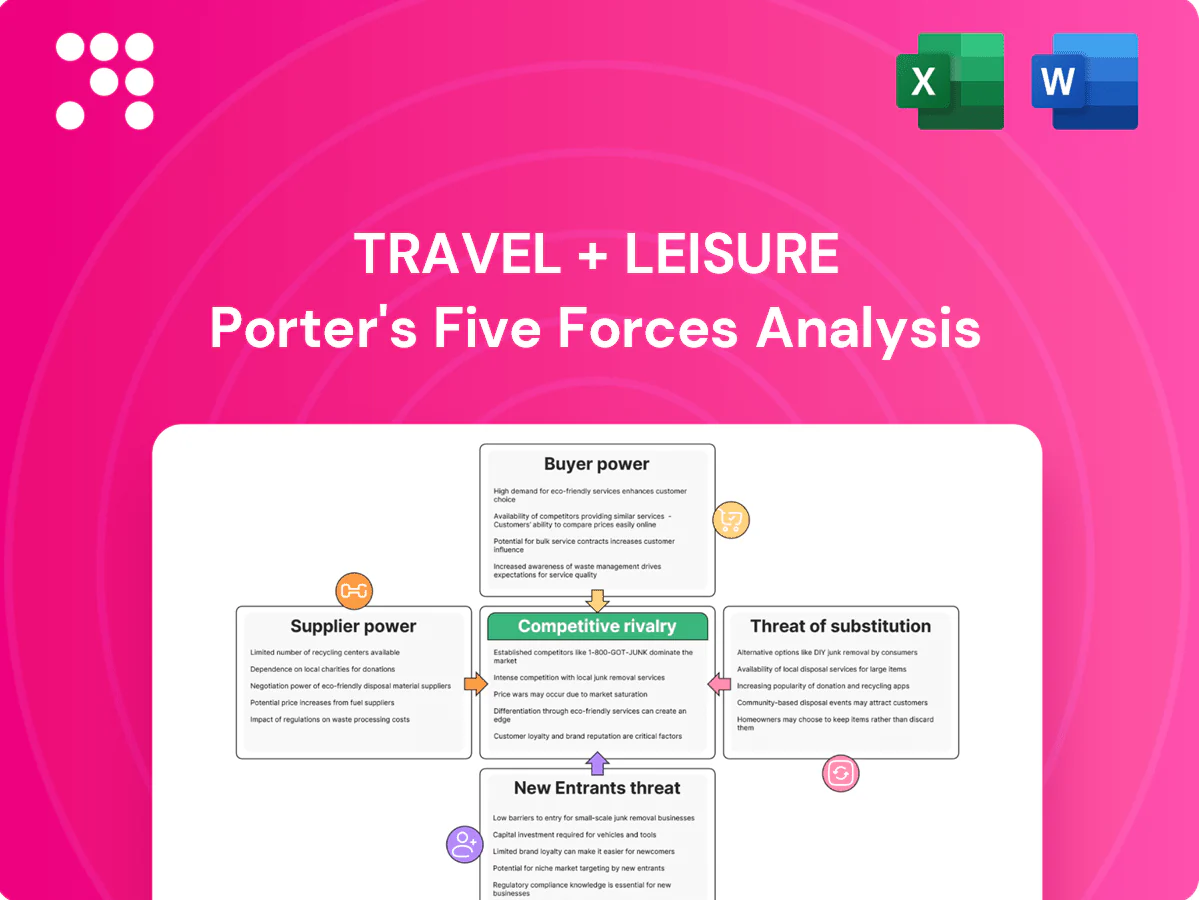
Travel + Leisure Porter's Five Forces Analysis

From Overview to Strategy Blueprint
Travel + Leisure faces moderate buyer power, rising substitute threats from digital platforms, and steady supplier influence amid post-pandemic travel recovery. Competitive rivalry is intense with consolidation and niche disruptors pressuring margins, while barriers to entry remain mixed. This brief snapshot only scratches the surface; unlock the full Porter's Five Forces Analysis for force-by-force ratings, visuals, and actionable strategy.
Suppliers Bargaining Power

Concentrated air and lodging partners
Airlines and large hotel groups are relatively concentrated—top 4 US carriers account for roughly 80% of domestic capacity (2023 DOT) and global airline load factor averaged 82.6% in 2023 (IATA)—so pricing and capacity moves materially affect package economics. Marriott remained the largest chain with ~1.6 million rooms by 2024, limiting alternative lodging swaps. Long-term agreements soften volatility, but peak-season constraints sustain supplier leverage; T+L offsets this with multi-partner networks and diversified destinations.
Real estate developers and HOAs
Vacation ownership depends heavily on developers, property owners and HOAs for inventory and upkeep, making them key suppliers whose renovation cycles and special assessments can raise costs and erode brand standards and guest experience.

Technology platforms and data vendors
RCI, its exchange network of 4,000+ affiliated resorts, and member clubs rely heavily on booking engines, CRM and distribution tech vendors, creating integration and member-data migration costs that make switching expensive. Vendors with proprietary tools can extract higher per-transaction and SaaS fees. Building in-house booking and CRM capabilities reduces dependency, lowers long-term costs and strengthens negotiation leverage.

Marketing and distribution channels
Lead gen via digital platforms, OTAs and co-branded partnerships often command high fees (OTA commissions commonly 15-25%), shifting supplier margins. Algorithmic visibility and paid acquisition costs—with digital ~70% of 2024 travel marketing spend—increase channel owner bargaining power. Direct-to-member marketing and loyalty ecosystems (member bookings ~30% of direct sales) counterbalance reliance, and a multi-channel mix reduces single-partner exposure.
- OTA commissions: 15-25%
- Digital share of travel ad spend 2024: ~70%
- Member/direct booking share: ~30%
- Multi-channel approach lowers single-partner risk
Labor and service providers
- Labor intensity: core operations, housekeeping, call centers
- Employment: ~16.8 million (U.S., 2024)
- Cost impact: labor often 30-40% of resort OPEX
- Mitigation: standardization, regional vendors, cross-training
Concentrated carriers and hotel scale drive pricing power; OTAs and direct bookings rebalance risk
Concentrated suppliers like top-4 US carriers (~80% domestic capacity, 2023 DOT) and Marriott (~1.6M rooms, 2024) wield pricing and capacity leverage; global airline load factor was 82.6% in 2023 (IATA). OTAs extract 15-25% commissions while digital ad share reached ~70% of travel spend in 2024, though direct/member bookings (~30%) and multi-channel distribution reduce single-supplier risk.
| Metric | Value |
|---|---|
| Top-4 US carriers | ~80% capacity (2023) |
| Global load factor | 82.6% (2023) |
| Marriott rooms | ~1.6M (2024) |
| OTA commission | 15-25% |
| Digital ad share | ~70% (2024) |
| Direct/member bookings | ~30% |
| US leisure employment | ~16.8M (2024) |
What is included in the product
 Detailed Word Document
Tailored Porter's Five Forces analysis for Travel + Leisure that uncovers competitive drivers, buyer and supplier power, threat of substitutes and new entrants, and identifies disruptive trends and market entry risks shaping pricing and profitability. Ideal for investor decks, strategy reports, and academic use—fully editable for customization.

 Customizable Excel Spreadsheet
A concise, one-sheet Porter’s Five Forces for Travel + Leisure that instantly highlights competitive pressures and strategic levers—perfect for quick boardroom decisions and investor decks. Customize force intensities and swap data to reflect shifting travel trends or new regulations without any complex tools.
Customers Bargaining Power

Price-sensitive travelers
A 2024 survey found about 75% of leisure travelers compare prices across OTAs, alternative stays and packages, boosting customer bargaining power; Booking Holdings and Expedia still dominate OTA distribution with roughly 60% combined share of gross bookings. Transparent pricing and a 12% rise in promotions Y/Y in 2024 have conditioned buyer expectations, while tiered memberships and value-adds cut price-driven churn by an estimated 8%.
Large member base with switching options
Large member base lets RCI and Travel + Leisure club members churn to alternatives; the US timeshare owner pool is about 9 million, creating ample switching demand. Low switching costs for non-deeded products increase customer leverage. Deeded VO owners face exit frictions, but reputation risks push firms toward customer-centric concessions. Engagement programs and exclusive inventory reduce churn.

Corporate and affinity partners
Corporate and affinity partners negotiating co-branded clubs and enterprise deals exert outsized leverage, with consolidated demand often representing over 50% of T+L’s enterprise channel volume in 2024. Volume discounts and strict service-level requirements push pricing pressure downstream. Performance-based pricing and SLAs transfer booking and fulfillment risk to Travel + Leisure. Long-term contracts stabilize revenue but typically compress margins and reduce pricing flexibility.

Demand for flexibility and transparency
Review platforms and social proof
Ratings on Google, TripAdvisor and app stores heavily shape travel purchases; Google holds about 92% global search market share (StatCounter, 2024), making its reviews especially influential. Negative sentiment spreads fast and erodes pricing power, while active reputation management and consistent service dilute buyer leverage. Member communities can be mobilized to advocate and retain customers.
- Google reviews: platform dominance ~92% (StatCounter 2024)
- Rapid negative sentiment reduces pricing power
- Reputation management + consistent service = lower buyer leverage
- Member communities drive advocacy and retention
High price transparency and OTA dominance raise buyer leverage - 75% comp, ~60% OTA
High price transparency and a 75% comparison rate (2024) plus ~60% OTA booking concentration raise buyer leverage, aided by a 12% Y/Y rise in promotions. Low switching costs for non-deeded products and ~9M US timeshare owners increase churn risk, while corporate partners (50%+ enterprise volume) demand discounts and SLAs. Reputation effects (Google ~92% search share) amplify customer power.
| Metric | 2024 |
|---|---|
| Price comparison rate | 75% |
| OTA share (Bkng+EXPE) | ~60% |
| Promotions Y/Y | +12% |
| US timeshare owners | ~9M |
| Google search share | ~92% |
| Enterprise volume concentration | >50% |
Preview the Actual Deliverable
Travel + Leisure Porter's Five Forces Analysis
This preview is the exact Travel + Leisure Porter’s Five Forces Analysis you’ll receive after purchase—no placeholders or mockups. The file is fully formatted and ready for download and immediate use. Purchase grants instant access to this same professional document.

From Overview to Strategy Blueprint
Travel + Leisure faces moderate buyer power, rising substitute threats from digital platforms, and steady supplier influence amid post-pandemic travel recovery. Competitive rivalry is intense with consolidation and niche disruptors pressuring margins, while barriers to entry remain mixed. This brief snapshot only scratches the surface; unlock the full Porter's Five Forces Analysis for force-by-force ratings, visuals, and actionable strategy.
Suppliers Bargaining Power
Concentrated air and lodging partners
Airlines and large hotel groups are relatively concentrated—top 4 US carriers account for roughly 80% of domestic capacity (2023 DOT) and global airline load factor averaged 82.6% in 2023 (IATA)—so pricing and capacity moves materially affect package economics. Marriott remained the largest chain with ~1.6 million rooms by 2024, limiting alternative lodging swaps. Long-term agreements soften volatility, but peak-season constraints sustain supplier leverage; T+L offsets this with multi-partner networks and diversified destinations.
Real estate developers and HOAs
Vacation ownership depends heavily on developers, property owners and HOAs for inventory and upkeep, making them key suppliers whose renovation cycles and special assessments can raise costs and erode brand standards and guest experience.
Technology platforms and data vendors
RCI, its exchange network of 4,000+ affiliated resorts, and member clubs rely heavily on booking engines, CRM and distribution tech vendors, creating integration and member-data migration costs that make switching expensive. Vendors with proprietary tools can extract higher per-transaction and SaaS fees. Building in-house booking and CRM capabilities reduces dependency, lowers long-term costs and strengthens negotiation leverage.
Marketing and distribution channels
Lead gen via digital platforms, OTAs and co-branded partnerships often command high fees (OTA commissions commonly 15-25%), shifting supplier margins. Algorithmic visibility and paid acquisition costs—with digital ~70% of 2024 travel marketing spend—increase channel owner bargaining power. Direct-to-member marketing and loyalty ecosystems (member bookings ~30% of direct sales) counterbalance reliance, and a multi-channel mix reduces single-partner exposure.
- OTA commissions: 15-25%
- Digital share of travel ad spend 2024: ~70%
- Member/direct booking share: ~30%
- Multi-channel approach lowers single-partner risk
Labor and service providers
- Labor intensity: core operations, housekeeping, call centers
- Employment: ~16.8 million (U.S., 2024)
- Cost impact: labor often 30-40% of resort OPEX
- Mitigation: standardization, regional vendors, cross-training
Concentrated carriers and hotel scale drive pricing power; OTAs and direct bookings rebalance risk
Concentrated suppliers like top-4 US carriers (~80% domestic capacity, 2023 DOT) and Marriott (~1.6M rooms, 2024) wield pricing and capacity leverage; global airline load factor was 82.6% in 2023 (IATA). OTAs extract 15-25% commissions while digital ad share reached ~70% of travel spend in 2024, though direct/member bookings (~30%) and multi-channel distribution reduce single-supplier risk.
| Metric | Value |
|---|---|
| Top-4 US carriers | ~80% capacity (2023) |
| Global load factor | 82.6% (2023) |
| Marriott rooms | ~1.6M (2024) |
| OTA commission | 15-25% |
| Digital ad share | ~70% (2024) |
| Direct/member bookings | ~30% |
| US leisure employment | ~16.8M (2024) |
What is included in the product
Detailed Word Document
Tailored Porter's Five Forces analysis for Travel + Leisure that uncovers competitive drivers, buyer and supplier power, threat of substitutes and new entrants, and identifies disruptive trends and market entry risks shaping pricing and profitability. Ideal for investor decks, strategy reports, and academic use—fully editable for customization.
Customizable Excel Spreadsheet
A concise, one-sheet Porter’s Five Forces for Travel + Leisure that instantly highlights competitive pressures and strategic levers—perfect for quick boardroom decisions and investor decks. Customize force intensities and swap data to reflect shifting travel trends or new regulations without any complex tools.
Customers Bargaining Power
Price-sensitive travelers
A 2024 survey found about 75% of leisure travelers compare prices across OTAs, alternative stays and packages, boosting customer bargaining power; Booking Holdings and Expedia still dominate OTA distribution with roughly 60% combined share of gross bookings. Transparent pricing and a 12% rise in promotions Y/Y in 2024 have conditioned buyer expectations, while tiered memberships and value-adds cut price-driven churn by an estimated 8%.
Large member base with switching options
Large member base lets RCI and Travel + Leisure club members churn to alternatives; the US timeshare owner pool is about 9 million, creating ample switching demand. Low switching costs for non-deeded products increase customer leverage. Deeded VO owners face exit frictions, but reputation risks push firms toward customer-centric concessions. Engagement programs and exclusive inventory reduce churn.
Corporate and affinity partners
Corporate and affinity partners negotiating co-branded clubs and enterprise deals exert outsized leverage, with consolidated demand often representing over 50% of T+L’s enterprise channel volume in 2024. Volume discounts and strict service-level requirements push pricing pressure downstream. Performance-based pricing and SLAs transfer booking and fulfillment risk to Travel + Leisure. Long-term contracts stabilize revenue but typically compress margins and reduce pricing flexibility.
Demand for flexibility and transparency
Review platforms and social proof
Ratings on Google, TripAdvisor and app stores heavily shape travel purchases; Google holds about 92% global search market share (StatCounter, 2024), making its reviews especially influential. Negative sentiment spreads fast and erodes pricing power, while active reputation management and consistent service dilute buyer leverage. Member communities can be mobilized to advocate and retain customers.
- Google reviews: platform dominance ~92% (StatCounter 2024)
- Rapid negative sentiment reduces pricing power
- Reputation management + consistent service = lower buyer leverage
- Member communities drive advocacy and retention
High price transparency and OTA dominance raise buyer leverage - 75% comp, ~60% OTA
High price transparency and a 75% comparison rate (2024) plus ~60% OTA booking concentration raise buyer leverage, aided by a 12% Y/Y rise in promotions. Low switching costs for non-deeded products and ~9M US timeshare owners increase churn risk, while corporate partners (50%+ enterprise volume) demand discounts and SLAs. Reputation effects (Google ~92% search share) amplify customer power.
| Metric | 2024 |
|---|---|
| Price comparison rate | 75% |
| OTA share (Bkng+EXPE) | ~60% |
| Promotions Y/Y | +12% |
| US timeshare owners | ~9M |
| Google search share | ~92% |
| Enterprise volume concentration | >50% |
Preview the Actual Deliverable
Travel + Leisure Porter's Five Forces Analysis
This preview is the exact Travel + Leisure Porter’s Five Forces Analysis you’ll receive after purchase—no placeholders or mockups. The file is fully formatted and ready for download and immediate use. Purchase grants instant access to this same professional document.
Original: $10.00
-65%$10.00
$3.50Description
From Overview to Strategy Blueprint
Travel + Leisure faces moderate buyer power, rising substitute threats from digital platforms, and steady supplier influence amid post-pandemic travel recovery. Competitive rivalry is intense with consolidation and niche disruptors pressuring margins, while barriers to entry remain mixed. This brief snapshot only scratches the surface; unlock the full Porter's Five Forces Analysis for force-by-force ratings, visuals, and actionable strategy.
Suppliers Bargaining Power
Concentrated air and lodging partners
Airlines and large hotel groups are relatively concentrated—top 4 US carriers account for roughly 80% of domestic capacity (2023 DOT) and global airline load factor averaged 82.6% in 2023 (IATA)—so pricing and capacity moves materially affect package economics. Marriott remained the largest chain with ~1.6 million rooms by 2024, limiting alternative lodging swaps. Long-term agreements soften volatility, but peak-season constraints sustain supplier leverage; T+L offsets this with multi-partner networks and diversified destinations.
Real estate developers and HOAs
Vacation ownership depends heavily on developers, property owners and HOAs for inventory and upkeep, making them key suppliers whose renovation cycles and special assessments can raise costs and erode brand standards and guest experience.
Technology platforms and data vendors
RCI, its exchange network of 4,000+ affiliated resorts, and member clubs rely heavily on booking engines, CRM and distribution tech vendors, creating integration and member-data migration costs that make switching expensive. Vendors with proprietary tools can extract higher per-transaction and SaaS fees. Building in-house booking and CRM capabilities reduces dependency, lowers long-term costs and strengthens negotiation leverage.
Marketing and distribution channels
Lead gen via digital platforms, OTAs and co-branded partnerships often command high fees (OTA commissions commonly 15-25%), shifting supplier margins. Algorithmic visibility and paid acquisition costs—with digital ~70% of 2024 travel marketing spend—increase channel owner bargaining power. Direct-to-member marketing and loyalty ecosystems (member bookings ~30% of direct sales) counterbalance reliance, and a multi-channel mix reduces single-partner exposure.
- OTA commissions: 15-25%
- Digital share of travel ad spend 2024: ~70%
- Member/direct booking share: ~30%
- Multi-channel approach lowers single-partner risk
Labor and service providers
- Labor intensity: core operations, housekeeping, call centers
- Employment: ~16.8 million (U.S., 2024)
- Cost impact: labor often 30-40% of resort OPEX
- Mitigation: standardization, regional vendors, cross-training
Concentrated carriers and hotel scale drive pricing power; OTAs and direct bookings rebalance risk
Concentrated suppliers like top-4 US carriers (~80% domestic capacity, 2023 DOT) and Marriott (~1.6M rooms, 2024) wield pricing and capacity leverage; global airline load factor was 82.6% in 2023 (IATA). OTAs extract 15-25% commissions while digital ad share reached ~70% of travel spend in 2024, though direct/member bookings (~30%) and multi-channel distribution reduce single-supplier risk.
| Metric | Value |
|---|---|
| Top-4 US carriers | ~80% capacity (2023) |
| Global load factor | 82.6% (2023) |
| Marriott rooms | ~1.6M (2024) |
| OTA commission | 15-25% |
| Digital ad share | ~70% (2024) |
| Direct/member bookings | ~30% |
| US leisure employment | ~16.8M (2024) |
What is included in the product
Detailed Word Document
Tailored Porter's Five Forces analysis for Travel + Leisure that uncovers competitive drivers, buyer and supplier power, threat of substitutes and new entrants, and identifies disruptive trends and market entry risks shaping pricing and profitability. Ideal for investor decks, strategy reports, and academic use—fully editable for customization.
Customizable Excel Spreadsheet
A concise, one-sheet Porter’s Five Forces for Travel + Leisure that instantly highlights competitive pressures and strategic levers—perfect for quick boardroom decisions and investor decks. Customize force intensities and swap data to reflect shifting travel trends or new regulations without any complex tools.
Customers Bargaining Power
Price-sensitive travelers
A 2024 survey found about 75% of leisure travelers compare prices across OTAs, alternative stays and packages, boosting customer bargaining power; Booking Holdings and Expedia still dominate OTA distribution with roughly 60% combined share of gross bookings. Transparent pricing and a 12% rise in promotions Y/Y in 2024 have conditioned buyer expectations, while tiered memberships and value-adds cut price-driven churn by an estimated 8%.
Large member base with switching options
Large member base lets RCI and Travel + Leisure club members churn to alternatives; the US timeshare owner pool is about 9 million, creating ample switching demand. Low switching costs for non-deeded products increase customer leverage. Deeded VO owners face exit frictions, but reputation risks push firms toward customer-centric concessions. Engagement programs and exclusive inventory reduce churn.
Corporate and affinity partners
Corporate and affinity partners negotiating co-branded clubs and enterprise deals exert outsized leverage, with consolidated demand often representing over 50% of T+L’s enterprise channel volume in 2024. Volume discounts and strict service-level requirements push pricing pressure downstream. Performance-based pricing and SLAs transfer booking and fulfillment risk to Travel + Leisure. Long-term contracts stabilize revenue but typically compress margins and reduce pricing flexibility.
Demand for flexibility and transparency
Review platforms and social proof
Ratings on Google, TripAdvisor and app stores heavily shape travel purchases; Google holds about 92% global search market share (StatCounter, 2024), making its reviews especially influential. Negative sentiment spreads fast and erodes pricing power, while active reputation management and consistent service dilute buyer leverage. Member communities can be mobilized to advocate and retain customers.
- Google reviews: platform dominance ~92% (StatCounter 2024)
- Rapid negative sentiment reduces pricing power
- Reputation management + consistent service = lower buyer leverage
- Member communities drive advocacy and retention
High price transparency and OTA dominance raise buyer leverage - 75% comp, ~60% OTA
High price transparency and a 75% comparison rate (2024) plus ~60% OTA booking concentration raise buyer leverage, aided by a 12% Y/Y rise in promotions. Low switching costs for non-deeded products and ~9M US timeshare owners increase churn risk, while corporate partners (50%+ enterprise volume) demand discounts and SLAs. Reputation effects (Google ~92% search share) amplify customer power.
| Metric | 2024 |
|---|---|
| Price comparison rate | 75% |
| OTA share (Bkng+EXPE) | ~60% |
| Promotions Y/Y | +12% |
| US timeshare owners | ~9M |
| Google search share | ~92% |
| Enterprise volume concentration | >50% |
Preview the Actual Deliverable
Travel + Leisure Porter's Five Forces Analysis
This preview is the exact Travel + Leisure Porter’s Five Forces Analysis you’ll receive after purchase—no placeholders or mockups. The file is fully formatted and ready for download and immediate use. Purchase grants instant access to this same professional document.











