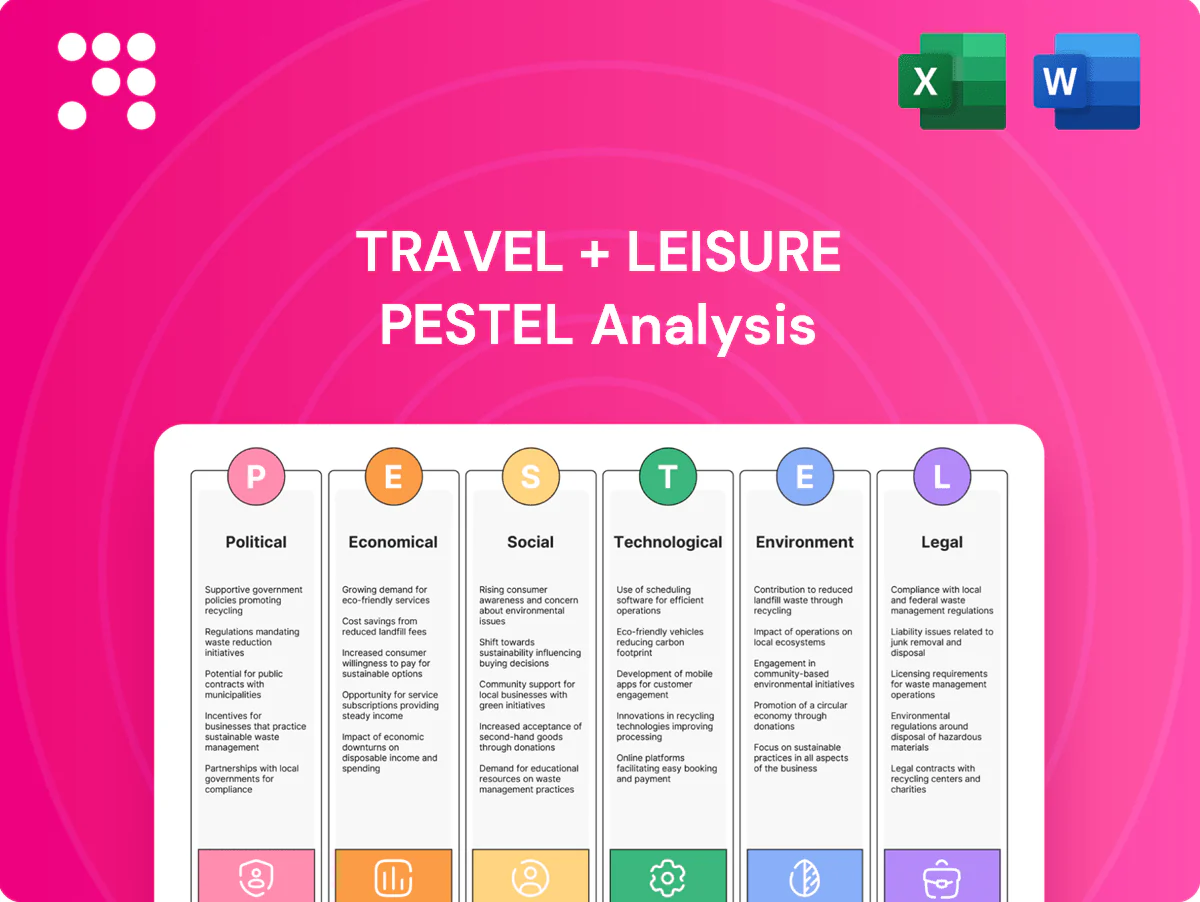
Travel + Leisure PESTLE Analysis

Make Smarter Strategic Decisions with a Complete PESTEL View
Unlock actionable insights with our PESTLE analysis of Travel + Leisure—concise coverage of political, economic, social, technological, legal and environmental forces shaping its outlook. Understand regulatory risks, demand shifts, and tech-driven opportunities to inform investment and strategy. Purchase the full report for the complete, editable breakdown and start making smarter decisions today.
Political factors

Visa regimes and border policies
Shifts in visa requirements, eTA/ESTA rules and biometric border controls directly reshape flows to resorts and exchange networks — UNWTO recorded about 1.4 billion international tourist arrivals in 2023, underscoring sensitivity to entry rules. Easing policies boost inbound leisure travel while restrictions or long processing times suppress bookings. T+L must reallocate marketing and inventory to corridors with favorable entry regimes. Partnerships with visa-waiver destinations can accelerate club uptake.
Geopolitical tensions and regional stability
Conflicts, sanctions and diplomatic rifts can abruptly curtail travel to affected regions and disrupt exchange networks, shifting demand to perceived-safe substitutes and pressuring occupancy and pricing; UNWTO reported 2023 arrivals recovered to about 84% of 2019 levels, underscoring uneven recovery. Diversified geographic inventory mitigates concentration risk, while scenario planning and flexible exchange options help retain members during shocks.

Tourism promotion and public subsidies
National and local tourism boards fund campaigns, route incentives, and infrastructure that elevate destination appeal; UNWTO reported international arrivals at about 88% of 2019 levels in 2023, underscoring recovery momentum that marketing can amplify.
Alignment with promoted corridors can lift member redemptions and new-owner sales, while resort development often benefits from tax holidays or grants lasting several years, materially improving project IRRs.
Monitoring policy calendars helps time launches and club offers to coincide with peak subsidy windows and route incentive rounds.

Public health policy and emergency response
Public health policies—quarantine rules, vaccine mandates and WHO/IHR protocols—alter travel friction and demand elasticity; UNWTO reports 2024 international arrivals at about 95% of 2019 levels.
Rapid compliance and clear communication preserve membership trust; WHO ended the COVID-19 emergency on 5 May 2023, shifting focus to readiness. Flexible cancellations and insurance tie-ins reduce churn, while governments’ preparedness (GHS Index avg ~38.9/100) should inform inventory allocation and seasonality planning.
- Quarantine rules: increase marginal travel cost and reduce short‑notice bookings
- Vaccination mandates: few remain, but raise demand friction when applied
- WHO/IHR: protocols shape cross-border reopening timing
- Preparedness (GHS ~38.9): guides regional inventory and pricing
Taxation on travel and property
Bed taxes and resort fees, often adding 3–15% to room rates, plus property taxes, compress effective pricing and margins for operators; cross-border VAT/GST differences (for example Germany 19%, Spain 21%) also alter net club and exchange fees. Changes in timeshare tax treatment—treated as real property versus service in some jurisdictions—can materially affect buyer value perception and financing availability. Advocacy for transparent fee disclosure has reduced regulatory action in several markets.
- Bed taxes/resort fees: 3–15% impact on pricing
- Property tax: direct margin pressure
- VAT/GST: example Germany 19% / Spain 21%
- Timeshare tax classification: affects financing and buyer value
- Transparent fees + industry advocacy: lower political scrutiny
Visa, health rules and taxes steer short-term travel; UNWTO 2024 arrivals ~95% of 2019
Visa/entry rules, sanctions and route incentives drive short-term flows; UNWTO 2024 arrivals ~95% of 2019. Public-health rules and GHS avg ~38.9 raise operational friction; WHO ended emergency 5 May 2023. Taxes/fees (bed fees 3–15%; VAT Germany 19% Spain 21%) and timeshare tax treatment affect pricing, margins and financing. Policy timing and destination partnerships materially shift redemptions.
| Metric | Value |
|---|---|
| UNWTO arrivals 2024 | ~95% of 2019 |
| GHS Index avg | ~38.9 |
| Bed taxes | 3–15% |
| VAT examples | Germany 19% / Spain 21% |
What is included in the product
 Detailed Word Document
Explores how Political, Economic, Social, Technological, Environmental and Legal forces specifically affect Travel + Leisure, with data-backed trends and region-specific examples to identify risks and growth opportunities; formatted for direct inclusion in business plans, decks, or strategy reports.

 Customizable Excel Spreadsheet
A concise Travel + Leisure PESTLE summary, visually segmented by category for quick interpretation, easily dropped into presentations or shared across teams, and editable for region- or business-specific notes to streamline strategic planning.
Economic factors

Consumer discretionary cycles
Leisure spend is highly pro-cyclical; downturns sharply reduce new vacation-ownership sales and club upgrades, while expansions boost upsell opportunities as consumer confidence rises. Recurring dues and exchange fees, which can comprise roughly 40–60% of owner-derived revenue, stabilize cash flow through cycles. Value messaging and flexible financing (longer terms, lower down payments) have been shown to cushion demand in weaker periods.
Interest rates and financing costs
VOI purchases often rely on consumer financing, and with the US policy rate near 5.25–5.50% (mid-2025) and 30-year mortgage rates around 6.7–7.0%, higher rates have reduced affordability and close rates. Corporate borrowing costs and wider ABS spreads (roughly +150–250 bps vs swaps in recent cycles) raise development and inventory carrying costs. Hedging and terming-out debt have protected margins through rate volatility, while promotions with low-APR partners (0–6% offers) help sustain sales velocity.

Inflation and travel input costs
Rising airfares, fuel and labor costs—with fuel representing roughly 20% of airline operating costs per IATA reports—plus higher utilities are pushing total trip prices and can suppress visit frequency. Cost inflation is squeezing resort operations and HOA budgets, raising owner dues and maintenance spend. Dynamic pricing and productivity programs have protected unit economics, while clear communication of bundled value versus pay-as-you-go vacations improves retention.

Foreign exchange volatility
Foreign exchange volatility poses translation and transaction risk for travel and leisure firms with multi-currency revenues and costs; BIS reported daily FX turnover of about $7.5 trillion in 2022, amplifying rapid swings that can alter destination attractiveness as tourism recovered to roughly 85% of 2019 levels (UNWTO, 2023). Natural hedges via local expenses and active financial hedging, plus intra-platform pricing rules, smooth member experience across currencies.
- Translation/transaction risk
- FX alters demand by source market
- Natural hedges + derivatives reduce volatility
- Pricing rules preserve UX across currencies
Employment and wage trends
Tight labor markets (US unemployment ~3.7% in 2024) lifted wages in housekeeping, F&B and activities, with leisure & hospitality average hourly earnings up about 5% YoY in 2024; payrolls represent roughly 30–40% of hotel operating costs. Service quality and staffing drive NPS and renewal; automation and cross‑training offset wage pressure while local hiring programs boost community relations and resiliency.
- Tight labor: US unemployment ~3.7% (2024)
- Wage growth: leisure & hospitality ≈+5% YoY (2024)
- Labor share: ~30–40% of hotel ops costs
- Mitigants: automation, cross‑training, local hiring
Visa, health rules and taxes steer short-term travel; UNWTO 2024 arrivals ~95% of 2019
Leisure spend is pro‑cyclical; owner dues (≈40–60% of owner revenue) stabilize cashflow while higher policy rates (5.25–5.50% mid‑2025) and 30y mortgage ~6.8% weigh on VOI affordability. Cost inflation (fuel ~20% airline ops; wage growth ≈+5% YoY; unemployment ~3.7% 2024) raises operating costs; FX volatility (daily turnover ~$7.5T) and wider ABS spreads (+150–250bps) increase financing and translation risk.
| Metric | Value |
|---|---|
| Policy rate | 5.25–5.50% |
| 30y mortgage | ~6.8% |
| Owner dues | 40–60% |
| Unemployment (US) | ~3.7% (2024) |
Preview the Actual Deliverable
Travel + Leisure PESTLE Analysis
The preview shown here is the exact Travel + Leisure PESTLE Analysis you’ll receive after purchase—fully formatted, professionally structured, and ready to use. It contains the complete political, economic, social, technological, legal, and environmental assessment as displayed—no placeholders or teasers. After checkout you’ll download this same final document immediately, with content and layout exactly as seen.

Make Smarter Strategic Decisions with a Complete PESTEL View
Unlock actionable insights with our PESTLE analysis of Travel + Leisure—concise coverage of political, economic, social, technological, legal and environmental forces shaping its outlook. Understand regulatory risks, demand shifts, and tech-driven opportunities to inform investment and strategy. Purchase the full report for the complete, editable breakdown and start making smarter decisions today.
Political factors
Visa regimes and border policies
Shifts in visa requirements, eTA/ESTA rules and biometric border controls directly reshape flows to resorts and exchange networks — UNWTO recorded about 1.4 billion international tourist arrivals in 2023, underscoring sensitivity to entry rules. Easing policies boost inbound leisure travel while restrictions or long processing times suppress bookings. T+L must reallocate marketing and inventory to corridors with favorable entry regimes. Partnerships with visa-waiver destinations can accelerate club uptake.
Geopolitical tensions and regional stability
Conflicts, sanctions and diplomatic rifts can abruptly curtail travel to affected regions and disrupt exchange networks, shifting demand to perceived-safe substitutes and pressuring occupancy and pricing; UNWTO reported 2023 arrivals recovered to about 84% of 2019 levels, underscoring uneven recovery. Diversified geographic inventory mitigates concentration risk, while scenario planning and flexible exchange options help retain members during shocks.
Tourism promotion and public subsidies
National and local tourism boards fund campaigns, route incentives, and infrastructure that elevate destination appeal; UNWTO reported international arrivals at about 88% of 2019 levels in 2023, underscoring recovery momentum that marketing can amplify.
Alignment with promoted corridors can lift member redemptions and new-owner sales, while resort development often benefits from tax holidays or grants lasting several years, materially improving project IRRs.
Monitoring policy calendars helps time launches and club offers to coincide with peak subsidy windows and route incentive rounds.
Public health policy and emergency response
Public health policies—quarantine rules, vaccine mandates and WHO/IHR protocols—alter travel friction and demand elasticity; UNWTO reports 2024 international arrivals at about 95% of 2019 levels.
Rapid compliance and clear communication preserve membership trust; WHO ended the COVID-19 emergency on 5 May 2023, shifting focus to readiness. Flexible cancellations and insurance tie-ins reduce churn, while governments’ preparedness (GHS Index avg ~38.9/100) should inform inventory allocation and seasonality planning.
- Quarantine rules: increase marginal travel cost and reduce short‑notice bookings
- Vaccination mandates: few remain, but raise demand friction when applied
- WHO/IHR: protocols shape cross-border reopening timing
- Preparedness (GHS ~38.9): guides regional inventory and pricing
Taxation on travel and property
Bed taxes and resort fees, often adding 3–15% to room rates, plus property taxes, compress effective pricing and margins for operators; cross-border VAT/GST differences (for example Germany 19%, Spain 21%) also alter net club and exchange fees. Changes in timeshare tax treatment—treated as real property versus service in some jurisdictions—can materially affect buyer value perception and financing availability. Advocacy for transparent fee disclosure has reduced regulatory action in several markets.
- Bed taxes/resort fees: 3–15% impact on pricing
- Property tax: direct margin pressure
- VAT/GST: example Germany 19% / Spain 21%
- Timeshare tax classification: affects financing and buyer value
- Transparent fees + industry advocacy: lower political scrutiny
Visa, health rules and taxes steer short-term travel; UNWTO 2024 arrivals ~95% of 2019
Visa/entry rules, sanctions and route incentives drive short-term flows; UNWTO 2024 arrivals ~95% of 2019. Public-health rules and GHS avg ~38.9 raise operational friction; WHO ended emergency 5 May 2023. Taxes/fees (bed fees 3–15%; VAT Germany 19% Spain 21%) and timeshare tax treatment affect pricing, margins and financing. Policy timing and destination partnerships materially shift redemptions.
| Metric | Value |
|---|---|
| UNWTO arrivals 2024 | ~95% of 2019 |
| GHS Index avg | ~38.9 |
| Bed taxes | 3–15% |
| VAT examples | Germany 19% / Spain 21% |
What is included in the product
Detailed Word Document
Explores how Political, Economic, Social, Technological, Environmental and Legal forces specifically affect Travel + Leisure, with data-backed trends and region-specific examples to identify risks and growth opportunities; formatted for direct inclusion in business plans, decks, or strategy reports.
Customizable Excel Spreadsheet
A concise Travel + Leisure PESTLE summary, visually segmented by category for quick interpretation, easily dropped into presentations or shared across teams, and editable for region- or business-specific notes to streamline strategic planning.
Economic factors
Consumer discretionary cycles
Leisure spend is highly pro-cyclical; downturns sharply reduce new vacation-ownership sales and club upgrades, while expansions boost upsell opportunities as consumer confidence rises. Recurring dues and exchange fees, which can comprise roughly 40–60% of owner-derived revenue, stabilize cash flow through cycles. Value messaging and flexible financing (longer terms, lower down payments) have been shown to cushion demand in weaker periods.
Interest rates and financing costs
VOI purchases often rely on consumer financing, and with the US policy rate near 5.25–5.50% (mid-2025) and 30-year mortgage rates around 6.7–7.0%, higher rates have reduced affordability and close rates. Corporate borrowing costs and wider ABS spreads (roughly +150–250 bps vs swaps in recent cycles) raise development and inventory carrying costs. Hedging and terming-out debt have protected margins through rate volatility, while promotions with low-APR partners (0–6% offers) help sustain sales velocity.
Inflation and travel input costs
Rising airfares, fuel and labor costs—with fuel representing roughly 20% of airline operating costs per IATA reports—plus higher utilities are pushing total trip prices and can suppress visit frequency. Cost inflation is squeezing resort operations and HOA budgets, raising owner dues and maintenance spend. Dynamic pricing and productivity programs have protected unit economics, while clear communication of bundled value versus pay-as-you-go vacations improves retention.
Foreign exchange volatility
Foreign exchange volatility poses translation and transaction risk for travel and leisure firms with multi-currency revenues and costs; BIS reported daily FX turnover of about $7.5 trillion in 2022, amplifying rapid swings that can alter destination attractiveness as tourism recovered to roughly 85% of 2019 levels (UNWTO, 2023). Natural hedges via local expenses and active financial hedging, plus intra-platform pricing rules, smooth member experience across currencies.
- Translation/transaction risk
- FX alters demand by source market
- Natural hedges + derivatives reduce volatility
- Pricing rules preserve UX across currencies
Employment and wage trends
Tight labor markets (US unemployment ~3.7% in 2024) lifted wages in housekeeping, F&B and activities, with leisure & hospitality average hourly earnings up about 5% YoY in 2024; payrolls represent roughly 30–40% of hotel operating costs. Service quality and staffing drive NPS and renewal; automation and cross‑training offset wage pressure while local hiring programs boost community relations and resiliency.
- Tight labor: US unemployment ~3.7% (2024)
- Wage growth: leisure & hospitality ≈+5% YoY (2024)
- Labor share: ~30–40% of hotel ops costs
- Mitigants: automation, cross‑training, local hiring
Visa, health rules and taxes steer short-term travel; UNWTO 2024 arrivals ~95% of 2019
Leisure spend is pro‑cyclical; owner dues (≈40–60% of owner revenue) stabilize cashflow while higher policy rates (5.25–5.50% mid‑2025) and 30y mortgage ~6.8% weigh on VOI affordability. Cost inflation (fuel ~20% airline ops; wage growth ≈+5% YoY; unemployment ~3.7% 2024) raises operating costs; FX volatility (daily turnover ~$7.5T) and wider ABS spreads (+150–250bps) increase financing and translation risk.
| Metric | Value |
|---|---|
| Policy rate | 5.25–5.50% |
| 30y mortgage | ~6.8% |
| Owner dues | 40–60% |
| Unemployment (US) | ~3.7% (2024) |
Preview the Actual Deliverable
Travel + Leisure PESTLE Analysis
The preview shown here is the exact Travel + Leisure PESTLE Analysis you’ll receive after purchase—fully formatted, professionally structured, and ready to use. It contains the complete political, economic, social, technological, legal, and environmental assessment as displayed—no placeholders or teasers. After checkout you’ll download this same final document immediately, with content and layout exactly as seen.
Original: $10.00
-65%$10.00
$3.50Description
Make Smarter Strategic Decisions with a Complete PESTEL View
Unlock actionable insights with our PESTLE analysis of Travel + Leisure—concise coverage of political, economic, social, technological, legal and environmental forces shaping its outlook. Understand regulatory risks, demand shifts, and tech-driven opportunities to inform investment and strategy. Purchase the full report for the complete, editable breakdown and start making smarter decisions today.
Political factors
Visa regimes and border policies
Shifts in visa requirements, eTA/ESTA rules and biometric border controls directly reshape flows to resorts and exchange networks — UNWTO recorded about 1.4 billion international tourist arrivals in 2023, underscoring sensitivity to entry rules. Easing policies boost inbound leisure travel while restrictions or long processing times suppress bookings. T+L must reallocate marketing and inventory to corridors with favorable entry regimes. Partnerships with visa-waiver destinations can accelerate club uptake.
Geopolitical tensions and regional stability
Conflicts, sanctions and diplomatic rifts can abruptly curtail travel to affected regions and disrupt exchange networks, shifting demand to perceived-safe substitutes and pressuring occupancy and pricing; UNWTO reported 2023 arrivals recovered to about 84% of 2019 levels, underscoring uneven recovery. Diversified geographic inventory mitigates concentration risk, while scenario planning and flexible exchange options help retain members during shocks.
Tourism promotion and public subsidies
National and local tourism boards fund campaigns, route incentives, and infrastructure that elevate destination appeal; UNWTO reported international arrivals at about 88% of 2019 levels in 2023, underscoring recovery momentum that marketing can amplify.
Alignment with promoted corridors can lift member redemptions and new-owner sales, while resort development often benefits from tax holidays or grants lasting several years, materially improving project IRRs.
Monitoring policy calendars helps time launches and club offers to coincide with peak subsidy windows and route incentive rounds.
Public health policy and emergency response
Public health policies—quarantine rules, vaccine mandates and WHO/IHR protocols—alter travel friction and demand elasticity; UNWTO reports 2024 international arrivals at about 95% of 2019 levels.
Rapid compliance and clear communication preserve membership trust; WHO ended the COVID-19 emergency on 5 May 2023, shifting focus to readiness. Flexible cancellations and insurance tie-ins reduce churn, while governments’ preparedness (GHS Index avg ~38.9/100) should inform inventory allocation and seasonality planning.
- Quarantine rules: increase marginal travel cost and reduce short‑notice bookings
- Vaccination mandates: few remain, but raise demand friction when applied
- WHO/IHR: protocols shape cross-border reopening timing
- Preparedness (GHS ~38.9): guides regional inventory and pricing
Taxation on travel and property
Bed taxes and resort fees, often adding 3–15% to room rates, plus property taxes, compress effective pricing and margins for operators; cross-border VAT/GST differences (for example Germany 19%, Spain 21%) also alter net club and exchange fees. Changes in timeshare tax treatment—treated as real property versus service in some jurisdictions—can materially affect buyer value perception and financing availability. Advocacy for transparent fee disclosure has reduced regulatory action in several markets.
- Bed taxes/resort fees: 3–15% impact on pricing
- Property tax: direct margin pressure
- VAT/GST: example Germany 19% / Spain 21%
- Timeshare tax classification: affects financing and buyer value
- Transparent fees + industry advocacy: lower political scrutiny
Visa, health rules and taxes steer short-term travel; UNWTO 2024 arrivals ~95% of 2019
Visa/entry rules, sanctions and route incentives drive short-term flows; UNWTO 2024 arrivals ~95% of 2019. Public-health rules and GHS avg ~38.9 raise operational friction; WHO ended emergency 5 May 2023. Taxes/fees (bed fees 3–15%; VAT Germany 19% Spain 21%) and timeshare tax treatment affect pricing, margins and financing. Policy timing and destination partnerships materially shift redemptions.
| Metric | Value |
|---|---|
| UNWTO arrivals 2024 | ~95% of 2019 |
| GHS Index avg | ~38.9 |
| Bed taxes | 3–15% |
| VAT examples | Germany 19% / Spain 21% |
What is included in the product
Detailed Word Document
Explores how Political, Economic, Social, Technological, Environmental and Legal forces specifically affect Travel + Leisure, with data-backed trends and region-specific examples to identify risks and growth opportunities; formatted for direct inclusion in business plans, decks, or strategy reports.
Customizable Excel Spreadsheet
A concise Travel + Leisure PESTLE summary, visually segmented by category for quick interpretation, easily dropped into presentations or shared across teams, and editable for region- or business-specific notes to streamline strategic planning.
Economic factors
Consumer discretionary cycles
Leisure spend is highly pro-cyclical; downturns sharply reduce new vacation-ownership sales and club upgrades, while expansions boost upsell opportunities as consumer confidence rises. Recurring dues and exchange fees, which can comprise roughly 40–60% of owner-derived revenue, stabilize cash flow through cycles. Value messaging and flexible financing (longer terms, lower down payments) have been shown to cushion demand in weaker periods.
Interest rates and financing costs
VOI purchases often rely on consumer financing, and with the US policy rate near 5.25–5.50% (mid-2025) and 30-year mortgage rates around 6.7–7.0%, higher rates have reduced affordability and close rates. Corporate borrowing costs and wider ABS spreads (roughly +150–250 bps vs swaps in recent cycles) raise development and inventory carrying costs. Hedging and terming-out debt have protected margins through rate volatility, while promotions with low-APR partners (0–6% offers) help sustain sales velocity.
Inflation and travel input costs
Rising airfares, fuel and labor costs—with fuel representing roughly 20% of airline operating costs per IATA reports—plus higher utilities are pushing total trip prices and can suppress visit frequency. Cost inflation is squeezing resort operations and HOA budgets, raising owner dues and maintenance spend. Dynamic pricing and productivity programs have protected unit economics, while clear communication of bundled value versus pay-as-you-go vacations improves retention.
Foreign exchange volatility
Foreign exchange volatility poses translation and transaction risk for travel and leisure firms with multi-currency revenues and costs; BIS reported daily FX turnover of about $7.5 trillion in 2022, amplifying rapid swings that can alter destination attractiveness as tourism recovered to roughly 85% of 2019 levels (UNWTO, 2023). Natural hedges via local expenses and active financial hedging, plus intra-platform pricing rules, smooth member experience across currencies.
- Translation/transaction risk
- FX alters demand by source market
- Natural hedges + derivatives reduce volatility
- Pricing rules preserve UX across currencies
Employment and wage trends
Tight labor markets (US unemployment ~3.7% in 2024) lifted wages in housekeeping, F&B and activities, with leisure & hospitality average hourly earnings up about 5% YoY in 2024; payrolls represent roughly 30–40% of hotel operating costs. Service quality and staffing drive NPS and renewal; automation and cross‑training offset wage pressure while local hiring programs boost community relations and resiliency.
- Tight labor: US unemployment ~3.7% (2024)
- Wage growth: leisure & hospitality ≈+5% YoY (2024)
- Labor share: ~30–40% of hotel ops costs
- Mitigants: automation, cross‑training, local hiring
Visa, health rules and taxes steer short-term travel; UNWTO 2024 arrivals ~95% of 2019
Leisure spend is pro‑cyclical; owner dues (≈40–60% of owner revenue) stabilize cashflow while higher policy rates (5.25–5.50% mid‑2025) and 30y mortgage ~6.8% weigh on VOI affordability. Cost inflation (fuel ~20% airline ops; wage growth ≈+5% YoY; unemployment ~3.7% 2024) raises operating costs; FX volatility (daily turnover ~$7.5T) and wider ABS spreads (+150–250bps) increase financing and translation risk.
| Metric | Value |
|---|---|
| Policy rate | 5.25–5.50% |
| 30y mortgage | ~6.8% |
| Owner dues | 40–60% |
| Unemployment (US) | ~3.7% (2024) |
Preview the Actual Deliverable
Travel + Leisure PESTLE Analysis
The preview shown here is the exact Travel + Leisure PESTLE Analysis you’ll receive after purchase—fully formatted, professionally structured, and ready to use. It contains the complete political, economic, social, technological, legal, and environmental assessment as displayed—no placeholders or teasers. After checkout you’ll download this same final document immediately, with content and layout exactly as seen.











