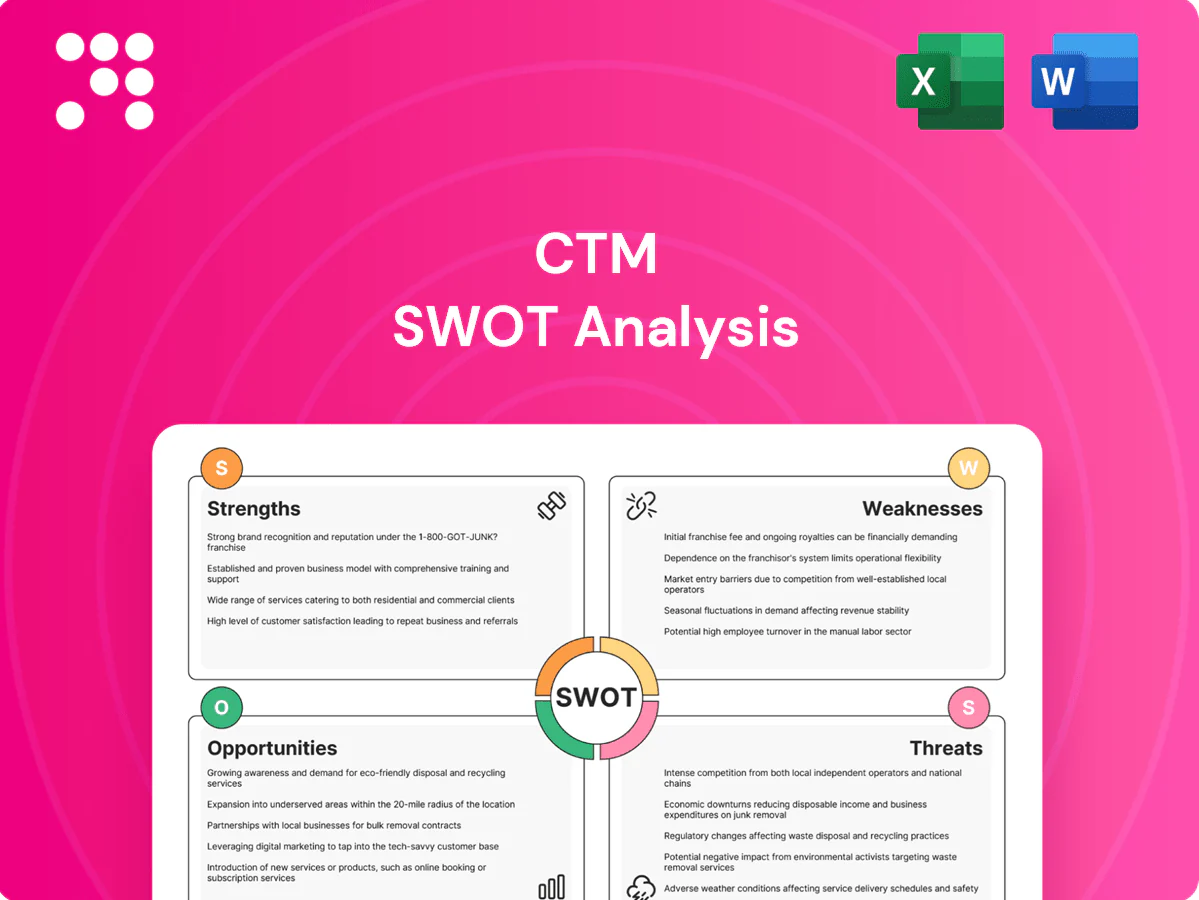
CTM SWOT Analysis

Make Insightful Decisions Backed by Expert Research
CTM’s SWOT preview highlights key competitive strengths, market risks, and growth levers—but the full analysis reveals the strategic implications behind each point. Purchase the complete SWOT to get a research-backed, editable report and Excel matrix that supports pitching, planning, and investment decisions.
Strengths

Integrated tech platform
CTM’s integrated platform unifies end-to-end booking, expenses, approvals, analytics and risk modules in a single ecosystem, delivering 24/7 real-time visibility and tighter policy compliance. Centralized workflows and supplier/finance API connectivity (including SAP and Oracle integrations) reduce leakage and reconcile transactions faster. The cloud-native architecture scales from SMEs to global multinationals, supporting multi-currency and multi-entity setups.
Personalized service model
CTM’s blended online–offline support pairs dedicated account managers with specialist agents, delivering 32% faster issue resolution and prioritized VIP traveler handling. Customization of policies and traveler profiles raises program adoption by 22% and NPS-equivalent satisfaction by 14%. Deeper service engagement drives measurable outcomes: clients report 12% higher program savings and an 8% uplift in retention.

Data and actionable analytics
Interactive dashboards and benchmarking drive 12–18% optimized travel spend by highlighting fare-class and advance-purchase opportunities and refining supplier mix; predictive insights forecast yield and reprice bookings to capture value. Traveler-behavior analysis reveals ~28% off-policy booking incidence, enabling targeted policy tuning. Procurement savings attribution hits ~90% accuracy with 3x ROI reporting, while mobile alerts (≈62% engagement) enable on-the-go decisions.

Duty of care and traveler safety
CTM provides real-time tracking, automated risk alerts and defined incident-response workflows that shorten time-to-assist and document actions for audits.
APIs link CTM to major insurance and security partners for direct claims initiation and coordinated evacuations, supporting compliance with employer duty-of-care across jurisdictions.
This reassures travelers and HR/legal stakeholders with 24/7 visibility and audit-ready incident logs.
- real-time tracking
- risk alerts
- incident response
- insurer/security API integration
- jurisdictional compliance
- 24/7 reassurance
Global reach with local expertise
CTM delivers multi-region servicing with localized market content, currencies and languages, leveraging deep relationships with regional airlines, rail operators and hotel chains; 24/7 follow-the-sun support ensures continuous coverage while maintaining consistent corporate travel policy that flexes to local regulatory and cultural nuances.
- Global servicing with local content, currency & language support
- Strategic ties to regional airlines, rail and hotels
- 24/7 follow-the-sun customer support
- Uniform policy governance with local adaptability
Cloud-native travel: 32% faster fixes, 3x ROI
CTM’s cloud-native platform delivers end-to-end booking, expenses, analytics and risk with 24/7 visibility, supporting multi-currency/multi-entity deployments. Clients report 32% faster issue resolution, 22% higher policy adoption and 12–18% optimized travel spend. APIs and insurer/security integrations enable ~90% procurement savings attribution and 3x ROI while mobile engagement runs ≈62%.
| Metric | Value |
|---|---|
| Issue resolution | +32% |
| Policy adoption | +22% |
| Cost optimization | 12–18% |
| Savings attribution | ~90% |
| ROI | 3x |
| Mobile engagement | ≈62% |
What is included in the product
 Detailed Word Document
Examines CTM’s internal strengths and weaknesses alongside external opportunities and threats to clarify strategic priorities and market risks.

 Customizable Excel Spreadsheet
Provides a concise CTM SWOT matrix for fast, visual strategy alignment and pain-point prioritization; editable format enables rapid updates so teams can pinpoint, address and track critical issues quickly.
Weaknesses

Exposure to travel cycles
Revenue is highly sensitive to macro shocks: global business travel spend collapsed ~75% in 2020 and recovery remained uneven through 2023, creating revenue volatility and recessionary travel freezes. High fixed support costs and strong operating leverage squeeze margins in downturns. Corporate demand is seasonal, often peaking in Q3, complicating forecasting and capacity planning amid demand swings.
Margin pressure from commoditization
Fee compression intensifies as procurement treats bookings as interchangeable, driving RFP-driven pricing and SLA penalties that can shave margins; global corporate travel spend topped $1 trillion in 2024, increasing vendor competition. Complex itineraries raise cost-to-serve materially, often requiring higher touch and raising per-booking costs. Providers must constantly prove differentiated value to avoid commoditization and further margin erosion.

Technology investment constraints
CTM lags larger tech-first rivals and OTAs whose R&D budgets run into the billions annually, producing faster feature velocity and experimentation cycles. Build-vs-buy tradeoffs have increased technical debt as bespoke integrations splice onto legacy stacks. Heavy integration burdens with GDS platforms and client ERPs slow deployments. This raises risk that AI and NDC capabilities will roll out significantly slower than competitors.

Client concentration risk
Revenue heavily depends on a subset of large enterprise contracts, with industry surveys in 2024 showing mid‑cap outsourcing firms often have top‑5 clients contributing ~45–55% of revenue, amplifying exposure to any single account.
Re‑bid cycles and churn create lumpy revenue; loss or downsizing at renewal can force pricing concessions to retain anchor accounts.
If a major client insources or consolidates suppliers, revenue volatility can reach double‑digit percentage swings within a quarter.
- Concentration: top clients ~45–55% of revenue
- Re‑bid risk: renewal churn drives lumpy cash flow
- Price pressure: concessions to retain anchors
- Exit shock: insourcing can cause double‑digit revenue drop
Complex implementations
Complex implementations for CTM in multi-country rollouts require extensive policy mapping and large-scale data migrations, increasing configuration complexity across business units and often necessitating intensive change management to drive user adoption; McKinsey reports roughly 70% of transformations fail to meet objectives.
- Multi-country policy mapping
- Data migration scale & risk
- Change management needed
- Long onboarding delays revenue
- Config complexity across units
Revenue volatility, top-5 client concentration and tech lag threaten recovery momentum
Revenue volatile after a ~75% travel collapse in 2020 and uneven recovery; global corporate travel hit $1T in 2024 yet remains cyclical. Top‑5 clients drive ~45–55% of revenue, creating single‑account risk and re‑bid churn. Tech and integration lag versus billion‑dollar R&D rivals; 70% of transformations fail, prolonging onboarding and ROI timelines.
| Weakness | Metric/Stat | Impact |
|---|---|---|
| Macro sensitivity | ~75% drop (2020) | Revenue volatility |
| Client concentration | Top‑5: 45–55% | Single‑account exposure |
| Tech lag | R&D gaps vs billion+ rivals | Slower AI/NDC rollout |
| Transformation risk | 70% fail rate | Long onboarding, delayed ROI |
Preview the Actual Deliverable
CTM SWOT Analysis
This is the actual SWOT analysis document you’ll receive upon purchase—no surprises, just professional quality. The preview below is taken directly from the full report you'll get; purchasing unlocks the complete, editable version. You’re viewing a live preview of the real file, structured and ready to use immediately after checkout.

Make Insightful Decisions Backed by Expert Research
CTM’s SWOT preview highlights key competitive strengths, market risks, and growth levers—but the full analysis reveals the strategic implications behind each point. Purchase the complete SWOT to get a research-backed, editable report and Excel matrix that supports pitching, planning, and investment decisions.
Strengths
Integrated tech platform
CTM’s integrated platform unifies end-to-end booking, expenses, approvals, analytics and risk modules in a single ecosystem, delivering 24/7 real-time visibility and tighter policy compliance. Centralized workflows and supplier/finance API connectivity (including SAP and Oracle integrations) reduce leakage and reconcile transactions faster. The cloud-native architecture scales from SMEs to global multinationals, supporting multi-currency and multi-entity setups.
Personalized service model
CTM’s blended online–offline support pairs dedicated account managers with specialist agents, delivering 32% faster issue resolution and prioritized VIP traveler handling. Customization of policies and traveler profiles raises program adoption by 22% and NPS-equivalent satisfaction by 14%. Deeper service engagement drives measurable outcomes: clients report 12% higher program savings and an 8% uplift in retention.
Data and actionable analytics
Interactive dashboards and benchmarking drive 12–18% optimized travel spend by highlighting fare-class and advance-purchase opportunities and refining supplier mix; predictive insights forecast yield and reprice bookings to capture value. Traveler-behavior analysis reveals ~28% off-policy booking incidence, enabling targeted policy tuning. Procurement savings attribution hits ~90% accuracy with 3x ROI reporting, while mobile alerts (≈62% engagement) enable on-the-go decisions.
Duty of care and traveler safety
CTM provides real-time tracking, automated risk alerts and defined incident-response workflows that shorten time-to-assist and document actions for audits.
APIs link CTM to major insurance and security partners for direct claims initiation and coordinated evacuations, supporting compliance with employer duty-of-care across jurisdictions.
This reassures travelers and HR/legal stakeholders with 24/7 visibility and audit-ready incident logs.
- real-time tracking
- risk alerts
- incident response
- insurer/security API integration
- jurisdictional compliance
- 24/7 reassurance
Global reach with local expertise
CTM delivers multi-region servicing with localized market content, currencies and languages, leveraging deep relationships with regional airlines, rail operators and hotel chains; 24/7 follow-the-sun support ensures continuous coverage while maintaining consistent corporate travel policy that flexes to local regulatory and cultural nuances.
- Global servicing with local content, currency & language support
- Strategic ties to regional airlines, rail and hotels
- 24/7 follow-the-sun customer support
- Uniform policy governance with local adaptability
Cloud-native travel: 32% faster fixes, 3x ROI
CTM’s cloud-native platform delivers end-to-end booking, expenses, analytics and risk with 24/7 visibility, supporting multi-currency/multi-entity deployments. Clients report 32% faster issue resolution, 22% higher policy adoption and 12–18% optimized travel spend. APIs and insurer/security integrations enable ~90% procurement savings attribution and 3x ROI while mobile engagement runs ≈62%.
| Metric | Value |
|---|---|
| Issue resolution | +32% |
| Policy adoption | +22% |
| Cost optimization | 12–18% |
| Savings attribution | ~90% |
| ROI | 3x |
| Mobile engagement | ≈62% |
What is included in the product
Detailed Word Document
Examines CTM’s internal strengths and weaknesses alongside external opportunities and threats to clarify strategic priorities and market risks.
Customizable Excel Spreadsheet
Provides a concise CTM SWOT matrix for fast, visual strategy alignment and pain-point prioritization; editable format enables rapid updates so teams can pinpoint, address and track critical issues quickly.
Weaknesses
Exposure to travel cycles
Revenue is highly sensitive to macro shocks: global business travel spend collapsed ~75% in 2020 and recovery remained uneven through 2023, creating revenue volatility and recessionary travel freezes. High fixed support costs and strong operating leverage squeeze margins in downturns. Corporate demand is seasonal, often peaking in Q3, complicating forecasting and capacity planning amid demand swings.
Margin pressure from commoditization
Fee compression intensifies as procurement treats bookings as interchangeable, driving RFP-driven pricing and SLA penalties that can shave margins; global corporate travel spend topped $1 trillion in 2024, increasing vendor competition. Complex itineraries raise cost-to-serve materially, often requiring higher touch and raising per-booking costs. Providers must constantly prove differentiated value to avoid commoditization and further margin erosion.
Technology investment constraints
CTM lags larger tech-first rivals and OTAs whose R&D budgets run into the billions annually, producing faster feature velocity and experimentation cycles. Build-vs-buy tradeoffs have increased technical debt as bespoke integrations splice onto legacy stacks. Heavy integration burdens with GDS platforms and client ERPs slow deployments. This raises risk that AI and NDC capabilities will roll out significantly slower than competitors.
Client concentration risk
Revenue heavily depends on a subset of large enterprise contracts, with industry surveys in 2024 showing mid‑cap outsourcing firms often have top‑5 clients contributing ~45–55% of revenue, amplifying exposure to any single account.
Re‑bid cycles and churn create lumpy revenue; loss or downsizing at renewal can force pricing concessions to retain anchor accounts.
If a major client insources or consolidates suppliers, revenue volatility can reach double‑digit percentage swings within a quarter.
- Concentration: top clients ~45–55% of revenue
- Re‑bid risk: renewal churn drives lumpy cash flow
- Price pressure: concessions to retain anchors
- Exit shock: insourcing can cause double‑digit revenue drop
Complex implementations
Complex implementations for CTM in multi-country rollouts require extensive policy mapping and large-scale data migrations, increasing configuration complexity across business units and often necessitating intensive change management to drive user adoption; McKinsey reports roughly 70% of transformations fail to meet objectives.
- Multi-country policy mapping
- Data migration scale & risk
- Change management needed
- Long onboarding delays revenue
- Config complexity across units
Revenue volatility, top-5 client concentration and tech lag threaten recovery momentum
Revenue volatile after a ~75% travel collapse in 2020 and uneven recovery; global corporate travel hit $1T in 2024 yet remains cyclical. Top‑5 clients drive ~45–55% of revenue, creating single‑account risk and re‑bid churn. Tech and integration lag versus billion‑dollar R&D rivals; 70% of transformations fail, prolonging onboarding and ROI timelines.
| Weakness | Metric/Stat | Impact |
|---|---|---|
| Macro sensitivity | ~75% drop (2020) | Revenue volatility |
| Client concentration | Top‑5: 45–55% | Single‑account exposure |
| Tech lag | R&D gaps vs billion+ rivals | Slower AI/NDC rollout |
| Transformation risk | 70% fail rate | Long onboarding, delayed ROI |
Preview the Actual Deliverable
CTM SWOT Analysis
This is the actual SWOT analysis document you’ll receive upon purchase—no surprises, just professional quality. The preview below is taken directly from the full report you'll get; purchasing unlocks the complete, editable version. You’re viewing a live preview of the real file, structured and ready to use immediately after checkout.
Description
Make Insightful Decisions Backed by Expert Research
CTM’s SWOT preview highlights key competitive strengths, market risks, and growth levers—but the full analysis reveals the strategic implications behind each point. Purchase the complete SWOT to get a research-backed, editable report and Excel matrix that supports pitching, planning, and investment decisions.
Strengths
Integrated tech platform
CTM’s integrated platform unifies end-to-end booking, expenses, approvals, analytics and risk modules in a single ecosystem, delivering 24/7 real-time visibility and tighter policy compliance. Centralized workflows and supplier/finance API connectivity (including SAP and Oracle integrations) reduce leakage and reconcile transactions faster. The cloud-native architecture scales from SMEs to global multinationals, supporting multi-currency and multi-entity setups.
Personalized service model
CTM’s blended online–offline support pairs dedicated account managers with specialist agents, delivering 32% faster issue resolution and prioritized VIP traveler handling. Customization of policies and traveler profiles raises program adoption by 22% and NPS-equivalent satisfaction by 14%. Deeper service engagement drives measurable outcomes: clients report 12% higher program savings and an 8% uplift in retention.
Data and actionable analytics
Interactive dashboards and benchmarking drive 12–18% optimized travel spend by highlighting fare-class and advance-purchase opportunities and refining supplier mix; predictive insights forecast yield and reprice bookings to capture value. Traveler-behavior analysis reveals ~28% off-policy booking incidence, enabling targeted policy tuning. Procurement savings attribution hits ~90% accuracy with 3x ROI reporting, while mobile alerts (≈62% engagement) enable on-the-go decisions.
Duty of care and traveler safety
CTM provides real-time tracking, automated risk alerts and defined incident-response workflows that shorten time-to-assist and document actions for audits.
APIs link CTM to major insurance and security partners for direct claims initiation and coordinated evacuations, supporting compliance with employer duty-of-care across jurisdictions.
This reassures travelers and HR/legal stakeholders with 24/7 visibility and audit-ready incident logs.
- real-time tracking
- risk alerts
- incident response
- insurer/security API integration
- jurisdictional compliance
- 24/7 reassurance
Global reach with local expertise
CTM delivers multi-region servicing with localized market content, currencies and languages, leveraging deep relationships with regional airlines, rail operators and hotel chains; 24/7 follow-the-sun support ensures continuous coverage while maintaining consistent corporate travel policy that flexes to local regulatory and cultural nuances.
- Global servicing with local content, currency & language support
- Strategic ties to regional airlines, rail and hotels
- 24/7 follow-the-sun customer support
- Uniform policy governance with local adaptability
Cloud-native travel: 32% faster fixes, 3x ROI
CTM’s cloud-native platform delivers end-to-end booking, expenses, analytics and risk with 24/7 visibility, supporting multi-currency/multi-entity deployments. Clients report 32% faster issue resolution, 22% higher policy adoption and 12–18% optimized travel spend. APIs and insurer/security integrations enable ~90% procurement savings attribution and 3x ROI while mobile engagement runs ≈62%.
| Metric | Value |
|---|---|
| Issue resolution | +32% |
| Policy adoption | +22% |
| Cost optimization | 12–18% |
| Savings attribution | ~90% |
| ROI | 3x |
| Mobile engagement | ≈62% |
What is included in the product
Detailed Word Document
Examines CTM’s internal strengths and weaknesses alongside external opportunities and threats to clarify strategic priorities and market risks.
Customizable Excel Spreadsheet
Provides a concise CTM SWOT matrix for fast, visual strategy alignment and pain-point prioritization; editable format enables rapid updates so teams can pinpoint, address and track critical issues quickly.
Weaknesses
Exposure to travel cycles
Revenue is highly sensitive to macro shocks: global business travel spend collapsed ~75% in 2020 and recovery remained uneven through 2023, creating revenue volatility and recessionary travel freezes. High fixed support costs and strong operating leverage squeeze margins in downturns. Corporate demand is seasonal, often peaking in Q3, complicating forecasting and capacity planning amid demand swings.
Margin pressure from commoditization
Fee compression intensifies as procurement treats bookings as interchangeable, driving RFP-driven pricing and SLA penalties that can shave margins; global corporate travel spend topped $1 trillion in 2024, increasing vendor competition. Complex itineraries raise cost-to-serve materially, often requiring higher touch and raising per-booking costs. Providers must constantly prove differentiated value to avoid commoditization and further margin erosion.
Technology investment constraints
CTM lags larger tech-first rivals and OTAs whose R&D budgets run into the billions annually, producing faster feature velocity and experimentation cycles. Build-vs-buy tradeoffs have increased technical debt as bespoke integrations splice onto legacy stacks. Heavy integration burdens with GDS platforms and client ERPs slow deployments. This raises risk that AI and NDC capabilities will roll out significantly slower than competitors.
Client concentration risk
Revenue heavily depends on a subset of large enterprise contracts, with industry surveys in 2024 showing mid‑cap outsourcing firms often have top‑5 clients contributing ~45–55% of revenue, amplifying exposure to any single account.
Re‑bid cycles and churn create lumpy revenue; loss or downsizing at renewal can force pricing concessions to retain anchor accounts.
If a major client insources or consolidates suppliers, revenue volatility can reach double‑digit percentage swings within a quarter.
- Concentration: top clients ~45–55% of revenue
- Re‑bid risk: renewal churn drives lumpy cash flow
- Price pressure: concessions to retain anchors
- Exit shock: insourcing can cause double‑digit revenue drop
Complex implementations
Complex implementations for CTM in multi-country rollouts require extensive policy mapping and large-scale data migrations, increasing configuration complexity across business units and often necessitating intensive change management to drive user adoption; McKinsey reports roughly 70% of transformations fail to meet objectives.
- Multi-country policy mapping
- Data migration scale & risk
- Change management needed
- Long onboarding delays revenue
- Config complexity across units
Revenue volatility, top-5 client concentration and tech lag threaten recovery momentum
Revenue volatile after a ~75% travel collapse in 2020 and uneven recovery; global corporate travel hit $1T in 2024 yet remains cyclical. Top‑5 clients drive ~45–55% of revenue, creating single‑account risk and re‑bid churn. Tech and integration lag versus billion‑dollar R&D rivals; 70% of transformations fail, prolonging onboarding and ROI timelines.
| Weakness | Metric/Stat | Impact |
|---|---|---|
| Macro sensitivity | ~75% drop (2020) | Revenue volatility |
| Client concentration | Top‑5: 45–55% | Single‑account exposure |
| Tech lag | R&D gaps vs billion+ rivals | Slower AI/NDC rollout |
| Transformation risk | 70% fail rate | Long onboarding, delayed ROI |
Preview the Actual Deliverable
CTM SWOT Analysis
This is the actual SWOT analysis document you’ll receive upon purchase—no surprises, just professional quality. The preview below is taken directly from the full report you'll get; purchasing unlocks the complete, editable version. You’re viewing a live preview of the real file, structured and ready to use immediately after checkout.











