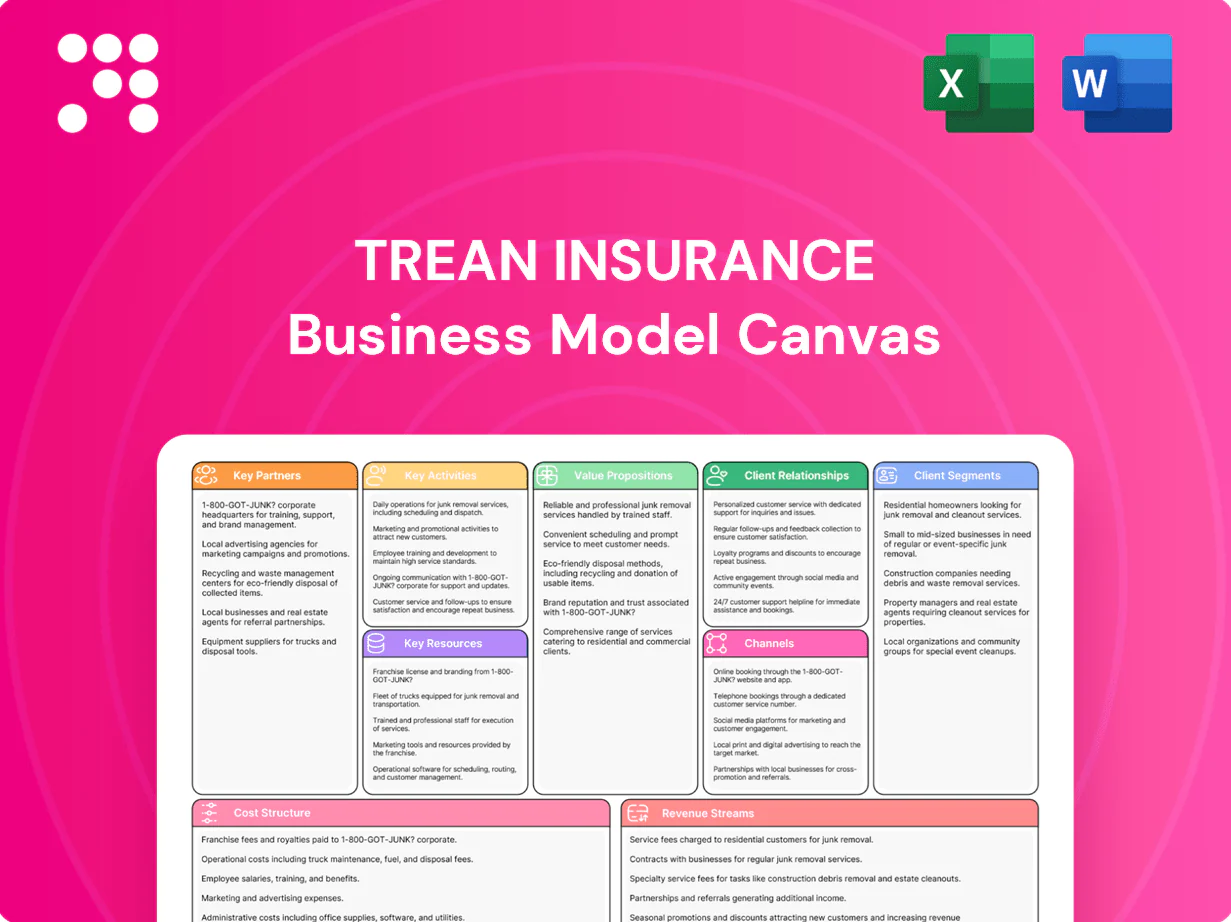
Trean Insurance Business Model Canvas

Business Model Canvas: Compact Blueprint for Value, Channels, Partners and Revenue Streams
Unlock the complete Business Model Canvas for Trean Insurance and see how its value propositions, channels, and revenue streams deliver competitive advantage. This concise, actionable document breaks down key partnerships, cost structure, and growth levers. Ideal for investors and strategists seeking a ready-to-use blueprint—download the full Word and Excel files to benchmark and adapt proven tactics.
Partnerships

Managing general agents
In 2024 MGAs originate and underwrite niche programs, extending Trean’s market reach without heavy fixed distribution costs. They bring specialized underwriting expertise and established broker relationships that accelerate placement. Trean supplies paper, capacity, and governance to ensure performance, with incentives aligned via commission structures and profit-sharing arrangements.
Program administrators
Program administrators manage end-to-end operations for targeted classes—underwriting, distribution and servicing—while Trean supplies licensing, capital and compliance oversight; this model often shortens time-to-market from 12–18 months to roughly 3–6 months. Clear SLAs and real-time performance dashboards monitor KPIs such as premium velocity, loss ratio and attachment rates to maintain discipline.

Reinsurers and fronting partners
Reinsurers provide capacity, volatility smoothing and capital efficiency, with industry reinsurance capacity up ~3% year-on-year in 2024 supporting larger programed limits. Structured quota-share and excess-of-loss treaties protect Trean’s underwriting results by ceding a defined share and attaching excess protection for peak loss layers. Fronting relationships enable program scale and access to niche risks otherwise uninsurable. Joint governance with partners aligns risk appetite and pricing through shared underwriting committees.

Broker networks and wholesalers
Retail and wholesale brokers funnel qualified submissions to Trean and its MGAs, driving specialty deal flow and access to regional and industry niches with lower acquisition cost per account. Education programs and co-marketing in 2024 improved placement rates and average premium per policy, while structured feedback loops refine appetite and underwriting guidelines. Close broker partnerships deepen market intelligence and speed quoting.
- Channel: retail + wholesale brokers
- Benefit: niche penetration, lower CAC
- Enablement: 2024 co-marketing & training
- Outcome: higher placement rates, refined underwriting
TPA, technology, and data vendors
Claims platforms, data enrichers and analytics partners boost TPA efficiency and loss control, with 2024 industry averages showing 15–25% lower loss adjustment expenses and ~30% faster cycle times. Integrations enable straight-through processing (target 60–80% STP) and real-time performance tracking for sub-48hr simple-claim resolution. Medical bill review and SIU vendors cut paid-medical costs 10–20% and fraud leakage ~15–20%; HIPAA/SOC2-grade secure exchange preserves compliance and client trust.
- Claims platforms: faster adjudication, 15–25% LAE reduction
- Data/analytics: real-time KPIs, 60–80% STP target
- Med bill review/SIU: 10–20% cost savings, ~15–20% fraud reduction
- Security: HIPAA/SOC2 secure data exchange
MGAs and program admins speed specialty launches, add +3% capacity
MGAs expand Trean’s reach and underwriting capacity with specialized distribution, supplying paper and aligned commission/profit-share economics. Program administrators compress time-to-market from 12–18 months to ~3–6 months while Trean provides capital, licensing and compliance. Reinsurers add capacity (+3% year-on-year in 2024), quota-share and XL protection; fronting scales niche programs. Claims/data partners lower LAE 15–25% and target 60–80% STP.
| Partner | Role | 2024 Metric |
|---|---|---|
| MGA | Originate/underwrite programs | Capacity growth ~3% YoY |
| Program admin | Ops, distribution, servicing | Time-to-market 3–6 months |
| Reinsurer | Capacity/volatility protection | Quota-share/XL; +3% capacity |
| Brokers | Deal flow/channel | Improved placement & premium |
| Claims/data | LAE reduction, STP | LAE -15–25%; STP 60–80% |
What is included in the product
 Detailed Word Document
A comprehensive, pre-written Business Model Canvas tailored to Trean Insurance that maps customer segments, value propositions, channels, revenue streams, cost structure, key resources, partners, activities and risk/claims processes. Ideal for investor presentations and strategic planning, it includes SWOT and competitive-advantage analysis with actionable insights for underwriting, distribution and growth.

 Customizable Excel Spreadsheet
High-level, editable Business Model Canvas that pinpoints Trean Insurance pain points and maps streamlined remedies on one page for fast decision-making, team collaboration, and board-ready summaries.
Activities

Program underwriting
Risk selection and pricing across workers’ comp and specialty casualty programs drive Trean’s profitability, with underwriters setting boundaries to protect margin while targeting competitive premium yields.
Trean establishes guardrails and audits MGA decisions to ensure adherence to appetite and underwriting profitability metrics.
Active portfolio steering balances growth with loss ratio targets and uses continuous feedback loops to adjust appetite and rates in near real time.
Claims administration
TPA claims administration delivers prompt, cost-effective handling for self-insureds and carriers, leveraging scalable operations and networks; 61% of covered US workers were in self-funded plans per KFF 2023, underscoring market scale. Medical management, litigation control, and active subrogation materially cut loss costs. Metrics-driven oversight improves closure rates and reduces severity, while client reporting ensures transparency and regulatory compliance.

Reinsurance management
Designing, placing and monitoring treaty and facultative covers preserves Trean’s capital buffer, with 2024 industry reinsurance pricing rising roughly 15% year-on-year supporting tightened capacity. Rigorous credit risk and recoverable management plus daily collateral tracking keep counterparty exposure within agreed limits. High data quality drives accurate ceded premium and claim allocation, and renewal strategies are synchronized to 2024 market cycles and growth targets.

Regulatory and compliance
Trean maintains multi-state filings across all 50 states plus DC, rigorously managing rate/rule forms and statutory reporting. Licensing and market conduct exams demand strong internal controls and audit trails. Data privacy and cybersecurity align with evolving standards; IBM 2024 reports an average data breach cost of $4.45M. Governance frameworks oversee delegated authorities and escalation.
- 50 states + DC filings
- Rate/rule & statutory reporting
- Market conduct controls
- Cybersecurity: $4.45M avg breach cost (IBM 2024)
- Delegated authority governance
Data analytics and loss control
Actuarial models set rate adequacy and program thresholds to target sustainable loss ratios; 2024 modeling calibrations aim for combined ratios near 95% across specialty lines. Predictive analytics flag adverse development and fraud—2024 industry estimates place fraud at roughly 10% of claim costs—enabling early intervention. Safety programs and risk engineering lower frequency/severity (avg. frequency reduction ~12%); performance scorecards across 1,000+ partners drive underwriting and portfolio actions.
- Actuarial: rate adequacy, thresholds
- Predictive: flag adverse development, ~10% fraud impact (2024)
- Risk engineering: ~12% frequency reduction
- Scorecards: guide partner/portfolio decisions (1,000+ partners)
Underwriters chase 95% CR; reinsurance +15%
Underwriters price and select risk across workers’ comp and specialty casualty to hit ~95% combined ratio targets.
TPA claims, medical management and subrogation lower severity; 61% of US workers in self-funded plans (KFF 2023).
Reinsurance placement manages capital with ~15% higher pricing in 2024; daily collateral and recoverable controls limit exposure.
Actuarial, predictive analytics (~10% fraud impact 2024) and risk engineering (~12% frequency reduction) steer portfolio.
| Metric | Value |
|---|---|
| States filed | 50+DC |
| TPA reach | Self-funded 61% |
| Reins pricing 2024 | +15% |
| Avg breach cost 2024 | $4.45M |
Preview Before You Purchase
Business Model Canvas
The document you're previewing is the exact Trean Insurance Business Model Canvas you'll receive after purchase; it's not a mockup or sample. This live file contains all sections, structure and content as shown, ready for editing, presenting, or sharing. After buying, you'll instantly download the same complete, presentation-ready document.

Business Model Canvas: Compact Blueprint for Value, Channels, Partners and Revenue Streams
Unlock the complete Business Model Canvas for Trean Insurance and see how its value propositions, channels, and revenue streams deliver competitive advantage. This concise, actionable document breaks down key partnerships, cost structure, and growth levers. Ideal for investors and strategists seeking a ready-to-use blueprint—download the full Word and Excel files to benchmark and adapt proven tactics.
Partnerships
Managing general agents
In 2024 MGAs originate and underwrite niche programs, extending Trean’s market reach without heavy fixed distribution costs. They bring specialized underwriting expertise and established broker relationships that accelerate placement. Trean supplies paper, capacity, and governance to ensure performance, with incentives aligned via commission structures and profit-sharing arrangements.
Program administrators
Program administrators manage end-to-end operations for targeted classes—underwriting, distribution and servicing—while Trean supplies licensing, capital and compliance oversight; this model often shortens time-to-market from 12–18 months to roughly 3–6 months. Clear SLAs and real-time performance dashboards monitor KPIs such as premium velocity, loss ratio and attachment rates to maintain discipline.
Reinsurers and fronting partners
Reinsurers provide capacity, volatility smoothing and capital efficiency, with industry reinsurance capacity up ~3% year-on-year in 2024 supporting larger programed limits. Structured quota-share and excess-of-loss treaties protect Trean’s underwriting results by ceding a defined share and attaching excess protection for peak loss layers. Fronting relationships enable program scale and access to niche risks otherwise uninsurable. Joint governance with partners aligns risk appetite and pricing through shared underwriting committees.
Broker networks and wholesalers
Retail and wholesale brokers funnel qualified submissions to Trean and its MGAs, driving specialty deal flow and access to regional and industry niches with lower acquisition cost per account. Education programs and co-marketing in 2024 improved placement rates and average premium per policy, while structured feedback loops refine appetite and underwriting guidelines. Close broker partnerships deepen market intelligence and speed quoting.
- Channel: retail + wholesale brokers
- Benefit: niche penetration, lower CAC
- Enablement: 2024 co-marketing & training
- Outcome: higher placement rates, refined underwriting
TPA, technology, and data vendors
Claims platforms, data enrichers and analytics partners boost TPA efficiency and loss control, with 2024 industry averages showing 15–25% lower loss adjustment expenses and ~30% faster cycle times. Integrations enable straight-through processing (target 60–80% STP) and real-time performance tracking for sub-48hr simple-claim resolution. Medical bill review and SIU vendors cut paid-medical costs 10–20% and fraud leakage ~15–20%; HIPAA/SOC2-grade secure exchange preserves compliance and client trust.
- Claims platforms: faster adjudication, 15–25% LAE reduction
- Data/analytics: real-time KPIs, 60–80% STP target
- Med bill review/SIU: 10–20% cost savings, ~15–20% fraud reduction
- Security: HIPAA/SOC2 secure data exchange
MGAs and program admins speed specialty launches, add +3% capacity
MGAs expand Trean’s reach and underwriting capacity with specialized distribution, supplying paper and aligned commission/profit-share economics. Program administrators compress time-to-market from 12–18 months to ~3–6 months while Trean provides capital, licensing and compliance. Reinsurers add capacity (+3% year-on-year in 2024), quota-share and XL protection; fronting scales niche programs. Claims/data partners lower LAE 15–25% and target 60–80% STP.
| Partner | Role | 2024 Metric |
|---|---|---|
| MGA | Originate/underwrite programs | Capacity growth ~3% YoY |
| Program admin | Ops, distribution, servicing | Time-to-market 3–6 months |
| Reinsurer | Capacity/volatility protection | Quota-share/XL; +3% capacity |
| Brokers | Deal flow/channel | Improved placement & premium |
| Claims/data | LAE reduction, STP | LAE -15–25%; STP 60–80% |
What is included in the product
Detailed Word Document
A comprehensive, pre-written Business Model Canvas tailored to Trean Insurance that maps customer segments, value propositions, channels, revenue streams, cost structure, key resources, partners, activities and risk/claims processes. Ideal for investor presentations and strategic planning, it includes SWOT and competitive-advantage analysis with actionable insights for underwriting, distribution and growth.
Customizable Excel Spreadsheet
High-level, editable Business Model Canvas that pinpoints Trean Insurance pain points and maps streamlined remedies on one page for fast decision-making, team collaboration, and board-ready summaries.
Activities
Program underwriting
Risk selection and pricing across workers’ comp and specialty casualty programs drive Trean’s profitability, with underwriters setting boundaries to protect margin while targeting competitive premium yields.
Trean establishes guardrails and audits MGA decisions to ensure adherence to appetite and underwriting profitability metrics.
Active portfolio steering balances growth with loss ratio targets and uses continuous feedback loops to adjust appetite and rates in near real time.
Claims administration
TPA claims administration delivers prompt, cost-effective handling for self-insureds and carriers, leveraging scalable operations and networks; 61% of covered US workers were in self-funded plans per KFF 2023, underscoring market scale. Medical management, litigation control, and active subrogation materially cut loss costs. Metrics-driven oversight improves closure rates and reduces severity, while client reporting ensures transparency and regulatory compliance.
Reinsurance management
Designing, placing and monitoring treaty and facultative covers preserves Trean’s capital buffer, with 2024 industry reinsurance pricing rising roughly 15% year-on-year supporting tightened capacity. Rigorous credit risk and recoverable management plus daily collateral tracking keep counterparty exposure within agreed limits. High data quality drives accurate ceded premium and claim allocation, and renewal strategies are synchronized to 2024 market cycles and growth targets.
Regulatory and compliance
Trean maintains multi-state filings across all 50 states plus DC, rigorously managing rate/rule forms and statutory reporting. Licensing and market conduct exams demand strong internal controls and audit trails. Data privacy and cybersecurity align with evolving standards; IBM 2024 reports an average data breach cost of $4.45M. Governance frameworks oversee delegated authorities and escalation.
- 50 states + DC filings
- Rate/rule & statutory reporting
- Market conduct controls
- Cybersecurity: $4.45M avg breach cost (IBM 2024)
- Delegated authority governance
Data analytics and loss control
Actuarial models set rate adequacy and program thresholds to target sustainable loss ratios; 2024 modeling calibrations aim for combined ratios near 95% across specialty lines. Predictive analytics flag adverse development and fraud—2024 industry estimates place fraud at roughly 10% of claim costs—enabling early intervention. Safety programs and risk engineering lower frequency/severity (avg. frequency reduction ~12%); performance scorecards across 1,000+ partners drive underwriting and portfolio actions.
- Actuarial: rate adequacy, thresholds
- Predictive: flag adverse development, ~10% fraud impact (2024)
- Risk engineering: ~12% frequency reduction
- Scorecards: guide partner/portfolio decisions (1,000+ partners)
Underwriters chase 95% CR; reinsurance +15%
Underwriters price and select risk across workers’ comp and specialty casualty to hit ~95% combined ratio targets.
TPA claims, medical management and subrogation lower severity; 61% of US workers in self-funded plans (KFF 2023).
Reinsurance placement manages capital with ~15% higher pricing in 2024; daily collateral and recoverable controls limit exposure.
Actuarial, predictive analytics (~10% fraud impact 2024) and risk engineering (~12% frequency reduction) steer portfolio.
| Metric | Value |
|---|---|
| States filed | 50+DC |
| TPA reach | Self-funded 61% |
| Reins pricing 2024 | +15% |
| Avg breach cost 2024 | $4.45M |
Preview Before You Purchase
Business Model Canvas
The document you're previewing is the exact Trean Insurance Business Model Canvas you'll receive after purchase; it's not a mockup or sample. This live file contains all sections, structure and content as shown, ready for editing, presenting, or sharing. After buying, you'll instantly download the same complete, presentation-ready document.
Original: $10.00
-65%$10.00
$3.50Description
Business Model Canvas: Compact Blueprint for Value, Channels, Partners and Revenue Streams
Unlock the complete Business Model Canvas for Trean Insurance and see how its value propositions, channels, and revenue streams deliver competitive advantage. This concise, actionable document breaks down key partnerships, cost structure, and growth levers. Ideal for investors and strategists seeking a ready-to-use blueprint—download the full Word and Excel files to benchmark and adapt proven tactics.
Partnerships
Managing general agents
In 2024 MGAs originate and underwrite niche programs, extending Trean’s market reach without heavy fixed distribution costs. They bring specialized underwriting expertise and established broker relationships that accelerate placement. Trean supplies paper, capacity, and governance to ensure performance, with incentives aligned via commission structures and profit-sharing arrangements.
Program administrators
Program administrators manage end-to-end operations for targeted classes—underwriting, distribution and servicing—while Trean supplies licensing, capital and compliance oversight; this model often shortens time-to-market from 12–18 months to roughly 3–6 months. Clear SLAs and real-time performance dashboards monitor KPIs such as premium velocity, loss ratio and attachment rates to maintain discipline.
Reinsurers and fronting partners
Reinsurers provide capacity, volatility smoothing and capital efficiency, with industry reinsurance capacity up ~3% year-on-year in 2024 supporting larger programed limits. Structured quota-share and excess-of-loss treaties protect Trean’s underwriting results by ceding a defined share and attaching excess protection for peak loss layers. Fronting relationships enable program scale and access to niche risks otherwise uninsurable. Joint governance with partners aligns risk appetite and pricing through shared underwriting committees.
Broker networks and wholesalers
Retail and wholesale brokers funnel qualified submissions to Trean and its MGAs, driving specialty deal flow and access to regional and industry niches with lower acquisition cost per account. Education programs and co-marketing in 2024 improved placement rates and average premium per policy, while structured feedback loops refine appetite and underwriting guidelines. Close broker partnerships deepen market intelligence and speed quoting.
- Channel: retail + wholesale brokers
- Benefit: niche penetration, lower CAC
- Enablement: 2024 co-marketing & training
- Outcome: higher placement rates, refined underwriting
TPA, technology, and data vendors
Claims platforms, data enrichers and analytics partners boost TPA efficiency and loss control, with 2024 industry averages showing 15–25% lower loss adjustment expenses and ~30% faster cycle times. Integrations enable straight-through processing (target 60–80% STP) and real-time performance tracking for sub-48hr simple-claim resolution. Medical bill review and SIU vendors cut paid-medical costs 10–20% and fraud leakage ~15–20%; HIPAA/SOC2-grade secure exchange preserves compliance and client trust.
- Claims platforms: faster adjudication, 15–25% LAE reduction
- Data/analytics: real-time KPIs, 60–80% STP target
- Med bill review/SIU: 10–20% cost savings, ~15–20% fraud reduction
- Security: HIPAA/SOC2 secure data exchange
MGAs and program admins speed specialty launches, add +3% capacity
MGAs expand Trean’s reach and underwriting capacity with specialized distribution, supplying paper and aligned commission/profit-share economics. Program administrators compress time-to-market from 12–18 months to ~3–6 months while Trean provides capital, licensing and compliance. Reinsurers add capacity (+3% year-on-year in 2024), quota-share and XL protection; fronting scales niche programs. Claims/data partners lower LAE 15–25% and target 60–80% STP.
| Partner | Role | 2024 Metric |
|---|---|---|
| MGA | Originate/underwrite programs | Capacity growth ~3% YoY |
| Program admin | Ops, distribution, servicing | Time-to-market 3–6 months |
| Reinsurer | Capacity/volatility protection | Quota-share/XL; +3% capacity |
| Brokers | Deal flow/channel | Improved placement & premium |
| Claims/data | LAE reduction, STP | LAE -15–25%; STP 60–80% |
What is included in the product
Detailed Word Document
A comprehensive, pre-written Business Model Canvas tailored to Trean Insurance that maps customer segments, value propositions, channels, revenue streams, cost structure, key resources, partners, activities and risk/claims processes. Ideal for investor presentations and strategic planning, it includes SWOT and competitive-advantage analysis with actionable insights for underwriting, distribution and growth.
Customizable Excel Spreadsheet
High-level, editable Business Model Canvas that pinpoints Trean Insurance pain points and maps streamlined remedies on one page for fast decision-making, team collaboration, and board-ready summaries.
Activities
Program underwriting
Risk selection and pricing across workers’ comp and specialty casualty programs drive Trean’s profitability, with underwriters setting boundaries to protect margin while targeting competitive premium yields.
Trean establishes guardrails and audits MGA decisions to ensure adherence to appetite and underwriting profitability metrics.
Active portfolio steering balances growth with loss ratio targets and uses continuous feedback loops to adjust appetite and rates in near real time.
Claims administration
TPA claims administration delivers prompt, cost-effective handling for self-insureds and carriers, leveraging scalable operations and networks; 61% of covered US workers were in self-funded plans per KFF 2023, underscoring market scale. Medical management, litigation control, and active subrogation materially cut loss costs. Metrics-driven oversight improves closure rates and reduces severity, while client reporting ensures transparency and regulatory compliance.
Reinsurance management
Designing, placing and monitoring treaty and facultative covers preserves Trean’s capital buffer, with 2024 industry reinsurance pricing rising roughly 15% year-on-year supporting tightened capacity. Rigorous credit risk and recoverable management plus daily collateral tracking keep counterparty exposure within agreed limits. High data quality drives accurate ceded premium and claim allocation, and renewal strategies are synchronized to 2024 market cycles and growth targets.
Regulatory and compliance
Trean maintains multi-state filings across all 50 states plus DC, rigorously managing rate/rule forms and statutory reporting. Licensing and market conduct exams demand strong internal controls and audit trails. Data privacy and cybersecurity align with evolving standards; IBM 2024 reports an average data breach cost of $4.45M. Governance frameworks oversee delegated authorities and escalation.
- 50 states + DC filings
- Rate/rule & statutory reporting
- Market conduct controls
- Cybersecurity: $4.45M avg breach cost (IBM 2024)
- Delegated authority governance
Data analytics and loss control
Actuarial models set rate adequacy and program thresholds to target sustainable loss ratios; 2024 modeling calibrations aim for combined ratios near 95% across specialty lines. Predictive analytics flag adverse development and fraud—2024 industry estimates place fraud at roughly 10% of claim costs—enabling early intervention. Safety programs and risk engineering lower frequency/severity (avg. frequency reduction ~12%); performance scorecards across 1,000+ partners drive underwriting and portfolio actions.
- Actuarial: rate adequacy, thresholds
- Predictive: flag adverse development, ~10% fraud impact (2024)
- Risk engineering: ~12% frequency reduction
- Scorecards: guide partner/portfolio decisions (1,000+ partners)
Underwriters chase 95% CR; reinsurance +15%
Underwriters price and select risk across workers’ comp and specialty casualty to hit ~95% combined ratio targets.
TPA claims, medical management and subrogation lower severity; 61% of US workers in self-funded plans (KFF 2023).
Reinsurance placement manages capital with ~15% higher pricing in 2024; daily collateral and recoverable controls limit exposure.
Actuarial, predictive analytics (~10% fraud impact 2024) and risk engineering (~12% frequency reduction) steer portfolio.
| Metric | Value |
|---|---|
| States filed | 50+DC |
| TPA reach | Self-funded 61% |
| Reins pricing 2024 | +15% |
| Avg breach cost 2024 | $4.45M |
Preview Before You Purchase
Business Model Canvas
The document you're previewing is the exact Trean Insurance Business Model Canvas you'll receive after purchase; it's not a mockup or sample. This live file contains all sections, structure and content as shown, ready for editing, presenting, or sharing. After buying, you'll instantly download the same complete, presentation-ready document.











