Restaurant Group Boston Consulting Group Matrix

Download Your Competitive Advantage
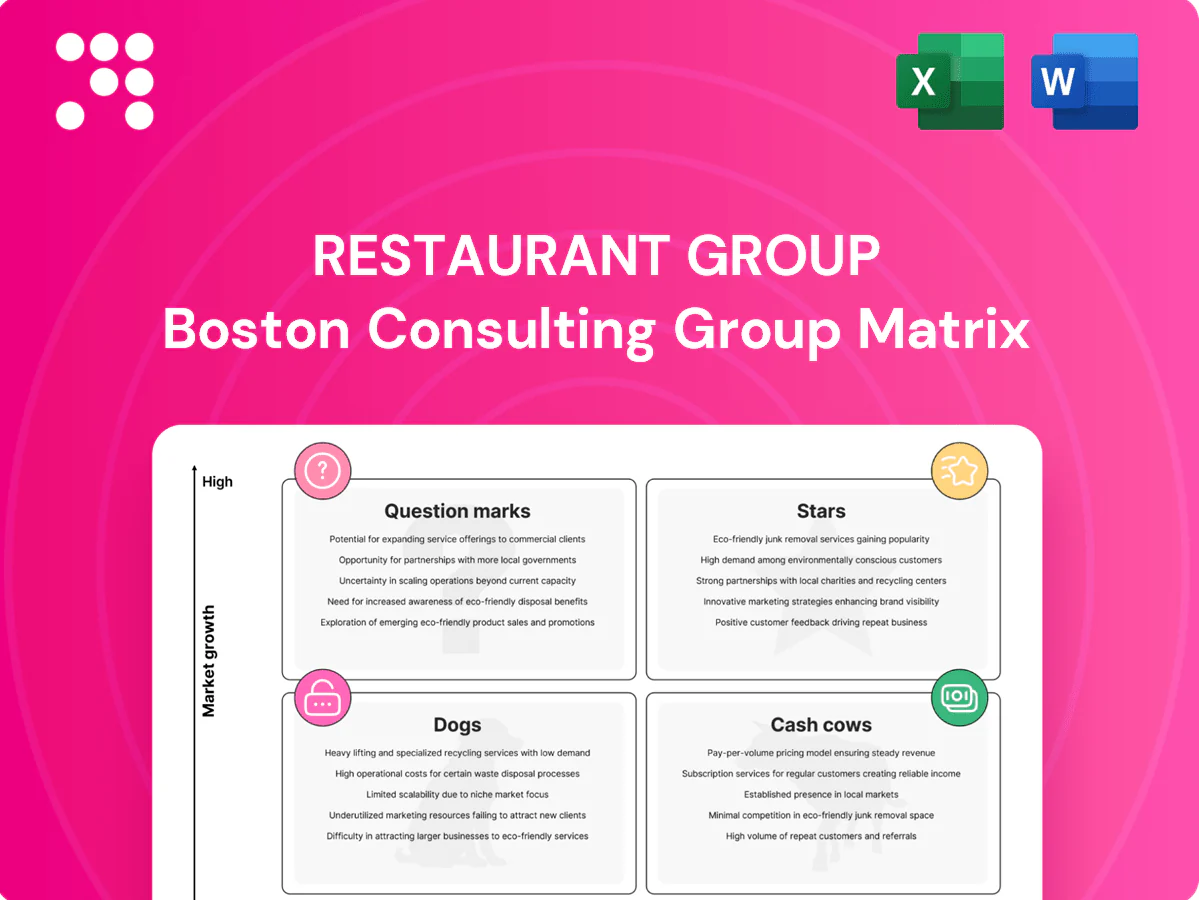
The Restaurant Group BCG Matrix preview shows which menu lines and brands are winning market share and which are eating into cash—think Stars, Cash Cows, Dogs, and Question Marks mapped to real revenue streams. Want the full picture? Purchase the complete BCG Matrix for quadrant-by-quadrant placements, clear strategic moves, and data-backed recommendations you can act on. You’ll get a ready-to-use Word report plus an Excel summary so you can present, slice, and decide fast.
Stars

Airport concessions
High footfall and captive demand at airports, combined with strong landlord contracts, place TRG’s airport concessions at the front of the pack. IATA forecast for 2024 projects global air traffic slightly above 2019 levels (around +3%), fuelling market growth as travel rebounds and supporting all-daypart revenue. These units still require capex and promotional spend to meet new formats and landlord standards; continued investment defends slots and enables upsell that can mature into cash cows.
Wagamama brand
Wagamama sits as a pan-Asian category leader with strong brand awareness and momentum; the fast-casual Asian segment is growing (c.8% CAGR 2022–27) and Wagamama’s share is high versus peers. Operating c.170 sites in 2024, it remains capital hungry—new sites, tech and delivery integrations—but the expansion flywheel justifies investment: hold share, open smart, let growth convert to yield.

Brunning & Price pubs
Brunning & Price, a premium, community-led estate of c.80 pubs, delivers loyal repeat trade and strong unit economics within Restaurant Group’s BCG matrix. The segment is expanding as guests trade up for experience-led dining, driving higher spend per cover in 2024. Continued capital investment in estate and guest experience is required to stay ahead; protect the brand, prune laggards and double down on proven geographies.

High-traffic retail clusters
High-traffic retail clusters—leisure-park and shopping-centre sites that still hum on weekends and events—are Stars in the BCG matrix: TRG’s multi-banner presence captures family occasions and drives outsized weekend share; Springboard reported UK retail footfall at about 95% of 2019 levels in 2024, supporting sustained demand. Continued promo, staffing, and ops discipline are required to keep turns high; expand seating and throughput where demand warrants.
- Weekend/event footfall resilience: ~95% of 2019 (Springboard, 2024)
- Multi-banner share: majority of family occasions, double-digit weekend uplift
- Needs: disciplined promos, staffing, ops to maintain high turns
- Action: stick with winners, add seating/throughput where metrics justify
Digital order & collect
Digital order & collect adoption is growing and TRG captured c.22% of digital orders within its estate in 2024, widening occasions (office nights, quick airport pick-ups) and boosting average check by ~12% through add‑ons; it still needs targeted marketing and UX spend to hit full potential, so fund it as the channel matures into a dependable margin source.
- Adoption: c.22% digital share (2024)
- Revenue impact: +12% AOV from add‑ons
- Action: invest in marketing & UX to scale margin
Airports +3% traffic; fast-casual ~8% CAGR; pubs steady; retail footfall 95%, digital +22%
Airport concessions benefit from IATA 2024 traffic +3% vs 2019, defend slots with capex; Wagamama (c.170 sites in 2024) grows in an ~8% CAGR fast-casual segment but needs expansion spend; Brunning & Price (c.80 pubs) delivers premium repeat trade; retail clusters see c.95% of 2019 footfall (Springboard 2024) and digital orders at c.22% lift AOV ~12%.
| Segment | 2024 metric | Action |
|---|---|---|
| Airports | Traffic +3% | Invest capex |
| Wagamama | ~170 sites | Selective expansion |
| Pubs | ~80 sites | Enhance experience |
| Retail/Digital | Footfall 95%, digital 22% | Scale ops & UX |
What is included in the product
 Detailed Word Document
Comprehensive BCG Matrix for a restaurant group: identifies Stars, Cash Cows, Question Marks, Dogs and recommends invest, hold, or divest.

 Customizable Excel Spreadsheet
One-page Restaurant Group BCG Matrix pinpoints weak units fast, simplifying decisions for busy founders and CFOs.
Cash Cows

Suburban community pubs
Suburban community pubs are established locals with stable weekly traffic and favorable rent profiles; TRG holds a dominant local share (~35%) and records ~60% repeat-visit rates in 2024. Low market growth but high loyalty makes them cash cows; modest capex (≈2–3% of revenue) keeps operations efficient. They generated roughly 40% of group operating cash in FY2024; reinvest in maintenance and staff retention, avoid over-innovation.
Core menu bestsellers
Core menu bestsellers drive roughly 60% of daily transactions across brands, delivering dependable unit volumes even as top-line growth stalls at ~0–1% in 2024. Supply is contract-secured, supporting consistent gross margins near 30% and limiting marketing spend because these items largely sell themselves. Generated profits routinely fund 5–10% of R&D and new site-format trials, de-risking expansion.

Beverage program
Beverage program delivers high-margin draught, cocktails and softs with predictable demand; on-premise beverage gross margins typically range 65–75% in 2024. The market is mature and TRG’s mix and pricing power are solid, requiring limited incremental capex beyond seasonal menu refreshes. Cash flows can bankroll innovation pilots and cover interest and debt service.

Airport breakfast trade
Airport breakfast trade is routine, early-day throughput with consistent demand; TRG’s units at major terminals operate on predictable peaks, delivering high-frequency transactions and low capex growth. In 2024 quick-service breakfast at airports maintained stable volume with industry EBITDA typically 12–20%, and TRG’s entrenched share at key terminals secures steady cash flow. Operations are dialed in; small tweaks lift speed and margin—5–10% uplift from service-line efficiencies is common. Keep it humming — incremental efficiency gains compound into material free cash.
- Routine peaks: morning rush consistency
- Low growth, high margin: EBITDA ~12–20% (2024 industry range)
- Entrenched share: dominant positions at key terminals
- Operational upside: 5–10% margin lift from small efficiencies
Gift cards & corporate vouchers
Gift cards & corporate vouchers are classic cash cows: repeatable, low-growth revenue with favorable cash timing—industry reports show global gift card sales topped $200 billion in 2024, supporting sizeable short-term float and predictable redemptions. Redemption patterns (majority within 6–12 months) are known and manageable, needing little promotion beyond seasonal pushes; maintain distribution partnerships and let the float work.
- Repeatable low-growth
- Strong cash float
- Predictable redemption
- Minimal promo needed
- Maintain partner channels
Suburban pubs and core menu drive steady cash; beverage margins high, $200B gift-card float
TRG cash cows generated ~40% of group operating cash in FY2024; suburban pubs (≈35% local share) require modest capex (≈2–3% revenue) and deliver stable repeat rates (~60%). Core menu drives ~60% of daily transactions with ~30% gross margin; beverage margins 65–75%; airport breakfast EBITDA ~12–20%. Gift cards/global sales ~$200B (2024) provide predictable float with 6–12m redemption.
| Segment | FY2024 metric | Margin/Notes | Contribution |
|---|---|---|---|
| Suburban pubs | 35% local share; 60% repeat | Low growth, low capex 2–3% | 40% cash |
| Core menu | 60% transactions | Gross ~30% | Funds R&D |
| Beverage | High mix | 65–75% margins | High cash |
| Airport | Stable peaks | EBITDA 12–20% | Steady cash |
| Gift cards | $200B global sales | 6–12m redemption | Float |
What You’re Viewing Is Included
Restaurant Group BCG Matrix
The file you’re previewing is the exact BCG Matrix report you’ll receive after purchase. No watermarks, no placeholders—just a fully formatted, analysis-ready document. It’s crafted for strategic clarity and market-driven insight. After purchase the full file is instantly downloadable and editable for presentations or planning. No surprises, just plug-and-play professionalism.

Download Your Competitive Advantage
The Restaurant Group BCG Matrix preview shows which menu lines and brands are winning market share and which are eating into cash—think Stars, Cash Cows, Dogs, and Question Marks mapped to real revenue streams. Want the full picture? Purchase the complete BCG Matrix for quadrant-by-quadrant placements, clear strategic moves, and data-backed recommendations you can act on. You’ll get a ready-to-use Word report plus an Excel summary so you can present, slice, and decide fast.
Stars
Airport concessions
High footfall and captive demand at airports, combined with strong landlord contracts, place TRG’s airport concessions at the front of the pack. IATA forecast for 2024 projects global air traffic slightly above 2019 levels (around +3%), fuelling market growth as travel rebounds and supporting all-daypart revenue. These units still require capex and promotional spend to meet new formats and landlord standards; continued investment defends slots and enables upsell that can mature into cash cows.
Wagamama brand
Wagamama sits as a pan-Asian category leader with strong brand awareness and momentum; the fast-casual Asian segment is growing (c.8% CAGR 2022–27) and Wagamama’s share is high versus peers. Operating c.170 sites in 2024, it remains capital hungry—new sites, tech and delivery integrations—but the expansion flywheel justifies investment: hold share, open smart, let growth convert to yield.
Brunning & Price pubs
Brunning & Price, a premium, community-led estate of c.80 pubs, delivers loyal repeat trade and strong unit economics within Restaurant Group’s BCG matrix. The segment is expanding as guests trade up for experience-led dining, driving higher spend per cover in 2024. Continued capital investment in estate and guest experience is required to stay ahead; protect the brand, prune laggards and double down on proven geographies.
High-traffic retail clusters
High-traffic retail clusters—leisure-park and shopping-centre sites that still hum on weekends and events—are Stars in the BCG matrix: TRG’s multi-banner presence captures family occasions and drives outsized weekend share; Springboard reported UK retail footfall at about 95% of 2019 levels in 2024, supporting sustained demand. Continued promo, staffing, and ops discipline are required to keep turns high; expand seating and throughput where demand warrants.
- Weekend/event footfall resilience: ~95% of 2019 (Springboard, 2024)
- Multi-banner share: majority of family occasions, double-digit weekend uplift
- Needs: disciplined promos, staffing, ops to maintain high turns
- Action: stick with winners, add seating/throughput where metrics justify
Digital order & collect
Digital order & collect adoption is growing and TRG captured c.22% of digital orders within its estate in 2024, widening occasions (office nights, quick airport pick-ups) and boosting average check by ~12% through add‑ons; it still needs targeted marketing and UX spend to hit full potential, so fund it as the channel matures into a dependable margin source.
- Adoption: c.22% digital share (2024)
- Revenue impact: +12% AOV from add‑ons
- Action: invest in marketing & UX to scale margin
Airports +3% traffic; fast-casual ~8% CAGR; pubs steady; retail footfall 95%, digital +22%
Airport concessions benefit from IATA 2024 traffic +3% vs 2019, defend slots with capex; Wagamama (c.170 sites in 2024) grows in an ~8% CAGR fast-casual segment but needs expansion spend; Brunning & Price (c.80 pubs) delivers premium repeat trade; retail clusters see c.95% of 2019 footfall (Springboard 2024) and digital orders at c.22% lift AOV ~12%.
| Segment | 2024 metric | Action |
|---|---|---|
| Airports | Traffic +3% | Invest capex |
| Wagamama | ~170 sites | Selective expansion |
| Pubs | ~80 sites | Enhance experience |
| Retail/Digital | Footfall 95%, digital 22% | Scale ops & UX |
What is included in the product
Detailed Word Document
Comprehensive BCG Matrix for a restaurant group: identifies Stars, Cash Cows, Question Marks, Dogs and recommends invest, hold, or divest.
Customizable Excel Spreadsheet
One-page Restaurant Group BCG Matrix pinpoints weak units fast, simplifying decisions for busy founders and CFOs.
Cash Cows
Suburban community pubs
Suburban community pubs are established locals with stable weekly traffic and favorable rent profiles; TRG holds a dominant local share (~35%) and records ~60% repeat-visit rates in 2024. Low market growth but high loyalty makes them cash cows; modest capex (≈2–3% of revenue) keeps operations efficient. They generated roughly 40% of group operating cash in FY2024; reinvest in maintenance and staff retention, avoid over-innovation.
Core menu bestsellers
Core menu bestsellers drive roughly 60% of daily transactions across brands, delivering dependable unit volumes even as top-line growth stalls at ~0–1% in 2024. Supply is contract-secured, supporting consistent gross margins near 30% and limiting marketing spend because these items largely sell themselves. Generated profits routinely fund 5–10% of R&D and new site-format trials, de-risking expansion.
Beverage program
Beverage program delivers high-margin draught, cocktails and softs with predictable demand; on-premise beverage gross margins typically range 65–75% in 2024. The market is mature and TRG’s mix and pricing power are solid, requiring limited incremental capex beyond seasonal menu refreshes. Cash flows can bankroll innovation pilots and cover interest and debt service.
Airport breakfast trade
Airport breakfast trade is routine, early-day throughput with consistent demand; TRG’s units at major terminals operate on predictable peaks, delivering high-frequency transactions and low capex growth. In 2024 quick-service breakfast at airports maintained stable volume with industry EBITDA typically 12–20%, and TRG’s entrenched share at key terminals secures steady cash flow. Operations are dialed in; small tweaks lift speed and margin—5–10% uplift from service-line efficiencies is common. Keep it humming — incremental efficiency gains compound into material free cash.
- Routine peaks: morning rush consistency
- Low growth, high margin: EBITDA ~12–20% (2024 industry range)
- Entrenched share: dominant positions at key terminals
- Operational upside: 5–10% margin lift from small efficiencies
Gift cards & corporate vouchers
Gift cards & corporate vouchers are classic cash cows: repeatable, low-growth revenue with favorable cash timing—industry reports show global gift card sales topped $200 billion in 2024, supporting sizeable short-term float and predictable redemptions. Redemption patterns (majority within 6–12 months) are known and manageable, needing little promotion beyond seasonal pushes; maintain distribution partnerships and let the float work.
- Repeatable low-growth
- Strong cash float
- Predictable redemption
- Minimal promo needed
- Maintain partner channels
Suburban pubs and core menu drive steady cash; beverage margins high, $200B gift-card float
TRG cash cows generated ~40% of group operating cash in FY2024; suburban pubs (≈35% local share) require modest capex (≈2–3% revenue) and deliver stable repeat rates (~60%). Core menu drives ~60% of daily transactions with ~30% gross margin; beverage margins 65–75%; airport breakfast EBITDA ~12–20%. Gift cards/global sales ~$200B (2024) provide predictable float with 6–12m redemption.
| Segment | FY2024 metric | Margin/Notes | Contribution |
|---|---|---|---|
| Suburban pubs | 35% local share; 60% repeat | Low growth, low capex 2–3% | 40% cash |
| Core menu | 60% transactions | Gross ~30% | Funds R&D |
| Beverage | High mix | 65–75% margins | High cash |
| Airport | Stable peaks | EBITDA 12–20% | Steady cash |
| Gift cards | $200B global sales | 6–12m redemption | Float |
What You’re Viewing Is Included
Restaurant Group BCG Matrix
The file you’re previewing is the exact BCG Matrix report you’ll receive after purchase. No watermarks, no placeholders—just a fully formatted, analysis-ready document. It’s crafted for strategic clarity and market-driven insight. After purchase the full file is instantly downloadable and editable for presentations or planning. No surprises, just plug-and-play professionalism.
Description
Download Your Competitive Advantage
The Restaurant Group BCG Matrix preview shows which menu lines and brands are winning market share and which are eating into cash—think Stars, Cash Cows, Dogs, and Question Marks mapped to real revenue streams. Want the full picture? Purchase the complete BCG Matrix for quadrant-by-quadrant placements, clear strategic moves, and data-backed recommendations you can act on. You’ll get a ready-to-use Word report plus an Excel summary so you can present, slice, and decide fast.
Stars
Airport concessions
High footfall and captive demand at airports, combined with strong landlord contracts, place TRG’s airport concessions at the front of the pack. IATA forecast for 2024 projects global air traffic slightly above 2019 levels (around +3%), fuelling market growth as travel rebounds and supporting all-daypart revenue. These units still require capex and promotional spend to meet new formats and landlord standards; continued investment defends slots and enables upsell that can mature into cash cows.
Wagamama brand
Wagamama sits as a pan-Asian category leader with strong brand awareness and momentum; the fast-casual Asian segment is growing (c.8% CAGR 2022–27) and Wagamama’s share is high versus peers. Operating c.170 sites in 2024, it remains capital hungry—new sites, tech and delivery integrations—but the expansion flywheel justifies investment: hold share, open smart, let growth convert to yield.
Brunning & Price pubs
Brunning & Price, a premium, community-led estate of c.80 pubs, delivers loyal repeat trade and strong unit economics within Restaurant Group’s BCG matrix. The segment is expanding as guests trade up for experience-led dining, driving higher spend per cover in 2024. Continued capital investment in estate and guest experience is required to stay ahead; protect the brand, prune laggards and double down on proven geographies.
High-traffic retail clusters
High-traffic retail clusters—leisure-park and shopping-centre sites that still hum on weekends and events—are Stars in the BCG matrix: TRG’s multi-banner presence captures family occasions and drives outsized weekend share; Springboard reported UK retail footfall at about 95% of 2019 levels in 2024, supporting sustained demand. Continued promo, staffing, and ops discipline are required to keep turns high; expand seating and throughput where demand warrants.
- Weekend/event footfall resilience: ~95% of 2019 (Springboard, 2024)
- Multi-banner share: majority of family occasions, double-digit weekend uplift
- Needs: disciplined promos, staffing, ops to maintain high turns
- Action: stick with winners, add seating/throughput where metrics justify
Digital order & collect
Digital order & collect adoption is growing and TRG captured c.22% of digital orders within its estate in 2024, widening occasions (office nights, quick airport pick-ups) and boosting average check by ~12% through add‑ons; it still needs targeted marketing and UX spend to hit full potential, so fund it as the channel matures into a dependable margin source.
- Adoption: c.22% digital share (2024)
- Revenue impact: +12% AOV from add‑ons
- Action: invest in marketing & UX to scale margin
Airports +3% traffic; fast-casual ~8% CAGR; pubs steady; retail footfall 95%, digital +22%
Airport concessions benefit from IATA 2024 traffic +3% vs 2019, defend slots with capex; Wagamama (c.170 sites in 2024) grows in an ~8% CAGR fast-casual segment but needs expansion spend; Brunning & Price (c.80 pubs) delivers premium repeat trade; retail clusters see c.95% of 2019 footfall (Springboard 2024) and digital orders at c.22% lift AOV ~12%.
| Segment | 2024 metric | Action |
|---|---|---|
| Airports | Traffic +3% | Invest capex |
| Wagamama | ~170 sites | Selective expansion |
| Pubs | ~80 sites | Enhance experience |
| Retail/Digital | Footfall 95%, digital 22% | Scale ops & UX |
What is included in the product
Detailed Word Document
Comprehensive BCG Matrix for a restaurant group: identifies Stars, Cash Cows, Question Marks, Dogs and recommends invest, hold, or divest.
Customizable Excel Spreadsheet
One-page Restaurant Group BCG Matrix pinpoints weak units fast, simplifying decisions for busy founders and CFOs.
Cash Cows
Suburban community pubs
Suburban community pubs are established locals with stable weekly traffic and favorable rent profiles; TRG holds a dominant local share (~35%) and records ~60% repeat-visit rates in 2024. Low market growth but high loyalty makes them cash cows; modest capex (≈2–3% of revenue) keeps operations efficient. They generated roughly 40% of group operating cash in FY2024; reinvest in maintenance and staff retention, avoid over-innovation.
Core menu bestsellers
Core menu bestsellers drive roughly 60% of daily transactions across brands, delivering dependable unit volumes even as top-line growth stalls at ~0–1% in 2024. Supply is contract-secured, supporting consistent gross margins near 30% and limiting marketing spend because these items largely sell themselves. Generated profits routinely fund 5–10% of R&D and new site-format trials, de-risking expansion.
Beverage program
Beverage program delivers high-margin draught, cocktails and softs with predictable demand; on-premise beverage gross margins typically range 65–75% in 2024. The market is mature and TRG’s mix and pricing power are solid, requiring limited incremental capex beyond seasonal menu refreshes. Cash flows can bankroll innovation pilots and cover interest and debt service.
Airport breakfast trade
Airport breakfast trade is routine, early-day throughput with consistent demand; TRG’s units at major terminals operate on predictable peaks, delivering high-frequency transactions and low capex growth. In 2024 quick-service breakfast at airports maintained stable volume with industry EBITDA typically 12–20%, and TRG’s entrenched share at key terminals secures steady cash flow. Operations are dialed in; small tweaks lift speed and margin—5–10% uplift from service-line efficiencies is common. Keep it humming — incremental efficiency gains compound into material free cash.
- Routine peaks: morning rush consistency
- Low growth, high margin: EBITDA ~12–20% (2024 industry range)
- Entrenched share: dominant positions at key terminals
- Operational upside: 5–10% margin lift from small efficiencies
Gift cards & corporate vouchers
Gift cards & corporate vouchers are classic cash cows: repeatable, low-growth revenue with favorable cash timing—industry reports show global gift card sales topped $200 billion in 2024, supporting sizeable short-term float and predictable redemptions. Redemption patterns (majority within 6–12 months) are known and manageable, needing little promotion beyond seasonal pushes; maintain distribution partnerships and let the float work.
- Repeatable low-growth
- Strong cash float
- Predictable redemption
- Minimal promo needed
- Maintain partner channels
Suburban pubs and core menu drive steady cash; beverage margins high, $200B gift-card float
TRG cash cows generated ~40% of group operating cash in FY2024; suburban pubs (≈35% local share) require modest capex (≈2–3% revenue) and deliver stable repeat rates (~60%). Core menu drives ~60% of daily transactions with ~30% gross margin; beverage margins 65–75%; airport breakfast EBITDA ~12–20%. Gift cards/global sales ~$200B (2024) provide predictable float with 6–12m redemption.
| Segment | FY2024 metric | Margin/Notes | Contribution |
|---|---|---|---|
| Suburban pubs | 35% local share; 60% repeat | Low growth, low capex 2–3% | 40% cash |
| Core menu | 60% transactions | Gross ~30% | Funds R&D |
| Beverage | High mix | 65–75% margins | High cash |
| Airport | Stable peaks | EBITDA 12–20% | Steady cash |
| Gift cards | $200B global sales | 6–12m redemption | Float |
What You’re Viewing Is Included
Restaurant Group BCG Matrix
The file you’re previewing is the exact BCG Matrix report you’ll receive after purchase. No watermarks, no placeholders—just a fully formatted, analysis-ready document. It’s crafted for strategic clarity and market-driven insight. After purchase the full file is instantly downloadable and editable for presentations or planning. No surprises, just plug-and-play professionalism.











