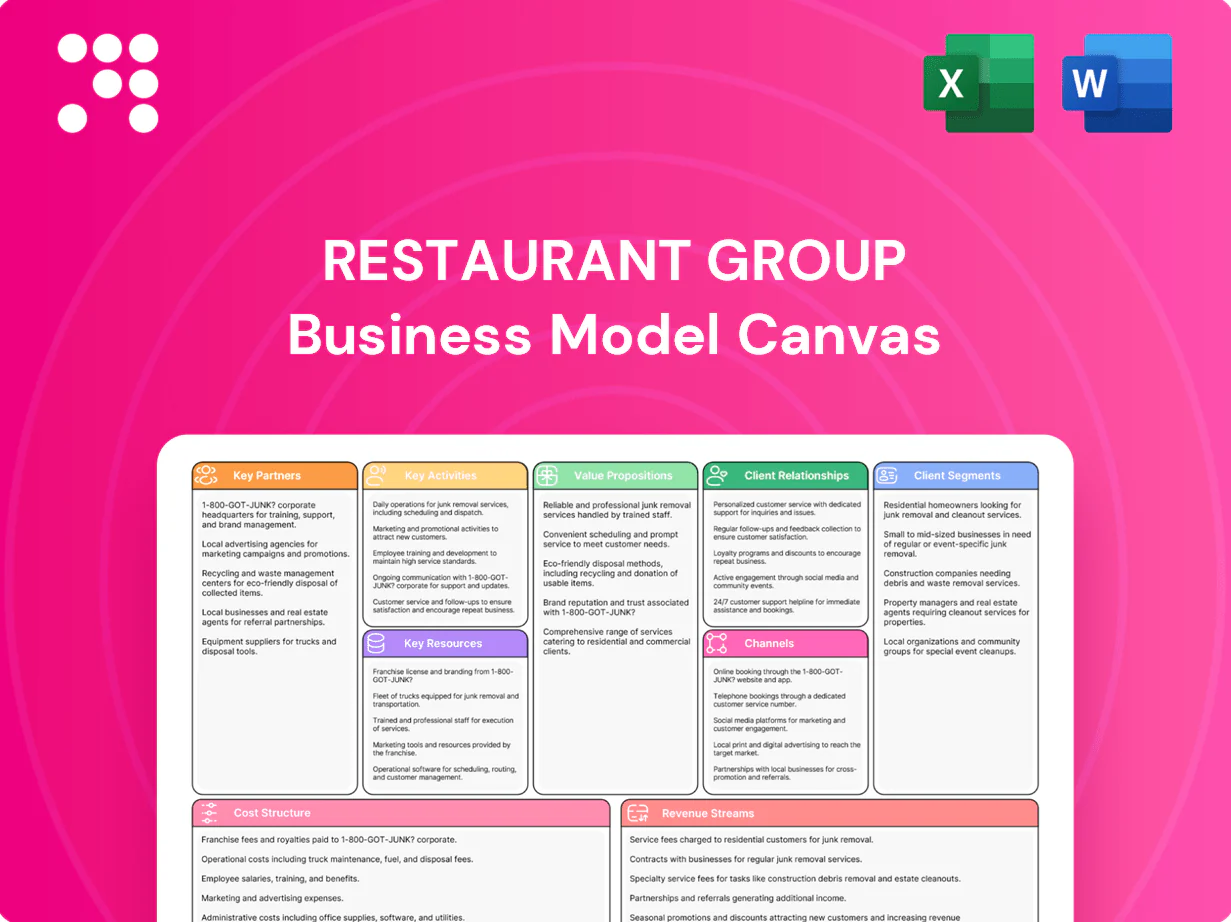
Restaurant Group Business Model Canvas

Business Model Canvas Playbook for Hospitality Groups: Investor-ready & Adaptable
Unlock the full strategic blueprint behind Restaurant Group’s business model with our detailed Business Model Canvas, showing how it creates value, scales operations, and captures market share. Ideal for investors, consultants, and founders seeking actionable insights. Download the complete Word and Excel files for a section-by-section playbook you can adapt immediately.
Partnerships

Landlords & Airport Authorities
Anchor sites in leisure parks, shopping centres, high streets and airports depend on long-term landlord and concession agreements (commonly 5–25 years) to secure premium footfall and negotiated fixed or turnover-linked rent structures. Airport authorities grant behind-security and airside access critical for sales—IATA noted 2024 passenger traffic recovered to roughly 80–90% of 2019 levels—while strong landlord ties reduce site churn and smooth expansion or refurbishment cycles.
Food & Beverage Suppliers
Strategic sourcing of fresh, ambient and beverage lines via national distributors (Sysco/US Foods ~40% market share) and craft brewers (craft beer ~14% share in 2024) ensures quality, consistency and 3–7% cost savings from volume commitments. Supplier collaboration enables menu innovation, seasonal rotations and ESG traceability, while SLA-driven logistics cut stockouts by up to 30% and protect margins.

Delivery & Aggregator Platforms
Integration with leading delivery apps extends reach beyond on-premise traffic, with third-party channels accounting for a substantial share of off-premise orders; the global food delivery market was valued near 300 billion USD in 2024. Co-marketing, data sharing and promo mechanics commonly drive incremental orders—platform campaigns often lift weekly orders by roughly 10–20%. Operational SLAs, standardized packaging and streamlined delivery handoff preserve food quality and reduce complaints. Commercial terms in 2024 typically balanced commission rates of 15–30% against clear customer acquisition and lifetime-value metrics.

Technology & Payments Providers
Integrated POS, kitchen display systems, inventory and workforce tools enable scalable operations, cutting ticket times ~25% and raising table turns ~15% (2024 industry surveys). Payment gateways with fraud controls plus QR/pay-at-table (≈48% chain adoption in 2024) speed checkout and lift conversion. Data platforms and CRM drive personalization and a 3–5% AOV uplift while reliable vendors maintain ~99.9% uptime, reducing downtime and improving guest experience.
- POS/KDS: scalable ops, −25% ticket time
- Payments: QR/pay-at-table ≈48% (2024), higher conversion
- Data/CRM: 3–5% AOV lift
- Vendors: ~99.9% uptime, less downtime
Marketing, Media & Loyalty Partners
Collaborations with media agencies, gift card networks and loyalty ecosystems amplify brand reach by enabling targeted, data-driven promotions and incremental revenue streams. Joint campaigns with cinemas, leisure venues and travel partners capture occasion-led demand and extend weekday footfall. Affiliates and influencers drive targeted awareness and measurable conversion while cross-brand promotions increase visit frequency and average basket size.
- Media agencies: targeted reach
- Gift cards: cashflow & GTV
- Loyalty: repeat visits
- Cinemas/travel: occasion demand
- Affiliates/influencers: conversion
Airports at 80-90% pax; delivery apps and tech lift reach, margins and AOV
Landlords/airports, national distributors and craft suppliers secure sites and margins (airport traffic ≈80–90% of 2019 in 2024; Sysco/US Foods ~40% share); delivery apps (~$300bn market 2024, 15–30% commission) and tech partners (QR/pay-at-table ≈48%, POS uptime ~99.9%) expand reach, cut costs and lift AOV 3–5%.
| Partner | Role | 2024 metric |
|---|---|---|
| Landlords/Airports | Sites/access | 80–90% pax vs 2019 |
| Distributors | Supply/cost | Sysco/US Foods ~40% |
| Delivery apps | Off‑premise sales | $300bn market; 15–30% fees |
| Tech vendors | Ops/data | QR ≈48%; uptime ~99.9% |
What is included in the product
 Detailed Word Document
A focused Business Model Canvas for a restaurant group mapping nine blocks—customer segments, value propositions, channels, customer relationships, revenue streams, key resources, activities, partners, and cost structure—aligned to operational realities and growth plans. Ideal for presentations, funding, and strategic decisions with linked competitive analysis and SWOT insights.

 Customizable Excel Spreadsheet
One-page editable canvas that clarifies revenue streams, cost drivers, and operational bottlenecks for restaurant groups, saving hours of formatting and enabling fast, board-ready strategy reviews and team alignment.
Activities

Restaurant & Pub Operations Excellence
Daily service, food safety and staffing drive satisfaction; 2024 benchmarks target food cost 28–35% and labor 28–32% of sales to protect margins. SOPs and audits deliver consistency across brands and sites; capacity management balances ~30% delivery mix with walk-ins and bookings. Continuous training sustains speed, 95% on-time service goals, quality and upsell performance.
Menu Development & Pricing
Culinary R&D aligns flavor, cost, and kitchen throughput to maintain consistent plate times and cost-of-goods targets, with menu engineering often improving margins by 8–12% through SKU rationalization. Seasonal updates and LTOs drive relevance—Technomic 2024 found 60% of diners seek new menu items. Pricing and bundling optimize perceived value and margins, while dietary, allergen, and sustainability rules are embedded in design.

Site Management & Network Optimization
Proactive lease negotiation, targeted refurbishments and a 12-month pipeline roadmap strengthen the estate and reduce churn; performance reviews using monthly LFL and EBITDA metrics guide investment, relocation or exit decisions. Zonal demand planning aligns staffing and inventory to local trade peaks; airport scheduling is synchronized with IATA 2024 passenger flows (~90% of 2019) and airline timetables to maximize capture.

Digital Ordering & Delivery Operations
Digital ordering blends click-and-collect, table ordering and aggregator integrations to widen reach while balancing channel cost—third-party commissions averaged 20–30% in 2024. Tight dispatch workflows, standardized packaging specs and dedicated handoff zones preserve temperature and presentation. Off-premise menus are curated for speed and travel resilience, and closed-loop data on availability, prep times and promotions refines operations.
- Click-and-collect, table ordering, aggregators
- Dispatch, packaging, handoff zones
- Off-premise menu curation
- Data loops: availability, prep times, promos
Procurement & Supply Chain Management
Centrally negotiated contracts cut COGS volatility and delivered an average 3% food-cost saving in 2024 across multiunit groups; demand forecasting plus backhaul logistics sustain 10–20% lower stockouts and reduce waste by ~18%. Regular compliance audits enforce food-safety and ESG standards; supplier scorecards boost on-time delivery and product innovation.
- COGS: −3% (2024)
- Waste: −18%
- Stockouts: −10–20%
- Scorecards: improved reliability
2024 ops targets: Food cost 28–35%, Labor 28–32%, Delivery ~30%
Daily ops focus on food safety, staffing and SOPs to hit 2024 targets: food cost 28–35%, labor 28–32%, delivery mix ~30% and 95% on-time service. Culinary R&D and menu engineering lift margins 8–12%; third-party commissions 20–30%. Central procurement cut COGS 3%, waste −18% and stockouts −10–20% in 2024.
| Metric | 2024 |
|---|---|
| Food cost | 28–35% |
| Labor | 28–32% |
| Delivery mix | ~30% |
| Third-party fees | 20–30% |
| COGS saving | −3% |
| Waste | −18% |
| Stockouts | −10–20% |
Full Document Unlocks After Purchase
Business Model Canvas
The Restaurant Group Business Model Canvas you’re previewing is the actual deliverable, not a mockup—what you see is taken directly from the final file. After purchase you’ll receive this same document in editable formats (Word and Excel), complete with all sections and content. It’s ready to edit, present, and apply with no hidden layouts or surprises.

Business Model Canvas Playbook for Hospitality Groups: Investor-ready & Adaptable
Unlock the full strategic blueprint behind Restaurant Group’s business model with our detailed Business Model Canvas, showing how it creates value, scales operations, and captures market share. Ideal for investors, consultants, and founders seeking actionable insights. Download the complete Word and Excel files for a section-by-section playbook you can adapt immediately.
Partnerships
Landlords & Airport Authorities
Anchor sites in leisure parks, shopping centres, high streets and airports depend on long-term landlord and concession agreements (commonly 5–25 years) to secure premium footfall and negotiated fixed or turnover-linked rent structures. Airport authorities grant behind-security and airside access critical for sales—IATA noted 2024 passenger traffic recovered to roughly 80–90% of 2019 levels—while strong landlord ties reduce site churn and smooth expansion or refurbishment cycles.
Food & Beverage Suppliers
Strategic sourcing of fresh, ambient and beverage lines via national distributors (Sysco/US Foods ~40% market share) and craft brewers (craft beer ~14% share in 2024) ensures quality, consistency and 3–7% cost savings from volume commitments. Supplier collaboration enables menu innovation, seasonal rotations and ESG traceability, while SLA-driven logistics cut stockouts by up to 30% and protect margins.
Delivery & Aggregator Platforms
Integration with leading delivery apps extends reach beyond on-premise traffic, with third-party channels accounting for a substantial share of off-premise orders; the global food delivery market was valued near 300 billion USD in 2024. Co-marketing, data sharing and promo mechanics commonly drive incremental orders—platform campaigns often lift weekly orders by roughly 10–20%. Operational SLAs, standardized packaging and streamlined delivery handoff preserve food quality and reduce complaints. Commercial terms in 2024 typically balanced commission rates of 15–30% against clear customer acquisition and lifetime-value metrics.
Technology & Payments Providers
Integrated POS, kitchen display systems, inventory and workforce tools enable scalable operations, cutting ticket times ~25% and raising table turns ~15% (2024 industry surveys). Payment gateways with fraud controls plus QR/pay-at-table (≈48% chain adoption in 2024) speed checkout and lift conversion. Data platforms and CRM drive personalization and a 3–5% AOV uplift while reliable vendors maintain ~99.9% uptime, reducing downtime and improving guest experience.
- POS/KDS: scalable ops, −25% ticket time
- Payments: QR/pay-at-table ≈48% (2024), higher conversion
- Data/CRM: 3–5% AOV lift
- Vendors: ~99.9% uptime, less downtime
Marketing, Media & Loyalty Partners
Collaborations with media agencies, gift card networks and loyalty ecosystems amplify brand reach by enabling targeted, data-driven promotions and incremental revenue streams. Joint campaigns with cinemas, leisure venues and travel partners capture occasion-led demand and extend weekday footfall. Affiliates and influencers drive targeted awareness and measurable conversion while cross-brand promotions increase visit frequency and average basket size.
- Media agencies: targeted reach
- Gift cards: cashflow & GTV
- Loyalty: repeat visits
- Cinemas/travel: occasion demand
- Affiliates/influencers: conversion
Airports at 80-90% pax; delivery apps and tech lift reach, margins and AOV
Landlords/airports, national distributors and craft suppliers secure sites and margins (airport traffic ≈80–90% of 2019 in 2024; Sysco/US Foods ~40% share); delivery apps (~$300bn market 2024, 15–30% commission) and tech partners (QR/pay-at-table ≈48%, POS uptime ~99.9%) expand reach, cut costs and lift AOV 3–5%.
| Partner | Role | 2024 metric |
|---|---|---|
| Landlords/Airports | Sites/access | 80–90% pax vs 2019 |
| Distributors | Supply/cost | Sysco/US Foods ~40% |
| Delivery apps | Off‑premise sales | $300bn market; 15–30% fees |
| Tech vendors | Ops/data | QR ≈48%; uptime ~99.9% |
What is included in the product
Detailed Word Document
A focused Business Model Canvas for a restaurant group mapping nine blocks—customer segments, value propositions, channels, customer relationships, revenue streams, key resources, activities, partners, and cost structure—aligned to operational realities and growth plans. Ideal for presentations, funding, and strategic decisions with linked competitive analysis and SWOT insights.
Customizable Excel Spreadsheet
One-page editable canvas that clarifies revenue streams, cost drivers, and operational bottlenecks for restaurant groups, saving hours of formatting and enabling fast, board-ready strategy reviews and team alignment.
Activities
Restaurant & Pub Operations Excellence
Daily service, food safety and staffing drive satisfaction; 2024 benchmarks target food cost 28–35% and labor 28–32% of sales to protect margins. SOPs and audits deliver consistency across brands and sites; capacity management balances ~30% delivery mix with walk-ins and bookings. Continuous training sustains speed, 95% on-time service goals, quality and upsell performance.
Menu Development & Pricing
Culinary R&D aligns flavor, cost, and kitchen throughput to maintain consistent plate times and cost-of-goods targets, with menu engineering often improving margins by 8–12% through SKU rationalization. Seasonal updates and LTOs drive relevance—Technomic 2024 found 60% of diners seek new menu items. Pricing and bundling optimize perceived value and margins, while dietary, allergen, and sustainability rules are embedded in design.
Site Management & Network Optimization
Proactive lease negotiation, targeted refurbishments and a 12-month pipeline roadmap strengthen the estate and reduce churn; performance reviews using monthly LFL and EBITDA metrics guide investment, relocation or exit decisions. Zonal demand planning aligns staffing and inventory to local trade peaks; airport scheduling is synchronized with IATA 2024 passenger flows (~90% of 2019) and airline timetables to maximize capture.
Digital Ordering & Delivery Operations
Digital ordering blends click-and-collect, table ordering and aggregator integrations to widen reach while balancing channel cost—third-party commissions averaged 20–30% in 2024. Tight dispatch workflows, standardized packaging specs and dedicated handoff zones preserve temperature and presentation. Off-premise menus are curated for speed and travel resilience, and closed-loop data on availability, prep times and promotions refines operations.
- Click-and-collect, table ordering, aggregators
- Dispatch, packaging, handoff zones
- Off-premise menu curation
- Data loops: availability, prep times, promos
Procurement & Supply Chain Management
Centrally negotiated contracts cut COGS volatility and delivered an average 3% food-cost saving in 2024 across multiunit groups; demand forecasting plus backhaul logistics sustain 10–20% lower stockouts and reduce waste by ~18%. Regular compliance audits enforce food-safety and ESG standards; supplier scorecards boost on-time delivery and product innovation.
- COGS: −3% (2024)
- Waste: −18%
- Stockouts: −10–20%
- Scorecards: improved reliability
2024 ops targets: Food cost 28–35%, Labor 28–32%, Delivery ~30%
Daily ops focus on food safety, staffing and SOPs to hit 2024 targets: food cost 28–35%, labor 28–32%, delivery mix ~30% and 95% on-time service. Culinary R&D and menu engineering lift margins 8–12%; third-party commissions 20–30%. Central procurement cut COGS 3%, waste −18% and stockouts −10–20% in 2024.
| Metric | 2024 |
|---|---|
| Food cost | 28–35% |
| Labor | 28–32% |
| Delivery mix | ~30% |
| Third-party fees | 20–30% |
| COGS saving | −3% |
| Waste | −18% |
| Stockouts | −10–20% |
Full Document Unlocks After Purchase
Business Model Canvas
The Restaurant Group Business Model Canvas you’re previewing is the actual deliverable, not a mockup—what you see is taken directly from the final file. After purchase you’ll receive this same document in editable formats (Word and Excel), complete with all sections and content. It’s ready to edit, present, and apply with no hidden layouts or surprises.
Description
Business Model Canvas Playbook for Hospitality Groups: Investor-ready & Adaptable
Unlock the full strategic blueprint behind Restaurant Group’s business model with our detailed Business Model Canvas, showing how it creates value, scales operations, and captures market share. Ideal for investors, consultants, and founders seeking actionable insights. Download the complete Word and Excel files for a section-by-section playbook you can adapt immediately.
Partnerships
Landlords & Airport Authorities
Anchor sites in leisure parks, shopping centres, high streets and airports depend on long-term landlord and concession agreements (commonly 5–25 years) to secure premium footfall and negotiated fixed or turnover-linked rent structures. Airport authorities grant behind-security and airside access critical for sales—IATA noted 2024 passenger traffic recovered to roughly 80–90% of 2019 levels—while strong landlord ties reduce site churn and smooth expansion or refurbishment cycles.
Food & Beverage Suppliers
Strategic sourcing of fresh, ambient and beverage lines via national distributors (Sysco/US Foods ~40% market share) and craft brewers (craft beer ~14% share in 2024) ensures quality, consistency and 3–7% cost savings from volume commitments. Supplier collaboration enables menu innovation, seasonal rotations and ESG traceability, while SLA-driven logistics cut stockouts by up to 30% and protect margins.
Delivery & Aggregator Platforms
Integration with leading delivery apps extends reach beyond on-premise traffic, with third-party channels accounting for a substantial share of off-premise orders; the global food delivery market was valued near 300 billion USD in 2024. Co-marketing, data sharing and promo mechanics commonly drive incremental orders—platform campaigns often lift weekly orders by roughly 10–20%. Operational SLAs, standardized packaging and streamlined delivery handoff preserve food quality and reduce complaints. Commercial terms in 2024 typically balanced commission rates of 15–30% against clear customer acquisition and lifetime-value metrics.
Technology & Payments Providers
Integrated POS, kitchen display systems, inventory and workforce tools enable scalable operations, cutting ticket times ~25% and raising table turns ~15% (2024 industry surveys). Payment gateways with fraud controls plus QR/pay-at-table (≈48% chain adoption in 2024) speed checkout and lift conversion. Data platforms and CRM drive personalization and a 3–5% AOV uplift while reliable vendors maintain ~99.9% uptime, reducing downtime and improving guest experience.
- POS/KDS: scalable ops, −25% ticket time
- Payments: QR/pay-at-table ≈48% (2024), higher conversion
- Data/CRM: 3–5% AOV lift
- Vendors: ~99.9% uptime, less downtime
Marketing, Media & Loyalty Partners
Collaborations with media agencies, gift card networks and loyalty ecosystems amplify brand reach by enabling targeted, data-driven promotions and incremental revenue streams. Joint campaigns with cinemas, leisure venues and travel partners capture occasion-led demand and extend weekday footfall. Affiliates and influencers drive targeted awareness and measurable conversion while cross-brand promotions increase visit frequency and average basket size.
- Media agencies: targeted reach
- Gift cards: cashflow & GTV
- Loyalty: repeat visits
- Cinemas/travel: occasion demand
- Affiliates/influencers: conversion
Airports at 80-90% pax; delivery apps and tech lift reach, margins and AOV
Landlords/airports, national distributors and craft suppliers secure sites and margins (airport traffic ≈80–90% of 2019 in 2024; Sysco/US Foods ~40% share); delivery apps (~$300bn market 2024, 15–30% commission) and tech partners (QR/pay-at-table ≈48%, POS uptime ~99.9%) expand reach, cut costs and lift AOV 3–5%.
| Partner | Role | 2024 metric |
|---|---|---|
| Landlords/Airports | Sites/access | 80–90% pax vs 2019 |
| Distributors | Supply/cost | Sysco/US Foods ~40% |
| Delivery apps | Off‑premise sales | $300bn market; 15–30% fees |
| Tech vendors | Ops/data | QR ≈48%; uptime ~99.9% |
What is included in the product
Detailed Word Document
A focused Business Model Canvas for a restaurant group mapping nine blocks—customer segments, value propositions, channels, customer relationships, revenue streams, key resources, activities, partners, and cost structure—aligned to operational realities and growth plans. Ideal for presentations, funding, and strategic decisions with linked competitive analysis and SWOT insights.
Customizable Excel Spreadsheet
One-page editable canvas that clarifies revenue streams, cost drivers, and operational bottlenecks for restaurant groups, saving hours of formatting and enabling fast, board-ready strategy reviews and team alignment.
Activities
Restaurant & Pub Operations Excellence
Daily service, food safety and staffing drive satisfaction; 2024 benchmarks target food cost 28–35% and labor 28–32% of sales to protect margins. SOPs and audits deliver consistency across brands and sites; capacity management balances ~30% delivery mix with walk-ins and bookings. Continuous training sustains speed, 95% on-time service goals, quality and upsell performance.
Menu Development & Pricing
Culinary R&D aligns flavor, cost, and kitchen throughput to maintain consistent plate times and cost-of-goods targets, with menu engineering often improving margins by 8–12% through SKU rationalization. Seasonal updates and LTOs drive relevance—Technomic 2024 found 60% of diners seek new menu items. Pricing and bundling optimize perceived value and margins, while dietary, allergen, and sustainability rules are embedded in design.
Site Management & Network Optimization
Proactive lease negotiation, targeted refurbishments and a 12-month pipeline roadmap strengthen the estate and reduce churn; performance reviews using monthly LFL and EBITDA metrics guide investment, relocation or exit decisions. Zonal demand planning aligns staffing and inventory to local trade peaks; airport scheduling is synchronized with IATA 2024 passenger flows (~90% of 2019) and airline timetables to maximize capture.
Digital Ordering & Delivery Operations
Digital ordering blends click-and-collect, table ordering and aggregator integrations to widen reach while balancing channel cost—third-party commissions averaged 20–30% in 2024. Tight dispatch workflows, standardized packaging specs and dedicated handoff zones preserve temperature and presentation. Off-premise menus are curated for speed and travel resilience, and closed-loop data on availability, prep times and promotions refines operations.
- Click-and-collect, table ordering, aggregators
- Dispatch, packaging, handoff zones
- Off-premise menu curation
- Data loops: availability, prep times, promos
Procurement & Supply Chain Management
Centrally negotiated contracts cut COGS volatility and delivered an average 3% food-cost saving in 2024 across multiunit groups; demand forecasting plus backhaul logistics sustain 10–20% lower stockouts and reduce waste by ~18%. Regular compliance audits enforce food-safety and ESG standards; supplier scorecards boost on-time delivery and product innovation.
- COGS: −3% (2024)
- Waste: −18%
- Stockouts: −10–20%
- Scorecards: improved reliability
2024 ops targets: Food cost 28–35%, Labor 28–32%, Delivery ~30%
Daily ops focus on food safety, staffing and SOPs to hit 2024 targets: food cost 28–35%, labor 28–32%, delivery mix ~30% and 95% on-time service. Culinary R&D and menu engineering lift margins 8–12%; third-party commissions 20–30%. Central procurement cut COGS 3%, waste −18% and stockouts −10–20% in 2024.
| Metric | 2024 |
|---|---|
| Food cost | 28–35% |
| Labor | 28–32% |
| Delivery mix | ~30% |
| Third-party fees | 20–30% |
| COGS saving | −3% |
| Waste | −18% |
| Stockouts | −10–20% |
Full Document Unlocks After Purchase
Business Model Canvas
The Restaurant Group Business Model Canvas you’re previewing is the actual deliverable, not a mockup—what you see is taken directly from the final file. After purchase you’ll receive this same document in editable formats (Word and Excel), complete with all sections and content. It’s ready to edit, present, and apply with no hidden layouts or surprises.











