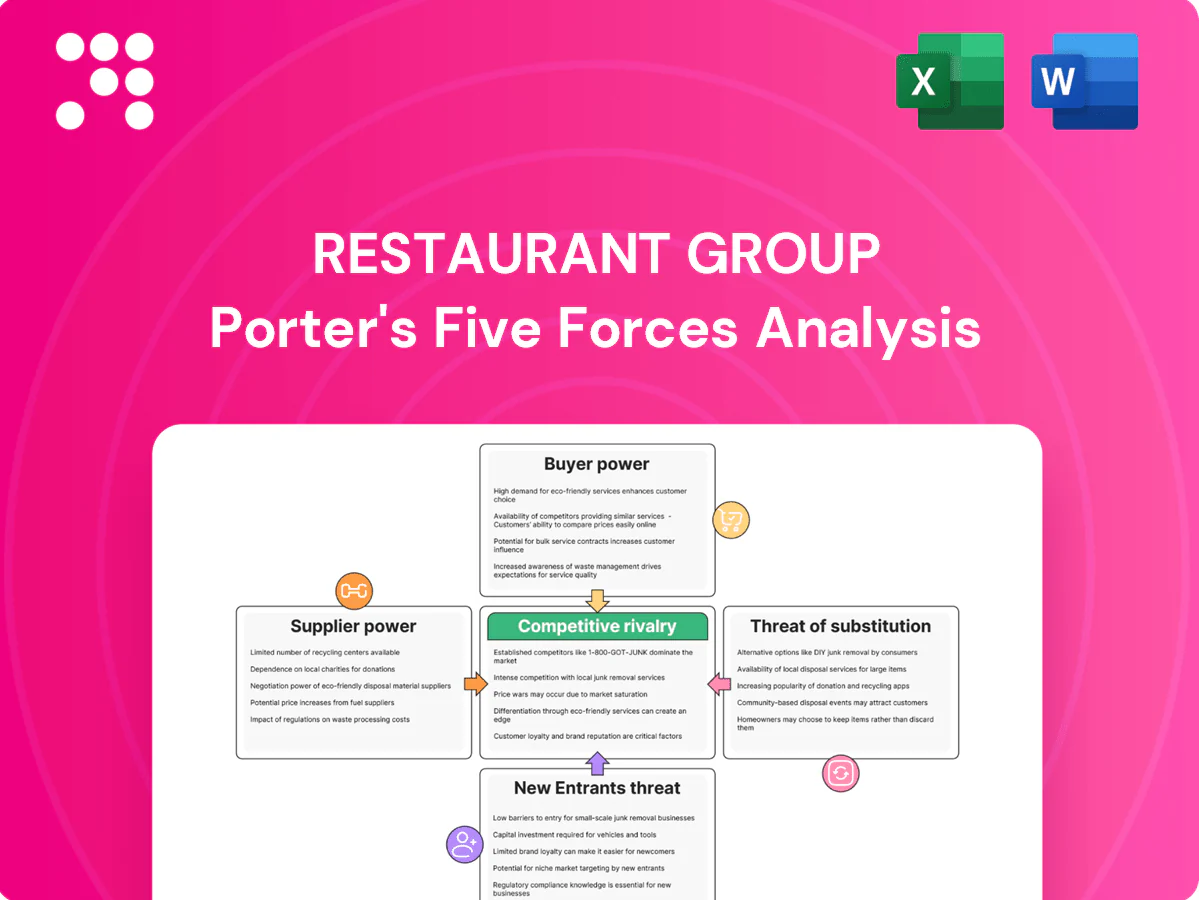
Restaurant Group Porter's Five Forces Analysis

Don't Miss the Bigger Picture
Restaurant Group faces shifting consumer tastes, rising supplier costs, and intense rivalries—this snapshot highlights key pressures on margins and growth. The full Porter's Five Forces Analysis quantifies each force and reveals strategic levers. Unlock the complete report for force-by-force ratings, visuals, and actionable recommendations.
Suppliers Bargaining Power

Fragmented food suppliers
Core food inputs are sourced from numerous UK and EU producers, limiting individual vendor leverage; TRG routinely dual-sources and benchmarks quality and price across suppliers. Seasonal volatility and commodity swings drove UK food price inflation of about 9% in 2024, creating episodic negotiating pressure. Scale contracts and menu engineering mitigate supplier-driven spikes.
Branded beverages & exclusivities
Branded soft drinks, beers and spirits from dominant suppliers like Coca-Cola, PepsiCo and major brewers maintained strong negotiating leverage in 2024, using brand equity to support premium pricing and favorable terms. Pouring-rights and exclusivity agreements raise switching costs for TRG and can lock venues into single-supplier deals. Volume rebates mitigate cost pressure, but brand strength often tilts power to suppliers. TRG offsets this with own-label ranges and rotating tap programs.

Airport & mall landlords as quasi-suppliers
Site access in airports, rail hubs and prime malls is concentrated among a few landlords and concession authorities, who control high-footfall locations serving millions of annual passengers and shoppers. Rents, turnover-based fees and strict fit-out standards give landlords leverage over restaurant operators, and while high traffic can offset cost, contract renewals and concession retendering remain material risks. Strong operational KPIs (sales per sq ft, EBITDA margins, customer throughput) are essential to retain and renegotiate sites.

Logistics and distribution dependence
Logistics and distribution dependence gives suppliers leverage: national distribution partners determine reliability and cost-to-serve, while route density and chilled-chain requirements limit rapid switching and raise switching costs. Fuel, labor and regulatory cost pass-throughs further concentrate bargaining power, though TRG can tender networks and consolidate deliveries to negotiate better rates in 2024.
- National partners: reliability vs cost
- Chilled chain: switching constrained
- Costs: fuel, labor, regulation passed on
- TRG levers: tendering and consolidation
Technology and delivery platforms
Technology and delivery platforms exert strong supplier power: 2024 delivery-aggregator take rates average 20–30% and POS/payment providers charge subscription and processing fees (card rates commonly 1.9–3.5%), with platform-imposed data standards and contracts that can ratchet take rates over time. Integration and API switching costs create durable leverage, while TRG can mitigate risk by scaling direct-order channels and negotiating volume discounts with providers.
- Take rates: 20–30% (2024)
- Card processing: 1.9–3.5% (2024)
- High switching costs = supplier leverage
- Mitigation: direct channels + volume negotiation
Rising food inflation and platform fees squeeze margins; landlords and brands hold leverage
Core food inputs fragmented, limiting vendor leverage; UK food price inflation ~9% in 2024 raised episodic pressure, mitigated by dual-sourcing and menu engineering. Branded drink suppliers and landlords hold strong leverage; pouring-rights and concession rents increase switching costs. Delivery aggregators and POS take rates (20–30%; card fees 1.9–3.5% in 2024) are material margin pressures.
| Category | 2024 metric | Impact |
|---|---|---|
| Food inflation | ~9% | Cost pressure |
| Delivery take rates | 20–30% | Margin squeeze |
| Card fees | 1.9–3.5% | Transaction cost |
| Landlords | High concentration | Rent/fee leverage |
What is included in the product
 Detailed Word Document
Concise Porter's Five Forces assessment of Restaurant Group, revealing competitive intensity, buyer and supplier leverage, threat of substitutes and entry barriers, and strategic vulnerabilities and opportunities for growth.

 Customizable Excel Spreadsheet
A one-sheet Porter's Five Forces for restaurant groups—instantly highlights supplier, buyer, entrant, substitute and rivalry pressures so executives spot vulnerabilities and prioritize actions; easy to customize, copy into decks, and integrate with financial models.
Customers Bargaining Power

Price-sensitive casual diners
UK diners remain price-sensitive: with inflation easing to around 3–4% in 2024 (ONS) but real wages still below pre-2020 levels, consumers trade down in downturns, boosting demand for promotions and value menus. Elastic demand in casual dining raises buyer power, forcing TRG to offer frequent deals while protecting EBITDA margins. Balancing value-led offers with menu engineering and cost controls is essential.
Abundant alternatives nearby
Leisure parks and high streets cluster dozens of food options within short walking distance, increasing choice density. Low switching cost lets guests move to competitors quickly; surveys show about 82% consult online reviews before dining in 2024. Ratings and social proof amplify switching, with higher-rated venues capturing disproportionate bookings. Consistency and distinctive propositions (menu, experience) are key to retention.

Airport captive yet discerning
Airport captive yet discerning: time-pressed travelers reduce bargaining power, especially as global air passenger traffic reached about 4.7 billion in 2024, concentrating demand. International guests still benchmark quality and speed across markets, keeping operators on quality. Visible digital price boards in most terminals limit opaque upsell margins, while service throughput (queue times under 15 minutes target in many airports) drives perceived value.

Digital transparency and reviews
Online menus, pricing, and reviews give diners informed choices—about 82% of consumers consult reviews before dining (BrightLocal 2024), and a Harvard study shows a one-star change can alter revenue by 5–9%, so negative feedback spreads fast and increases buyer leverage on quality and price. Loyalty is fragile without standout CX; active reputation management and CRM programs mitigate churn and preserve margins.
- Online menus/prices: transparency raises switching
- Reviews: 82% consult; 1-star = 5–9% rev impact
- Customer loyalty: fragile vs CX
- Mitigation: reputation management, CRM
Group bookings and corporate spend
Events, tour groups and corporate accounts negotiate volume discounts and can shift sizeable covers across brands and locations, concentrating buyer power during off-peak periods. Corporate travel spend is forecast at about 1.4 trillion USD globally in 2024 (GBTA), increasing leverage for negotiated packages. Tiered packages and contracted SLAs lock repeat business and protect margins.
- Discount pressure from group bookings
- High weekday/off-peak share concentration
- Tiered contracts + SLAs = retention
UK diners trade down: reviews cut revenue; corporate travel concentrates demand
UK diners remain price-sensitive (inflation ~3–4% 2024 ONS) and trade down, boosting demand for promotions and pressuring margins. Choice density and low switching costs (82% consult reviews 2024) increase buyer leverage; a one-star shift can change revenue 5–9%. Airport demand (4.7bn passengers 2024) concentrates covers; corporate travel ($1.4trn 2024) favors contracted discounts and SLAs.
| Metric | 2024 Value |
|---|---|
| UK inflation | 3–4% (ONS) |
| Review influence | 82% consult; 1-star = 5–9% rev |
| Air passengers | 4.7bn |
| Corporate travel | $1.4tn |
Preview the Actual Deliverable
Restaurant Group Porter's Five Forces Analysis
This preview shows the exact Restaurant Group Porter’s Five Forces analysis you'll receive immediately after purchase—no surprises, no placeholders. The file provides a full assessment of competitive rivalry, supplier and buyer power, threat of substitutes and new entrants, and strategic implications. It's professionally formatted and ready for download the moment you buy.

Don't Miss the Bigger Picture
Restaurant Group faces shifting consumer tastes, rising supplier costs, and intense rivalries—this snapshot highlights key pressures on margins and growth. The full Porter's Five Forces Analysis quantifies each force and reveals strategic levers. Unlock the complete report for force-by-force ratings, visuals, and actionable recommendations.
Suppliers Bargaining Power
Fragmented food suppliers
Core food inputs are sourced from numerous UK and EU producers, limiting individual vendor leverage; TRG routinely dual-sources and benchmarks quality and price across suppliers. Seasonal volatility and commodity swings drove UK food price inflation of about 9% in 2024, creating episodic negotiating pressure. Scale contracts and menu engineering mitigate supplier-driven spikes.
Branded beverages & exclusivities
Branded soft drinks, beers and spirits from dominant suppliers like Coca-Cola, PepsiCo and major brewers maintained strong negotiating leverage in 2024, using brand equity to support premium pricing and favorable terms. Pouring-rights and exclusivity agreements raise switching costs for TRG and can lock venues into single-supplier deals. Volume rebates mitigate cost pressure, but brand strength often tilts power to suppliers. TRG offsets this with own-label ranges and rotating tap programs.
Airport & mall landlords as quasi-suppliers
Site access in airports, rail hubs and prime malls is concentrated among a few landlords and concession authorities, who control high-footfall locations serving millions of annual passengers and shoppers. Rents, turnover-based fees and strict fit-out standards give landlords leverage over restaurant operators, and while high traffic can offset cost, contract renewals and concession retendering remain material risks. Strong operational KPIs (sales per sq ft, EBITDA margins, customer throughput) are essential to retain and renegotiate sites.
Logistics and distribution dependence
Logistics and distribution dependence gives suppliers leverage: national distribution partners determine reliability and cost-to-serve, while route density and chilled-chain requirements limit rapid switching and raise switching costs. Fuel, labor and regulatory cost pass-throughs further concentrate bargaining power, though TRG can tender networks and consolidate deliveries to negotiate better rates in 2024.
- National partners: reliability vs cost
- Chilled chain: switching constrained
- Costs: fuel, labor, regulation passed on
- TRG levers: tendering and consolidation
Technology and delivery platforms
Technology and delivery platforms exert strong supplier power: 2024 delivery-aggregator take rates average 20–30% and POS/payment providers charge subscription and processing fees (card rates commonly 1.9–3.5%), with platform-imposed data standards and contracts that can ratchet take rates over time. Integration and API switching costs create durable leverage, while TRG can mitigate risk by scaling direct-order channels and negotiating volume discounts with providers.
- Take rates: 20–30% (2024)
- Card processing: 1.9–3.5% (2024)
- High switching costs = supplier leverage
- Mitigation: direct channels + volume negotiation
Rising food inflation and platform fees squeeze margins; landlords and brands hold leverage
Core food inputs fragmented, limiting vendor leverage; UK food price inflation ~9% in 2024 raised episodic pressure, mitigated by dual-sourcing and menu engineering. Branded drink suppliers and landlords hold strong leverage; pouring-rights and concession rents increase switching costs. Delivery aggregators and POS take rates (20–30%; card fees 1.9–3.5% in 2024) are material margin pressures.
| Category | 2024 metric | Impact |
|---|---|---|
| Food inflation | ~9% | Cost pressure |
| Delivery take rates | 20–30% | Margin squeeze |
| Card fees | 1.9–3.5% | Transaction cost |
| Landlords | High concentration | Rent/fee leverage |
What is included in the product
Detailed Word Document
Concise Porter's Five Forces assessment of Restaurant Group, revealing competitive intensity, buyer and supplier leverage, threat of substitutes and entry barriers, and strategic vulnerabilities and opportunities for growth.
Customizable Excel Spreadsheet
A one-sheet Porter's Five Forces for restaurant groups—instantly highlights supplier, buyer, entrant, substitute and rivalry pressures so executives spot vulnerabilities and prioritize actions; easy to customize, copy into decks, and integrate with financial models.
Customers Bargaining Power
Price-sensitive casual diners
UK diners remain price-sensitive: with inflation easing to around 3–4% in 2024 (ONS) but real wages still below pre-2020 levels, consumers trade down in downturns, boosting demand for promotions and value menus. Elastic demand in casual dining raises buyer power, forcing TRG to offer frequent deals while protecting EBITDA margins. Balancing value-led offers with menu engineering and cost controls is essential.
Abundant alternatives nearby
Leisure parks and high streets cluster dozens of food options within short walking distance, increasing choice density. Low switching cost lets guests move to competitors quickly; surveys show about 82% consult online reviews before dining in 2024. Ratings and social proof amplify switching, with higher-rated venues capturing disproportionate bookings. Consistency and distinctive propositions (menu, experience) are key to retention.
Airport captive yet discerning
Airport captive yet discerning: time-pressed travelers reduce bargaining power, especially as global air passenger traffic reached about 4.7 billion in 2024, concentrating demand. International guests still benchmark quality and speed across markets, keeping operators on quality. Visible digital price boards in most terminals limit opaque upsell margins, while service throughput (queue times under 15 minutes target in many airports) drives perceived value.
Digital transparency and reviews
Online menus, pricing, and reviews give diners informed choices—about 82% of consumers consult reviews before dining (BrightLocal 2024), and a Harvard study shows a one-star change can alter revenue by 5–9%, so negative feedback spreads fast and increases buyer leverage on quality and price. Loyalty is fragile without standout CX; active reputation management and CRM programs mitigate churn and preserve margins.
- Online menus/prices: transparency raises switching
- Reviews: 82% consult; 1-star = 5–9% rev impact
- Customer loyalty: fragile vs CX
- Mitigation: reputation management, CRM
Group bookings and corporate spend
Events, tour groups and corporate accounts negotiate volume discounts and can shift sizeable covers across brands and locations, concentrating buyer power during off-peak periods. Corporate travel spend is forecast at about 1.4 trillion USD globally in 2024 (GBTA), increasing leverage for negotiated packages. Tiered packages and contracted SLAs lock repeat business and protect margins.
- Discount pressure from group bookings
- High weekday/off-peak share concentration
- Tiered contracts + SLAs = retention
UK diners trade down: reviews cut revenue; corporate travel concentrates demand
UK diners remain price-sensitive (inflation ~3–4% 2024 ONS) and trade down, boosting demand for promotions and pressuring margins. Choice density and low switching costs (82% consult reviews 2024) increase buyer leverage; a one-star shift can change revenue 5–9%. Airport demand (4.7bn passengers 2024) concentrates covers; corporate travel ($1.4trn 2024) favors contracted discounts and SLAs.
| Metric | 2024 Value |
|---|---|
| UK inflation | 3–4% (ONS) |
| Review influence | 82% consult; 1-star = 5–9% rev |
| Air passengers | 4.7bn |
| Corporate travel | $1.4tn |
Preview the Actual Deliverable
Restaurant Group Porter's Five Forces Analysis
This preview shows the exact Restaurant Group Porter’s Five Forces analysis you'll receive immediately after purchase—no surprises, no placeholders. The file provides a full assessment of competitive rivalry, supplier and buyer power, threat of substitutes and new entrants, and strategic implications. It's professionally formatted and ready for download the moment you buy.
Original: $10.00
-65%$10.00
$3.50Description
Don't Miss the Bigger Picture
Restaurant Group faces shifting consumer tastes, rising supplier costs, and intense rivalries—this snapshot highlights key pressures on margins and growth. The full Porter's Five Forces Analysis quantifies each force and reveals strategic levers. Unlock the complete report for force-by-force ratings, visuals, and actionable recommendations.
Suppliers Bargaining Power
Fragmented food suppliers
Core food inputs are sourced from numerous UK and EU producers, limiting individual vendor leverage; TRG routinely dual-sources and benchmarks quality and price across suppliers. Seasonal volatility and commodity swings drove UK food price inflation of about 9% in 2024, creating episodic negotiating pressure. Scale contracts and menu engineering mitigate supplier-driven spikes.
Branded beverages & exclusivities
Branded soft drinks, beers and spirits from dominant suppliers like Coca-Cola, PepsiCo and major brewers maintained strong negotiating leverage in 2024, using brand equity to support premium pricing and favorable terms. Pouring-rights and exclusivity agreements raise switching costs for TRG and can lock venues into single-supplier deals. Volume rebates mitigate cost pressure, but brand strength often tilts power to suppliers. TRG offsets this with own-label ranges and rotating tap programs.
Airport & mall landlords as quasi-suppliers
Site access in airports, rail hubs and prime malls is concentrated among a few landlords and concession authorities, who control high-footfall locations serving millions of annual passengers and shoppers. Rents, turnover-based fees and strict fit-out standards give landlords leverage over restaurant operators, and while high traffic can offset cost, contract renewals and concession retendering remain material risks. Strong operational KPIs (sales per sq ft, EBITDA margins, customer throughput) are essential to retain and renegotiate sites.
Logistics and distribution dependence
Logistics and distribution dependence gives suppliers leverage: national distribution partners determine reliability and cost-to-serve, while route density and chilled-chain requirements limit rapid switching and raise switching costs. Fuel, labor and regulatory cost pass-throughs further concentrate bargaining power, though TRG can tender networks and consolidate deliveries to negotiate better rates in 2024.
- National partners: reliability vs cost
- Chilled chain: switching constrained
- Costs: fuel, labor, regulation passed on
- TRG levers: tendering and consolidation
Technology and delivery platforms
Technology and delivery platforms exert strong supplier power: 2024 delivery-aggregator take rates average 20–30% and POS/payment providers charge subscription and processing fees (card rates commonly 1.9–3.5%), with platform-imposed data standards and contracts that can ratchet take rates over time. Integration and API switching costs create durable leverage, while TRG can mitigate risk by scaling direct-order channels and negotiating volume discounts with providers.
- Take rates: 20–30% (2024)
- Card processing: 1.9–3.5% (2024)
- High switching costs = supplier leverage
- Mitigation: direct channels + volume negotiation
Rising food inflation and platform fees squeeze margins; landlords and brands hold leverage
Core food inputs fragmented, limiting vendor leverage; UK food price inflation ~9% in 2024 raised episodic pressure, mitigated by dual-sourcing and menu engineering. Branded drink suppliers and landlords hold strong leverage; pouring-rights and concession rents increase switching costs. Delivery aggregators and POS take rates (20–30%; card fees 1.9–3.5% in 2024) are material margin pressures.
| Category | 2024 metric | Impact |
|---|---|---|
| Food inflation | ~9% | Cost pressure |
| Delivery take rates | 20–30% | Margin squeeze |
| Card fees | 1.9–3.5% | Transaction cost |
| Landlords | High concentration | Rent/fee leverage |
What is included in the product
Detailed Word Document
Concise Porter's Five Forces assessment of Restaurant Group, revealing competitive intensity, buyer and supplier leverage, threat of substitutes and entry barriers, and strategic vulnerabilities and opportunities for growth.
Customizable Excel Spreadsheet
A one-sheet Porter's Five Forces for restaurant groups—instantly highlights supplier, buyer, entrant, substitute and rivalry pressures so executives spot vulnerabilities and prioritize actions; easy to customize, copy into decks, and integrate with financial models.
Customers Bargaining Power
Price-sensitive casual diners
UK diners remain price-sensitive: with inflation easing to around 3–4% in 2024 (ONS) but real wages still below pre-2020 levels, consumers trade down in downturns, boosting demand for promotions and value menus. Elastic demand in casual dining raises buyer power, forcing TRG to offer frequent deals while protecting EBITDA margins. Balancing value-led offers with menu engineering and cost controls is essential.
Abundant alternatives nearby
Leisure parks and high streets cluster dozens of food options within short walking distance, increasing choice density. Low switching cost lets guests move to competitors quickly; surveys show about 82% consult online reviews before dining in 2024. Ratings and social proof amplify switching, with higher-rated venues capturing disproportionate bookings. Consistency and distinctive propositions (menu, experience) are key to retention.
Airport captive yet discerning
Airport captive yet discerning: time-pressed travelers reduce bargaining power, especially as global air passenger traffic reached about 4.7 billion in 2024, concentrating demand. International guests still benchmark quality and speed across markets, keeping operators on quality. Visible digital price boards in most terminals limit opaque upsell margins, while service throughput (queue times under 15 minutes target in many airports) drives perceived value.
Digital transparency and reviews
Online menus, pricing, and reviews give diners informed choices—about 82% of consumers consult reviews before dining (BrightLocal 2024), and a Harvard study shows a one-star change can alter revenue by 5–9%, so negative feedback spreads fast and increases buyer leverage on quality and price. Loyalty is fragile without standout CX; active reputation management and CRM programs mitigate churn and preserve margins.
- Online menus/prices: transparency raises switching
- Reviews: 82% consult; 1-star = 5–9% rev impact
- Customer loyalty: fragile vs CX
- Mitigation: reputation management, CRM
Group bookings and corporate spend
Events, tour groups and corporate accounts negotiate volume discounts and can shift sizeable covers across brands and locations, concentrating buyer power during off-peak periods. Corporate travel spend is forecast at about 1.4 trillion USD globally in 2024 (GBTA), increasing leverage for negotiated packages. Tiered packages and contracted SLAs lock repeat business and protect margins.
- Discount pressure from group bookings
- High weekday/off-peak share concentration
- Tiered contracts + SLAs = retention
UK diners trade down: reviews cut revenue; corporate travel concentrates demand
UK diners remain price-sensitive (inflation ~3–4% 2024 ONS) and trade down, boosting demand for promotions and pressuring margins. Choice density and low switching costs (82% consult reviews 2024) increase buyer leverage; a one-star shift can change revenue 5–9%. Airport demand (4.7bn passengers 2024) concentrates covers; corporate travel ($1.4trn 2024) favors contracted discounts and SLAs.
| Metric | 2024 Value |
|---|---|
| UK inflation | 3–4% (ONS) |
| Review influence | 82% consult; 1-star = 5–9% rev |
| Air passengers | 4.7bn |
| Corporate travel | $1.4tn |
Preview the Actual Deliverable
Restaurant Group Porter's Five Forces Analysis
This preview shows the exact Restaurant Group Porter’s Five Forces analysis you'll receive immediately after purchase—no surprises, no placeholders. The file provides a full assessment of competitive rivalry, supplier and buyer power, threat of substitutes and new entrants, and strategic implications. It's professionally formatted and ready for download the moment you buy.











