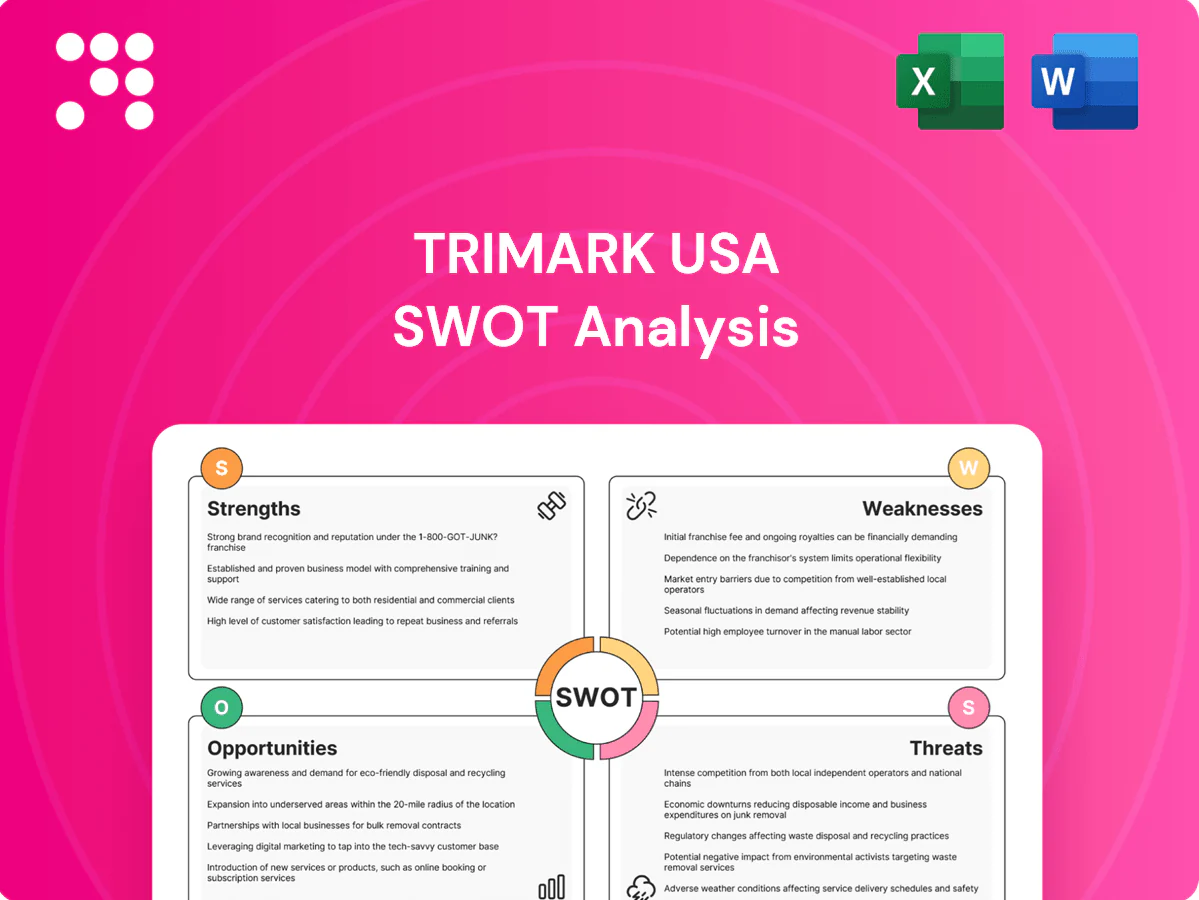
TriMark USA SWOT Analysis

Dive Deeper Into the Company’s Strategic Blueprint
TriMark USA's SWOT analysis highlights its robust foodservice distribution network, brand partnerships, and scale advantages alongside margin pressures and competitive risks; it also maps growth avenues and operational threats. Want the full story? Purchase the complete SWOT for a research-backed, editable Word report plus Excel deliverable to plan, pitch, and invest with confidence.
Strengths

End-to-end project capability
TriMark delivers design, procurement, installation, and replenishment under one roof, reducing vendor complexity for clients and consolidating project accountability. This integrated model shortens timelines and improves cost control and coordination across supply chain and installation phases. The full-stack approach strengthens post-commissioning relationships through ongoing replenishment and service continuity.
Diverse sector coverage
Serving restaurants, healthcare, education and corporate facilities spreads demand across cycles and reduces exposure to single-sector downturns. Countercyclical sectors like healthcare—US health spending ≈18% of GDP (2023)—and education—K–12 enrollment ~50.8 million (2023–24)—help stabilize revenue. Multi-vertical experience sharpens compliance and design standards and creates cross-selling opportunities for equipment and supplies.

Deep design and compliance expertise
TriMark’s commercial kitchen design expertise ensures code, safety and workflow efficiency for operators in an industry generating $997 billion in 2023 US sales; compliance with health, fire and building regulations reduces costly rework and downtime. Optimized layouts raise throughput and cut labor—the largest controllable expense at roughly 30–35% of restaurant costs—giving TriMark technical credibility beyond commodity distributors.

Strong OEM and supplier relationships
Strong OEM and supplier relationships let TriMark leverage scale for favorable pricing and priority allocation, broaden solution fit through access to leading brands, and ensure parts, warranty support and training from partners; these ties measurably boost bid competitiveness and delivery reliability.
- Scale: favorable pricing & priority allocation
- Brands: wider solution & performance options
- Support: warranty, parts, training
- Outcomes: stronger bids, more reliable delivery
National footprint and execution
TriMark USA’s national footprint supports seamless multi-unit, multi-state rollouts by combining centralized project coordination with local install crews to accelerate deployments and maintain schedule integrity. A coast-to-coast presence drives consistent service standards and brand trust, positioning TriMark to win large RFPs and secure preferred vendor status with national chains.
- Geographic reach: multi-state rollouts
- Centralized coordination + local crews: faster deployments
- Consistent service: stronger brand trust
- Enables large RFPs and preferred vendor roles
Design-to-replenishment model reduces vendors, shortens timelines, improves cost control
TriMark’s integrated design-to-replenishment model reduces vendor count, shortens timelines and improves cost control, strengthening bids and post-install revenue. Multi-vertical exposure (US restaurant sales $997B 2023; US health spending ≈18% GDP 2023; K–12 enrollment ~50.8M 2023–24) stabilizes demand. National footprint enables multi-state rollouts and preferred-vendor roles.
| Metric | 2023/24 |
|---|---|
| US restaurant sales | $997B (2023) |
| US health spending | ≈18% GDP (2023) |
| K–12 enrollment | ~50.8M (2023–24) |
What is included in the product
 Detailed Word Document
Delivers a strategic overview of TriMark USA’s internal and external business factors, outlining its strengths, weaknesses, opportunities, and threats to clarify competitive positioning and inform strategic decisions.

 Customizable Excel Spreadsheet
Provides a clear, high-level SWOT matrix that quickly pinpoints TriMark USA's operational pain points and aligns corrective actions for faster decision-making.
Weaknesses

Project revenue cyclicality
Large design-build projects drive uneven revenue and cash flows at TriMark USA, as multi-phase installations can defer recognition until milestones are met. Construction schedule delays commonly push out revenue recognition and extend receivable cycles, concentrating backlog and increasing quarter-to-quarter volatility. Working capital needs spike around major installations, often requiring short-term financing to fund inventory and labor ahead of billing.
Exposure to construction timelines
Permits, inspections and contractor dependencies frequently derail TriMark USA project schedules, driving cascading delays. Cost overruns and scope changes compress margins; large construction projects on average run about 20% longer and can cost up to 80% more than planned (McKinsey). External delays raise storage, labor and financing costs, and slipping timelines materially increase client satisfaction and retention risks.

Margin pressure from price competition
Margin pressure is acute as price transparency and competitive bidding intensify, with US e-commerce at 14.8% of retail sales in 2023 amplifying online seller competition. Regional dealers undercut list pricing, pushing equipment distribution gross margins lower. Clients increasingly demand itemized, lowest-cost quotes, and procurement-led sourcing often undervalues TriMark USA value-added services, compressing pricing power.

Complex logistics and install risk
Coordinating heavy equipment, site readiness, and trades for TriMark USA is operationally demanding and raises exposure to schedule slips; damage, mismatches, or late arrivals frequently force costly rework and may trigger client penalties. Skilled installer availability varies by region, complicating consistent service levels and delivery timelines. The installation complexity amplifies warranty and long‑term service liabilities, increasing post‑sale costs and risk.
- Logistics coordination risk
- Rework/penalty exposure
- Regional installer shortages
- Higher warranty/service liabilities
Technology and data fragmentation
Legacy systems across quoting, design, and inventory limit end-to-end visibility at TriMark USA, producing siloed data that raises error risk and extends cycle times; clients now expect real-time updates and digital collaboration, pressuring service levels. Modernization will require capital investment and structured change management to integrate workflows and meet customer expectations.
- Data silos increase error and delay risk
- Clients demand real-time updates and collaboration
- Modernization needs investment and change management
Long, costly projects and legacy systems squeeze cash flow and margins amid rising e-commerce
TriMark USA faces volatile cash flow from large multi‑phase projects that commonly delay revenue recognition and spike working capital needs; McKinsey data show such projects run ~20% longer and can cost up to 80% more. Competitive bidding and 2023 US e‑commerce at 14.8% compress margins and pricing power. Legacy siloed systems raise error risk and require capex for digital modernization.
| Metric | Value |
|---|---|
| Project delay overrun | ~20% longer |
| Cost overrun | up to 80% |
| US e‑commerce (2023) | 14.8% |
Preview Before You Purchase
TriMark USA SWOT Analysis
This is a real excerpt from the complete TriMark USA SWOT analysis document you’ll receive upon purchase—no surprises, just professional quality and structured insight. The preview below is taken directly from the full report; buy now to unlock the editable, in-depth version. The file shown is the exact analysis included in your download, available immediately after checkout.

Dive Deeper Into the Company’s Strategic Blueprint
TriMark USA's SWOT analysis highlights its robust foodservice distribution network, brand partnerships, and scale advantages alongside margin pressures and competitive risks; it also maps growth avenues and operational threats. Want the full story? Purchase the complete SWOT for a research-backed, editable Word report plus Excel deliverable to plan, pitch, and invest with confidence.
Strengths
End-to-end project capability
TriMark delivers design, procurement, installation, and replenishment under one roof, reducing vendor complexity for clients and consolidating project accountability. This integrated model shortens timelines and improves cost control and coordination across supply chain and installation phases. The full-stack approach strengthens post-commissioning relationships through ongoing replenishment and service continuity.
Diverse sector coverage
Serving restaurants, healthcare, education and corporate facilities spreads demand across cycles and reduces exposure to single-sector downturns. Countercyclical sectors like healthcare—US health spending ≈18% of GDP (2023)—and education—K–12 enrollment ~50.8 million (2023–24)—help stabilize revenue. Multi-vertical experience sharpens compliance and design standards and creates cross-selling opportunities for equipment and supplies.
Deep design and compliance expertise
TriMark’s commercial kitchen design expertise ensures code, safety and workflow efficiency for operators in an industry generating $997 billion in 2023 US sales; compliance with health, fire and building regulations reduces costly rework and downtime. Optimized layouts raise throughput and cut labor—the largest controllable expense at roughly 30–35% of restaurant costs—giving TriMark technical credibility beyond commodity distributors.
Strong OEM and supplier relationships
Strong OEM and supplier relationships let TriMark leverage scale for favorable pricing and priority allocation, broaden solution fit through access to leading brands, and ensure parts, warranty support and training from partners; these ties measurably boost bid competitiveness and delivery reliability.
- Scale: favorable pricing & priority allocation
- Brands: wider solution & performance options
- Support: warranty, parts, training
- Outcomes: stronger bids, more reliable delivery
National footprint and execution
TriMark USA’s national footprint supports seamless multi-unit, multi-state rollouts by combining centralized project coordination with local install crews to accelerate deployments and maintain schedule integrity. A coast-to-coast presence drives consistent service standards and brand trust, positioning TriMark to win large RFPs and secure preferred vendor status with national chains.
- Geographic reach: multi-state rollouts
- Centralized coordination + local crews: faster deployments
- Consistent service: stronger brand trust
- Enables large RFPs and preferred vendor roles
Design-to-replenishment model reduces vendors, shortens timelines, improves cost control
TriMark’s integrated design-to-replenishment model reduces vendor count, shortens timelines and improves cost control, strengthening bids and post-install revenue. Multi-vertical exposure (US restaurant sales $997B 2023; US health spending ≈18% GDP 2023; K–12 enrollment ~50.8M 2023–24) stabilizes demand. National footprint enables multi-state rollouts and preferred-vendor roles.
| Metric | 2023/24 |
|---|---|
| US restaurant sales | $997B (2023) |
| US health spending | ≈18% GDP (2023) |
| K–12 enrollment | ~50.8M (2023–24) |
What is included in the product
Detailed Word Document
Delivers a strategic overview of TriMark USA’s internal and external business factors, outlining its strengths, weaknesses, opportunities, and threats to clarify competitive positioning and inform strategic decisions.
Customizable Excel Spreadsheet
Provides a clear, high-level SWOT matrix that quickly pinpoints TriMark USA's operational pain points and aligns corrective actions for faster decision-making.
Weaknesses
Project revenue cyclicality
Large design-build projects drive uneven revenue and cash flows at TriMark USA, as multi-phase installations can defer recognition until milestones are met. Construction schedule delays commonly push out revenue recognition and extend receivable cycles, concentrating backlog and increasing quarter-to-quarter volatility. Working capital needs spike around major installations, often requiring short-term financing to fund inventory and labor ahead of billing.
Exposure to construction timelines
Permits, inspections and contractor dependencies frequently derail TriMark USA project schedules, driving cascading delays. Cost overruns and scope changes compress margins; large construction projects on average run about 20% longer and can cost up to 80% more than planned (McKinsey). External delays raise storage, labor and financing costs, and slipping timelines materially increase client satisfaction and retention risks.
Margin pressure from price competition
Margin pressure is acute as price transparency and competitive bidding intensify, with US e-commerce at 14.8% of retail sales in 2023 amplifying online seller competition. Regional dealers undercut list pricing, pushing equipment distribution gross margins lower. Clients increasingly demand itemized, lowest-cost quotes, and procurement-led sourcing often undervalues TriMark USA value-added services, compressing pricing power.
Complex logistics and install risk
Coordinating heavy equipment, site readiness, and trades for TriMark USA is operationally demanding and raises exposure to schedule slips; damage, mismatches, or late arrivals frequently force costly rework and may trigger client penalties. Skilled installer availability varies by region, complicating consistent service levels and delivery timelines. The installation complexity amplifies warranty and long‑term service liabilities, increasing post‑sale costs and risk.
- Logistics coordination risk
- Rework/penalty exposure
- Regional installer shortages
- Higher warranty/service liabilities
Technology and data fragmentation
Legacy systems across quoting, design, and inventory limit end-to-end visibility at TriMark USA, producing siloed data that raises error risk and extends cycle times; clients now expect real-time updates and digital collaboration, pressuring service levels. Modernization will require capital investment and structured change management to integrate workflows and meet customer expectations.
- Data silos increase error and delay risk
- Clients demand real-time updates and collaboration
- Modernization needs investment and change management
Long, costly projects and legacy systems squeeze cash flow and margins amid rising e-commerce
TriMark USA faces volatile cash flow from large multi‑phase projects that commonly delay revenue recognition and spike working capital needs; McKinsey data show such projects run ~20% longer and can cost up to 80% more. Competitive bidding and 2023 US e‑commerce at 14.8% compress margins and pricing power. Legacy siloed systems raise error risk and require capex for digital modernization.
| Metric | Value |
|---|---|
| Project delay overrun | ~20% longer |
| Cost overrun | up to 80% |
| US e‑commerce (2023) | 14.8% |
Preview Before You Purchase
TriMark USA SWOT Analysis
This is a real excerpt from the complete TriMark USA SWOT analysis document you’ll receive upon purchase—no surprises, just professional quality and structured insight. The preview below is taken directly from the full report; buy now to unlock the editable, in-depth version. The file shown is the exact analysis included in your download, available immediately after checkout.
Original: $10.00
-65%$10.00
$3.50Description
Dive Deeper Into the Company’s Strategic Blueprint
TriMark USA's SWOT analysis highlights its robust foodservice distribution network, brand partnerships, and scale advantages alongside margin pressures and competitive risks; it also maps growth avenues and operational threats. Want the full story? Purchase the complete SWOT for a research-backed, editable Word report plus Excel deliverable to plan, pitch, and invest with confidence.
Strengths
End-to-end project capability
TriMark delivers design, procurement, installation, and replenishment under one roof, reducing vendor complexity for clients and consolidating project accountability. This integrated model shortens timelines and improves cost control and coordination across supply chain and installation phases. The full-stack approach strengthens post-commissioning relationships through ongoing replenishment and service continuity.
Diverse sector coverage
Serving restaurants, healthcare, education and corporate facilities spreads demand across cycles and reduces exposure to single-sector downturns. Countercyclical sectors like healthcare—US health spending ≈18% of GDP (2023)—and education—K–12 enrollment ~50.8 million (2023–24)—help stabilize revenue. Multi-vertical experience sharpens compliance and design standards and creates cross-selling opportunities for equipment and supplies.
Deep design and compliance expertise
TriMark’s commercial kitchen design expertise ensures code, safety and workflow efficiency for operators in an industry generating $997 billion in 2023 US sales; compliance with health, fire and building regulations reduces costly rework and downtime. Optimized layouts raise throughput and cut labor—the largest controllable expense at roughly 30–35% of restaurant costs—giving TriMark technical credibility beyond commodity distributors.
Strong OEM and supplier relationships
Strong OEM and supplier relationships let TriMark leverage scale for favorable pricing and priority allocation, broaden solution fit through access to leading brands, and ensure parts, warranty support and training from partners; these ties measurably boost bid competitiveness and delivery reliability.
- Scale: favorable pricing & priority allocation
- Brands: wider solution & performance options
- Support: warranty, parts, training
- Outcomes: stronger bids, more reliable delivery
National footprint and execution
TriMark USA’s national footprint supports seamless multi-unit, multi-state rollouts by combining centralized project coordination with local install crews to accelerate deployments and maintain schedule integrity. A coast-to-coast presence drives consistent service standards and brand trust, positioning TriMark to win large RFPs and secure preferred vendor status with national chains.
- Geographic reach: multi-state rollouts
- Centralized coordination + local crews: faster deployments
- Consistent service: stronger brand trust
- Enables large RFPs and preferred vendor roles
Design-to-replenishment model reduces vendors, shortens timelines, improves cost control
TriMark’s integrated design-to-replenishment model reduces vendor count, shortens timelines and improves cost control, strengthening bids and post-install revenue. Multi-vertical exposure (US restaurant sales $997B 2023; US health spending ≈18% GDP 2023; K–12 enrollment ~50.8M 2023–24) stabilizes demand. National footprint enables multi-state rollouts and preferred-vendor roles.
| Metric | 2023/24 |
|---|---|
| US restaurant sales | $997B (2023) |
| US health spending | ≈18% GDP (2023) |
| K–12 enrollment | ~50.8M (2023–24) |
What is included in the product
Detailed Word Document
Delivers a strategic overview of TriMark USA’s internal and external business factors, outlining its strengths, weaknesses, opportunities, and threats to clarify competitive positioning and inform strategic decisions.
Customizable Excel Spreadsheet
Provides a clear, high-level SWOT matrix that quickly pinpoints TriMark USA's operational pain points and aligns corrective actions for faster decision-making.
Weaknesses
Project revenue cyclicality
Large design-build projects drive uneven revenue and cash flows at TriMark USA, as multi-phase installations can defer recognition until milestones are met. Construction schedule delays commonly push out revenue recognition and extend receivable cycles, concentrating backlog and increasing quarter-to-quarter volatility. Working capital needs spike around major installations, often requiring short-term financing to fund inventory and labor ahead of billing.
Exposure to construction timelines
Permits, inspections and contractor dependencies frequently derail TriMark USA project schedules, driving cascading delays. Cost overruns and scope changes compress margins; large construction projects on average run about 20% longer and can cost up to 80% more than planned (McKinsey). External delays raise storage, labor and financing costs, and slipping timelines materially increase client satisfaction and retention risks.
Margin pressure from price competition
Margin pressure is acute as price transparency and competitive bidding intensify, with US e-commerce at 14.8% of retail sales in 2023 amplifying online seller competition. Regional dealers undercut list pricing, pushing equipment distribution gross margins lower. Clients increasingly demand itemized, lowest-cost quotes, and procurement-led sourcing often undervalues TriMark USA value-added services, compressing pricing power.
Complex logistics and install risk
Coordinating heavy equipment, site readiness, and trades for TriMark USA is operationally demanding and raises exposure to schedule slips; damage, mismatches, or late arrivals frequently force costly rework and may trigger client penalties. Skilled installer availability varies by region, complicating consistent service levels and delivery timelines. The installation complexity amplifies warranty and long‑term service liabilities, increasing post‑sale costs and risk.
- Logistics coordination risk
- Rework/penalty exposure
- Regional installer shortages
- Higher warranty/service liabilities
Technology and data fragmentation
Legacy systems across quoting, design, and inventory limit end-to-end visibility at TriMark USA, producing siloed data that raises error risk and extends cycle times; clients now expect real-time updates and digital collaboration, pressuring service levels. Modernization will require capital investment and structured change management to integrate workflows and meet customer expectations.
- Data silos increase error and delay risk
- Clients demand real-time updates and collaboration
- Modernization needs investment and change management
Long, costly projects and legacy systems squeeze cash flow and margins amid rising e-commerce
TriMark USA faces volatile cash flow from large multi‑phase projects that commonly delay revenue recognition and spike working capital needs; McKinsey data show such projects run ~20% longer and can cost up to 80% more. Competitive bidding and 2023 US e‑commerce at 14.8% compress margins and pricing power. Legacy siloed systems raise error risk and require capex for digital modernization.
| Metric | Value |
|---|---|
| Project delay overrun | ~20% longer |
| Cost overrun | up to 80% |
| US e‑commerce (2023) | 14.8% |
Preview Before You Purchase
TriMark USA SWOT Analysis
This is a real excerpt from the complete TriMark USA SWOT analysis document you’ll receive upon purchase—no surprises, just professional quality and structured insight. The preview below is taken directly from the full report; buy now to unlock the editable, in-depth version. The file shown is the exact analysis included in your download, available immediately after checkout.











