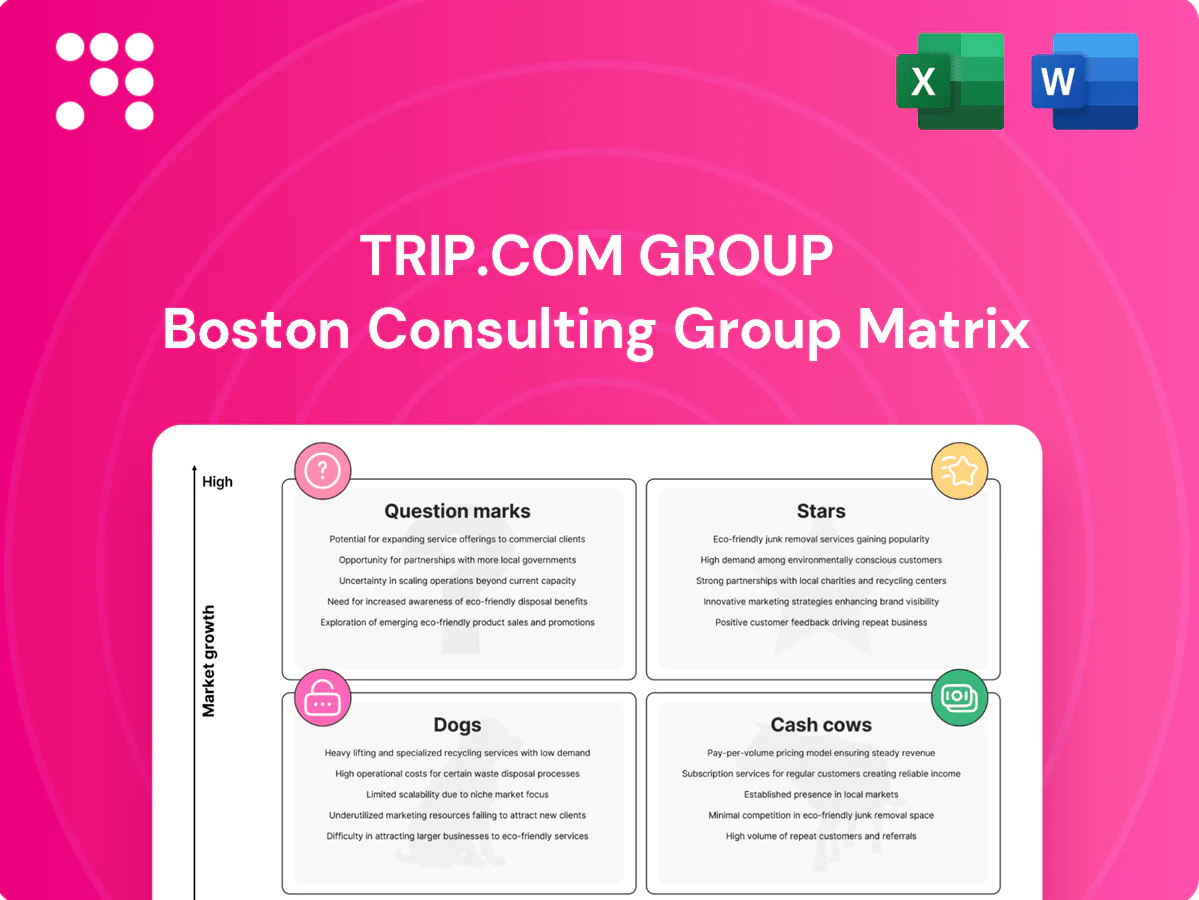
Trip.com Group Boston Consulting Group Matrix

Unlock Strategic Clarity
Think you know where Trip.com Group’s offerings sit? Our BCG Matrix preview spots the likely Stars, Cash Cows, Dogs and Question Marks—now imagine the full map. Purchase the complete BCG Matrix for quadrant-by-quadrant placement, data-backed recommendations, and ready-to-use Word and Excel files so you can act fast and allocate capital with confidence.
Stars

China hotel bookings
Trip.com Group controls over 50% of China’s online accommodation bookings, capitalizing on a domestic travel rebound that by 2023 had surpassed 2019 levels per China’s Ministry of Culture and Tourism; 2024 demand growth continues. This high-share, high-growth China hotel segment is a Star: it requires heavy cash for supply, promotions and placement but secures market leadership. Maintain share as the market matures and it will graduate to a Cash Cow.
Rail ticketing platform
China’s rail network is the world’s largest, with high-speed lines exceeding 40,000 km, and passenger trips rebounded to billions after COVID-19, making rail a massive, digital-first channel; Trip.com Group functions as a primary distribution pipe for rail bookings. Market growth remains healthy as mobility expands beyond tier-1 cities, but defending the perch requires ongoing tech spend and user acquisition. Worth it — leadership today can become steady cash tomorrow.

Mobile super-app
Mobile super-app shows Star dynamics as engagement rose and installs climbed 30% in 2024 while cross-sell velocity accelerated, turning bookings into broader travel spend. App dominance in a recovering global travel market drives scale benefits; heavy marketing and UX investment remain table stakes now. Locking in habitual use converts the app into a low-cost demand engine over time.

International flight ticketing
International flight ticketing is a Stars business: global air travel is back in growth mode (IATA projects 2024 demand to recover to or exceed 2019 levels), and Trip.com’s share is rising across APAC and beyond; flights drive high volume even with thin margins. Winning requires placement, paid traffic, and direct airline ties — all cash hungry — but leadership in flights can fuel the broader funnel.
- Volume driver: flights pull traffic and conversion
- Costly scale: paid acquisition + airline partnerships
- Strategic payoff: market leadership fuels cross-sell
Skyscanner meta reach
Meta-search traffic is expanding with international reopenings and price-sensitive shoppers; Skyscanner, with >100M monthly users (2023), gives Trip.com Group privileged reach and first-party demand data. It requires constant feed quality, sub-200ms UX speed targets and ongoing brand marketing to stay top-of-mind; in a corridor growing ~30% YoY (2024 industry data), this is a Star play.
- reach: >100M monthly users (Skyscanner 2023)
- growth: meta-search corridor ~30% YoY (2024)
- ops: feed quality, <200ms UX, brand spend to retain share
China travel lead: hotels >50%, app +30%, intl flights ≈2019, HSR >40,000 km
Trip.com’s Stars: China hotels >50% share (bookings >2019 levels by 2023), mobile app installs +30% in 2024 with rising cross-sell, international flights recovering (IATA: 2024 demand ≈2019) and rail distribution leveraging China’s >40,000 km HSR. Each requires heavy cash for scale but can convert to Cash Cow with sustained share.
| Business | Key metric | 2023–24 data |
|---|---|---|
| China hotels | Market share | >50%; bookings >2019 (MoCT 2023) |
| Mobile app | Installs / engagement | +30% installs (2024) |
| International flights | Demand | IATA: 2024 ≈2019 |
| Rail distribution | Network | HSR >40,000 km |
| Meta-search | Reach | Skyscanner >100M monthly (2023) |
What is included in the product
 Detailed Word Document
BCG Matrix for Trip.com Group: identifies Stars, Cash Cows, Question Marks, Dogs with investment, hold or divest guidance.

 Customizable Excel Spreadsheet
One-page BCG matrix mapping Trip.com business units to quadrants—fast clarity for portfolio decisions and executive briefings.
Cash Cows

Domestic hotels (mature tiers)
Tier-1/2 domestic hotels are a mature, high-repeat segment for Trip.com Group; in 2024 the company maintained a top-2 position in China OTA hotel bookings, delivering steady margin contribution. Growth is lower but repeat rates and average booking frequency remain strong, making this a classic Cash Cow. Promotional intensity is manageable now — prioritize milking cash flow, boosting ops efficiency and preserving high NPS.
Corporate travel (China)
Trip.Biz within Trip.com Group is a cash cow: large enterprise scale, sticky contract-based revenue and predictable booking volumes as China business travel recovered to roughly 70–85% of 2019 levels by 2023–24 per industry reports. Margins are higher thanks to workflow automation and policy-compliance tools that reduce leakage. Market growth is steady rather than rapid; strategy: maintain, optimize operations, and let it generate cash for investment.

Ancillary & ads
Advertising, preferred listings and ancillaries monetize Trip.com Group’s existing traffic, converting browsing into revenue with minimal incremental acquisition cost. Growth is steady rather than explosive, but targeting can boost yield per session by roughly 15–25% in 2024 industry benchmarks. Once the ad and ancillary rails are built, operating costs remain light, funding splashier product and geographic bets without straining cash flow.

Train + hotel bundles
Train + hotel bundles convert habitual rail travelers into lodging customers through packaged offerings, generating steady, repeatable revenue for Trip.com Group without heavy acquisition spend.
Market growth is modest today while Trip.com maintains a sturdy share in domestic rail-linked bookings; attachment rates are healthy, keeping gross margin contribution reliable.
Low incremental marketing and operational efficiency make the bundles a tidy cash generator rather than a headline growth driver.
- Category: Cash Cow
- Monetization: Habitual rail travelers → lodging
- Growth: Modest market expansion
- Marketing: Low incremental spend
- Role: Stable margin contributor
Loyalty ecosystem
Loyalty ecosystem (points, tiers, partnerships) drives repeat bookings and lowers CAC over time; Trip.com reported over 320 million loyalty members by 2024, supporting incremental growth from a large, stable base.
More membership data enables better personalization and cross-sell, producing steady free cash flow and higher retention; keep the program humming without overspending on acquisition.
- members: 320m+ (2024)
- impact: lower CAC, higher retention
- strategy: personalization, partnerships
- focus: steady ROI, controlled spend
Milking cash cows: Tier-1/2 hotels, biz travel rebound, loyalty & ads fund growth bets
Tier‑1/2 hotels, Trip.Biz, ads/ancillaries, train+hotel bundles and loyalty are Cash Cows for Trip.com Group in 2024: top‑2 OTA hotel bookings in China, Trip.Biz at ~70–85% of 2019 biz travel, loyalty 320m+, ad yield uplift ~15–25%. Focus: milking cash flow, improve ops efficiency, personalization and light marketing to fund growth bets.
| Segment | 2024 metric | Role | Strategy |
|---|---|---|---|
| Hotels | Top‑2 bookings | High margin | Efficiency |
| Trip.Biz | 70–85% of 2019 | Sticky revenue | Optimize |
| Loyalty/ads | 320m+ members; +15–25% ad yield | Low cost monet. | Personalize |
What You’re Viewing Is Included
Trip.com Group BCG Matrix
The file you're previewing is the exact Trip.com Group BCG Matrix report you'll receive after purchase — no watermarks, no placeholders. It's fully formatted and ready for editing, printing, or pitching to stakeholders. Built with market-backed insights and clean visuals, it slot‑in to your strategy work with zero fuss. Buy once, download instantly, and use immediately.

Unlock Strategic Clarity
Think you know where Trip.com Group’s offerings sit? Our BCG Matrix preview spots the likely Stars, Cash Cows, Dogs and Question Marks—now imagine the full map. Purchase the complete BCG Matrix for quadrant-by-quadrant placement, data-backed recommendations, and ready-to-use Word and Excel files so you can act fast and allocate capital with confidence.
Stars
China hotel bookings
Trip.com Group controls over 50% of China’s online accommodation bookings, capitalizing on a domestic travel rebound that by 2023 had surpassed 2019 levels per China’s Ministry of Culture and Tourism; 2024 demand growth continues. This high-share, high-growth China hotel segment is a Star: it requires heavy cash for supply, promotions and placement but secures market leadership. Maintain share as the market matures and it will graduate to a Cash Cow.
Rail ticketing platform
China’s rail network is the world’s largest, with high-speed lines exceeding 40,000 km, and passenger trips rebounded to billions after COVID-19, making rail a massive, digital-first channel; Trip.com Group functions as a primary distribution pipe for rail bookings. Market growth remains healthy as mobility expands beyond tier-1 cities, but defending the perch requires ongoing tech spend and user acquisition. Worth it — leadership today can become steady cash tomorrow.
Mobile super-app
Mobile super-app shows Star dynamics as engagement rose and installs climbed 30% in 2024 while cross-sell velocity accelerated, turning bookings into broader travel spend. App dominance in a recovering global travel market drives scale benefits; heavy marketing and UX investment remain table stakes now. Locking in habitual use converts the app into a low-cost demand engine over time.
International flight ticketing
International flight ticketing is a Stars business: global air travel is back in growth mode (IATA projects 2024 demand to recover to or exceed 2019 levels), and Trip.com’s share is rising across APAC and beyond; flights drive high volume even with thin margins. Winning requires placement, paid traffic, and direct airline ties — all cash hungry — but leadership in flights can fuel the broader funnel.
- Volume driver: flights pull traffic and conversion
- Costly scale: paid acquisition + airline partnerships
- Strategic payoff: market leadership fuels cross-sell
Skyscanner meta reach
Meta-search traffic is expanding with international reopenings and price-sensitive shoppers; Skyscanner, with >100M monthly users (2023), gives Trip.com Group privileged reach and first-party demand data. It requires constant feed quality, sub-200ms UX speed targets and ongoing brand marketing to stay top-of-mind; in a corridor growing ~30% YoY (2024 industry data), this is a Star play.
- reach: >100M monthly users (Skyscanner 2023)
- growth: meta-search corridor ~30% YoY (2024)
- ops: feed quality, <200ms UX, brand spend to retain share
China travel lead: hotels >50%, app +30%, intl flights ≈2019, HSR >40,000 km
Trip.com’s Stars: China hotels >50% share (bookings >2019 levels by 2023), mobile app installs +30% in 2024 with rising cross-sell, international flights recovering (IATA: 2024 demand ≈2019) and rail distribution leveraging China’s >40,000 km HSR. Each requires heavy cash for scale but can convert to Cash Cow with sustained share.
| Business | Key metric | 2023–24 data |
|---|---|---|
| China hotels | Market share | >50%; bookings >2019 (MoCT 2023) |
| Mobile app | Installs / engagement | +30% installs (2024) |
| International flights | Demand | IATA: 2024 ≈2019 |
| Rail distribution | Network | HSR >40,000 km |
| Meta-search | Reach | Skyscanner >100M monthly (2023) |
What is included in the product
Detailed Word Document
BCG Matrix for Trip.com Group: identifies Stars, Cash Cows, Question Marks, Dogs with investment, hold or divest guidance.
Customizable Excel Spreadsheet
One-page BCG matrix mapping Trip.com business units to quadrants—fast clarity for portfolio decisions and executive briefings.
Cash Cows
Domestic hotels (mature tiers)
Tier-1/2 domestic hotels are a mature, high-repeat segment for Trip.com Group; in 2024 the company maintained a top-2 position in China OTA hotel bookings, delivering steady margin contribution. Growth is lower but repeat rates and average booking frequency remain strong, making this a classic Cash Cow. Promotional intensity is manageable now — prioritize milking cash flow, boosting ops efficiency and preserving high NPS.
Corporate travel (China)
Trip.Biz within Trip.com Group is a cash cow: large enterprise scale, sticky contract-based revenue and predictable booking volumes as China business travel recovered to roughly 70–85% of 2019 levels by 2023–24 per industry reports. Margins are higher thanks to workflow automation and policy-compliance tools that reduce leakage. Market growth is steady rather than rapid; strategy: maintain, optimize operations, and let it generate cash for investment.
Ancillary & ads
Advertising, preferred listings and ancillaries monetize Trip.com Group’s existing traffic, converting browsing into revenue with minimal incremental acquisition cost. Growth is steady rather than explosive, but targeting can boost yield per session by roughly 15–25% in 2024 industry benchmarks. Once the ad and ancillary rails are built, operating costs remain light, funding splashier product and geographic bets without straining cash flow.
Train + hotel bundles
Train + hotel bundles convert habitual rail travelers into lodging customers through packaged offerings, generating steady, repeatable revenue for Trip.com Group without heavy acquisition spend.
Market growth is modest today while Trip.com maintains a sturdy share in domestic rail-linked bookings; attachment rates are healthy, keeping gross margin contribution reliable.
Low incremental marketing and operational efficiency make the bundles a tidy cash generator rather than a headline growth driver.
- Category: Cash Cow
- Monetization: Habitual rail travelers → lodging
- Growth: Modest market expansion
- Marketing: Low incremental spend
- Role: Stable margin contributor
Loyalty ecosystem
Loyalty ecosystem (points, tiers, partnerships) drives repeat bookings and lowers CAC over time; Trip.com reported over 320 million loyalty members by 2024, supporting incremental growth from a large, stable base.
More membership data enables better personalization and cross-sell, producing steady free cash flow and higher retention; keep the program humming without overspending on acquisition.
- members: 320m+ (2024)
- impact: lower CAC, higher retention
- strategy: personalization, partnerships
- focus: steady ROI, controlled spend
Milking cash cows: Tier-1/2 hotels, biz travel rebound, loyalty & ads fund growth bets
Tier‑1/2 hotels, Trip.Biz, ads/ancillaries, train+hotel bundles and loyalty are Cash Cows for Trip.com Group in 2024: top‑2 OTA hotel bookings in China, Trip.Biz at ~70–85% of 2019 biz travel, loyalty 320m+, ad yield uplift ~15–25%. Focus: milking cash flow, improve ops efficiency, personalization and light marketing to fund growth bets.
| Segment | 2024 metric | Role | Strategy |
|---|---|---|---|
| Hotels | Top‑2 bookings | High margin | Efficiency |
| Trip.Biz | 70–85% of 2019 | Sticky revenue | Optimize |
| Loyalty/ads | 320m+ members; +15–25% ad yield | Low cost monet. | Personalize |
What You’re Viewing Is Included
Trip.com Group BCG Matrix
The file you're previewing is the exact Trip.com Group BCG Matrix report you'll receive after purchase — no watermarks, no placeholders. It's fully formatted and ready for editing, printing, or pitching to stakeholders. Built with market-backed insights and clean visuals, it slot‑in to your strategy work with zero fuss. Buy once, download instantly, and use immediately.
Original: $10.00
-65%$10.00
$3.50Description
Unlock Strategic Clarity
Think you know where Trip.com Group’s offerings sit? Our BCG Matrix preview spots the likely Stars, Cash Cows, Dogs and Question Marks—now imagine the full map. Purchase the complete BCG Matrix for quadrant-by-quadrant placement, data-backed recommendations, and ready-to-use Word and Excel files so you can act fast and allocate capital with confidence.
Stars
China hotel bookings
Trip.com Group controls over 50% of China’s online accommodation bookings, capitalizing on a domestic travel rebound that by 2023 had surpassed 2019 levels per China’s Ministry of Culture and Tourism; 2024 demand growth continues. This high-share, high-growth China hotel segment is a Star: it requires heavy cash for supply, promotions and placement but secures market leadership. Maintain share as the market matures and it will graduate to a Cash Cow.
Rail ticketing platform
China’s rail network is the world’s largest, with high-speed lines exceeding 40,000 km, and passenger trips rebounded to billions after COVID-19, making rail a massive, digital-first channel; Trip.com Group functions as a primary distribution pipe for rail bookings. Market growth remains healthy as mobility expands beyond tier-1 cities, but defending the perch requires ongoing tech spend and user acquisition. Worth it — leadership today can become steady cash tomorrow.
Mobile super-app
Mobile super-app shows Star dynamics as engagement rose and installs climbed 30% in 2024 while cross-sell velocity accelerated, turning bookings into broader travel spend. App dominance in a recovering global travel market drives scale benefits; heavy marketing and UX investment remain table stakes now. Locking in habitual use converts the app into a low-cost demand engine over time.
International flight ticketing
International flight ticketing is a Stars business: global air travel is back in growth mode (IATA projects 2024 demand to recover to or exceed 2019 levels), and Trip.com’s share is rising across APAC and beyond; flights drive high volume even with thin margins. Winning requires placement, paid traffic, and direct airline ties — all cash hungry — but leadership in flights can fuel the broader funnel.
- Volume driver: flights pull traffic and conversion
- Costly scale: paid acquisition + airline partnerships
- Strategic payoff: market leadership fuels cross-sell
Skyscanner meta reach
Meta-search traffic is expanding with international reopenings and price-sensitive shoppers; Skyscanner, with >100M monthly users (2023), gives Trip.com Group privileged reach and first-party demand data. It requires constant feed quality, sub-200ms UX speed targets and ongoing brand marketing to stay top-of-mind; in a corridor growing ~30% YoY (2024 industry data), this is a Star play.
- reach: >100M monthly users (Skyscanner 2023)
- growth: meta-search corridor ~30% YoY (2024)
- ops: feed quality, <200ms UX, brand spend to retain share
China travel lead: hotels >50%, app +30%, intl flights ≈2019, HSR >40,000 km
Trip.com’s Stars: China hotels >50% share (bookings >2019 levels by 2023), mobile app installs +30% in 2024 with rising cross-sell, international flights recovering (IATA: 2024 demand ≈2019) and rail distribution leveraging China’s >40,000 km HSR. Each requires heavy cash for scale but can convert to Cash Cow with sustained share.
| Business | Key metric | 2023–24 data |
|---|---|---|
| China hotels | Market share | >50%; bookings >2019 (MoCT 2023) |
| Mobile app | Installs / engagement | +30% installs (2024) |
| International flights | Demand | IATA: 2024 ≈2019 |
| Rail distribution | Network | HSR >40,000 km |
| Meta-search | Reach | Skyscanner >100M monthly (2023) |
What is included in the product
Detailed Word Document
BCG Matrix for Trip.com Group: identifies Stars, Cash Cows, Question Marks, Dogs with investment, hold or divest guidance.
Customizable Excel Spreadsheet
One-page BCG matrix mapping Trip.com business units to quadrants—fast clarity for portfolio decisions and executive briefings.
Cash Cows
Domestic hotels (mature tiers)
Tier-1/2 domestic hotels are a mature, high-repeat segment for Trip.com Group; in 2024 the company maintained a top-2 position in China OTA hotel bookings, delivering steady margin contribution. Growth is lower but repeat rates and average booking frequency remain strong, making this a classic Cash Cow. Promotional intensity is manageable now — prioritize milking cash flow, boosting ops efficiency and preserving high NPS.
Corporate travel (China)
Trip.Biz within Trip.com Group is a cash cow: large enterprise scale, sticky contract-based revenue and predictable booking volumes as China business travel recovered to roughly 70–85% of 2019 levels by 2023–24 per industry reports. Margins are higher thanks to workflow automation and policy-compliance tools that reduce leakage. Market growth is steady rather than rapid; strategy: maintain, optimize operations, and let it generate cash for investment.
Ancillary & ads
Advertising, preferred listings and ancillaries monetize Trip.com Group’s existing traffic, converting browsing into revenue with minimal incremental acquisition cost. Growth is steady rather than explosive, but targeting can boost yield per session by roughly 15–25% in 2024 industry benchmarks. Once the ad and ancillary rails are built, operating costs remain light, funding splashier product and geographic bets without straining cash flow.
Train + hotel bundles
Train + hotel bundles convert habitual rail travelers into lodging customers through packaged offerings, generating steady, repeatable revenue for Trip.com Group without heavy acquisition spend.
Market growth is modest today while Trip.com maintains a sturdy share in domestic rail-linked bookings; attachment rates are healthy, keeping gross margin contribution reliable.
Low incremental marketing and operational efficiency make the bundles a tidy cash generator rather than a headline growth driver.
- Category: Cash Cow
- Monetization: Habitual rail travelers → lodging
- Growth: Modest market expansion
- Marketing: Low incremental spend
- Role: Stable margin contributor
Loyalty ecosystem
Loyalty ecosystem (points, tiers, partnerships) drives repeat bookings and lowers CAC over time; Trip.com reported over 320 million loyalty members by 2024, supporting incremental growth from a large, stable base.
More membership data enables better personalization and cross-sell, producing steady free cash flow and higher retention; keep the program humming without overspending on acquisition.
- members: 320m+ (2024)
- impact: lower CAC, higher retention
- strategy: personalization, partnerships
- focus: steady ROI, controlled spend
Milking cash cows: Tier-1/2 hotels, biz travel rebound, loyalty & ads fund growth bets
Tier‑1/2 hotels, Trip.Biz, ads/ancillaries, train+hotel bundles and loyalty are Cash Cows for Trip.com Group in 2024: top‑2 OTA hotel bookings in China, Trip.Biz at ~70–85% of 2019 biz travel, loyalty 320m+, ad yield uplift ~15–25%. Focus: milking cash flow, improve ops efficiency, personalization and light marketing to fund growth bets.
| Segment | 2024 metric | Role | Strategy |
|---|---|---|---|
| Hotels | Top‑2 bookings | High margin | Efficiency |
| Trip.Biz | 70–85% of 2019 | Sticky revenue | Optimize |
| Loyalty/ads | 320m+ members; +15–25% ad yield | Low cost monet. | Personalize |
What You’re Viewing Is Included
Trip.com Group BCG Matrix
The file you're previewing is the exact Trip.com Group BCG Matrix report you'll receive after purchase — no watermarks, no placeholders. It's fully formatted and ready for editing, printing, or pitching to stakeholders. Built with market-backed insights and clean visuals, it slot‑in to your strategy work with zero fuss. Buy once, download instantly, and use immediately.











