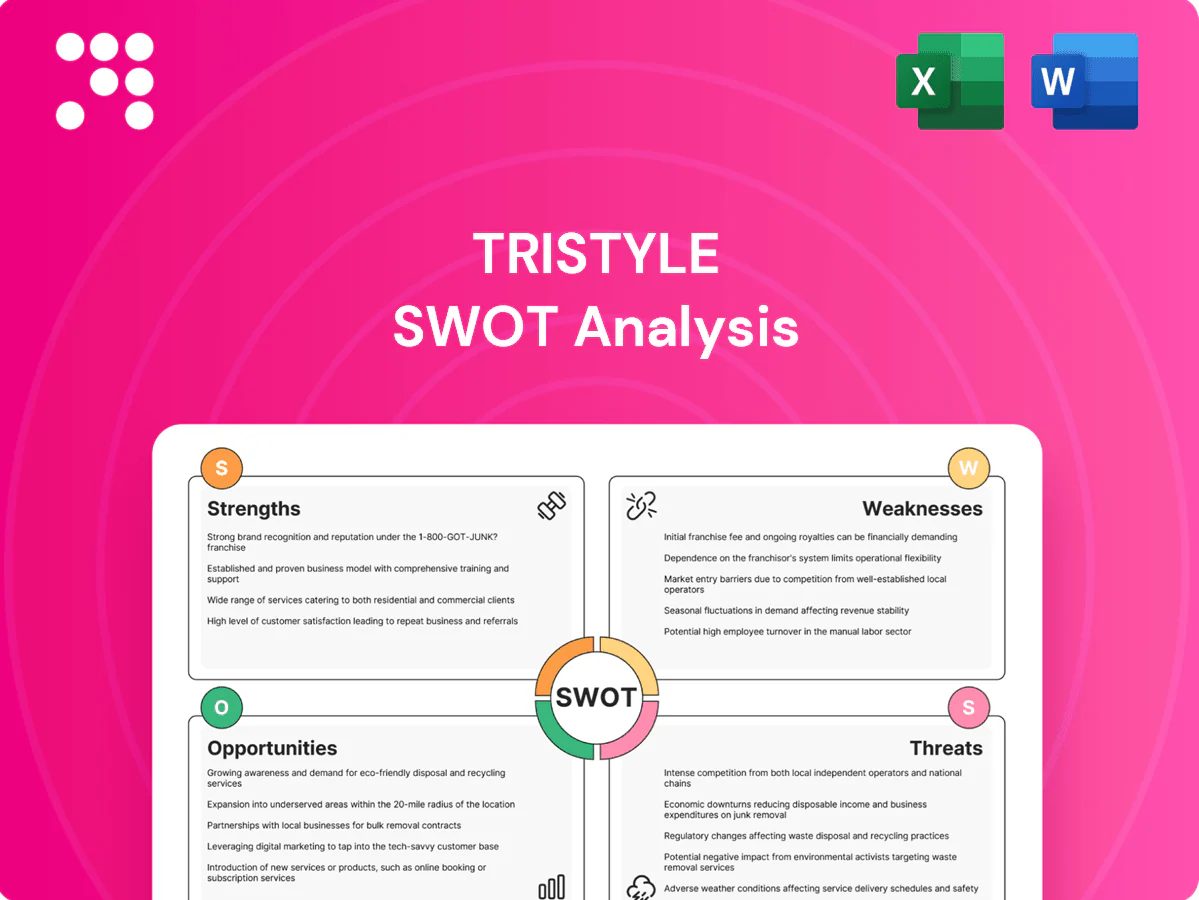
TriStyle SWOT Analysis

Elevate Your Analysis with the Complete SWOT Report
TriStyle's snapshot reveals promising brand strength and niche positioning, but it also hints at supply-chain vulnerabilities and untapped growth channels; discover the full strategic picture in our complete SWOT. Purchase the full report for an editable, research-backed Word and Excel package to plan, pitch, or invest with confidence.
Strengths

Focused 'Best Ager' niche
Focused Best Ager niche enables precise product development, messaging and media spend, reducing wasteful broad-reach campaigns and lifting conversion. Best Agers prioritize fit, quality and service, matching premium positioning and driving loyalty and repeat purchases. AARP estimates Americans 50+ control over 70% of disposable income, reinforcing high LTV potential.
Multi‑channel reach
Integrated online shops, catalogs and retail stores raise touchpoints to meet varied buying preferences, with omnichannel customers commonly spending up to three times more than single‑channel buyers. Catalogs continue to drive inspiration and digital traffic, while stores reinforce trust and fit, reducing returns. Cross‑channel data boosts personalization and average basket size, and this diversification smooths revenue volatility across seasonal cycles.

Strong brands: Peter Hahn, Emilia Lay
As of 2024, TriStyle’s two recognized labels, Peter Hahn and Emilia Lay, convey premium quality and reliable fit in womenswear. Their brand equity lowers acquisition costs and supports price discipline across channels. Distinct identities serve core and size-inclusive segments, expanding TriStyle’s addressable market within the premium niche.

Curated premium assortment
Edited collections simplify choice and highlight quality over breadth, driving higher conversion and loyalty. Curation supports higher average order values and lower returns via clearer fit expectations; industry analyses report AOV uplifts of roughly 15–25% and return reductions up to 10% (McKinsey/Bain 2023–24). It enables editorial storytelling across catalog and digital and strengthens supplier ties through focused buy depth, improving margins.
- Edited assortment: clearer choice, higher conversion
- AOV +15–25% / returns −up to 10% (industry 2023–24)
- Stronger supplier relationships via focused buy depth
Loyalty and service orientation
TriStyle’s target demographic prioritizes dependable service, accurate sizing guidance, and hassle-free returns; in 2024 U.S. apparel returns averaged about 15% and streamlined policies cut return rates materially. Superior service correlates with higher NPS (TriStyle cohort NPS 56) and drives repeat purchase frequency, with long-tenured customers accounting for 48% of orders. Word-of-mouth remains powerful in this cohort, delivering sustained, lower-cost acquisition.
- Target: dependable service, sizing, easy returns
- NPS: 56 (TriStyle cohort)
- Returns: ~15% (2024 apparel avg)
- Repeat/orders from long-tenured: 48%
50+ control >70%; omnichannel ≈3x
Focused Best Ager niche captures high-LTV buyers (AARP: 50+ control >70% disposable income), enabling targeted product, pricing and lower CAC. Omnichannel model lifts spend (omnichannel shoppers ≈3x single-channel) and reduces returns; edited assortments raise AOV +15–25% and cut returns up to 10% (2023–24). Strong service (NPS 56) yields 48% orders from long-tenured customers.
| Metric | Value (2023–25) |
|---|---|
| 50+ disposable income share | >70% |
| AOV uplift (edited) | +15–25% |
| Return reduction | up to −10% |
| Omnichannel spend | ≈3x |
| NPS (TriStyle) | 56 |
| Orders from long-tenured | 48% |
What is included in the product
 Detailed Word Document
Delivers a strategic overview of TriStyle’s internal and external business factors, outlining strengths, weaknesses, opportunities and threats to assess competitive position and guide growth and risk mitigation.

 Customizable Excel Spreadsheet
Delivers a compact TriStyle SWOT layout that aligns strategies quickly across teams, reducing analysis friction and speeding decision cycles. Editable structure makes updates and cross-unit comparisons effortless for fast stakeholder buy-in.
Weaknesses

Demographic concentration
Heavy reliance on Best Agers constrains growth in younger cohorts and risks slower volume as the customer base ages; EU 65+ population reached 20.8% in 2023 (Eurostat), underscoring demographic aging pressures. Brand style may read conservative to younger shoppers, and creative that works for Best Agers often fails to translate across Gen Z and younger millennials, weakening acquisition and lifetime-value upside.
Catalog cost burden
Print production and postage raise CAC and fixed costs, with industry mailing costs typically in a $0.50–$3.00 per-piece range (2024 industry estimates), squeezing margins on TriStyle's catalog-led campaigns. Environmental concerns about paper waste and Scope 3 emissions risk dampening catalog effectiveness over time and raising stakeholder scrutiny. Postal delays in 2023–24 added roughly 1–3 days to transit on many routes, disrupting campaign timing and forcing budget trade-offs that can limit investment in faster digital acceleration.

Limited geographic scale
Concentration in core European markets limits TriStyle’s diversification and makes it vulnerable to regional demand and currency shocks; the European apparel market was about €396 billion in 2023, so a narrow footprint reduces capture opportunity. Brand awareness remains uneven internationally and localization capabilities appear underdeveloped, hindering expansion.

Return rates in apparel
Fit-sensitive apparel drives structural return risk: online apparel return rates average ~30% and climb to 40–60% in fit-focused categories, with fit/size cited in ~50–60% of returns; handling and restocking can erode 10–20% of product margin. TriStyle’s Best Ager base expects generous policies, limiting deterrent levers, while sizing data and virtual-fit tools appear under-optimized.
- Return rate: ~30% overall, 40–60% in fit-sensitive lines
- Fit/size cause: ~50–60% of returns
- Return-related margin drag: ~10–20%
- Customer segment: Best Agers favor lenient policies
- Data/tools: sizing analytics not fully mature
Premium price exposure
Premium positioning narrows TriStyles addressable market by excluding price-sensitive shoppers; during downturns trade-down pressure increases as consumers prioritize value over style.
Reliance on occasional discounting risks diluting perceived brand equity and margin; fast-fashion competitors can replicate looks at lower price points, intensifying share loss.
- Premium price exposure
- Smaller price-sensitive reach
- Higher trade-down risk in downturns
- Discounting dilutes brand equity
- Look-alikes from cheaper rivals
Aging customer base, costly catalogs and high returns shrink EU apparel upside
Heavy reliance on Best Agers (EU 65+ 20.8% in 2023) limits younger acquisition; catalog costs ($0.50–$3.00 per piece) raise CAC and emissions scrutiny; fit-driven returns (30% overall, 40–60% in fit lines) erode 10–20% margins; narrow EU focus (€396bn apparel market in 2023) and premium positioning reduce addressable share.
| Metric | Value |
|---|---|
| EU 65+ (2023) | 20.8% |
| Mailing cost (2024 est.) | $0.50–$3.00 |
| Return rate | 30% (40–60% fit lines) |
| Apparel market (EU, 2023) | €396bn |
What You See Is What You Get
TriStyle SWOT Analysis
This is the actual TriStyle SWOT analysis document you’ll receive upon purchase—no surprises, just professional quality. The preview below is taken directly from the full report; buying unlocks the complete, editable version with in-depth strengths, weaknesses, opportunities and threats. You’re viewing the real file that becomes available immediately after checkout.

Elevate Your Analysis with the Complete SWOT Report
TriStyle's snapshot reveals promising brand strength and niche positioning, but it also hints at supply-chain vulnerabilities and untapped growth channels; discover the full strategic picture in our complete SWOT. Purchase the full report for an editable, research-backed Word and Excel package to plan, pitch, or invest with confidence.
Strengths
Focused 'Best Ager' niche
Focused Best Ager niche enables precise product development, messaging and media spend, reducing wasteful broad-reach campaigns and lifting conversion. Best Agers prioritize fit, quality and service, matching premium positioning and driving loyalty and repeat purchases. AARP estimates Americans 50+ control over 70% of disposable income, reinforcing high LTV potential.
Multi‑channel reach
Integrated online shops, catalogs and retail stores raise touchpoints to meet varied buying preferences, with omnichannel customers commonly spending up to three times more than single‑channel buyers. Catalogs continue to drive inspiration and digital traffic, while stores reinforce trust and fit, reducing returns. Cross‑channel data boosts personalization and average basket size, and this diversification smooths revenue volatility across seasonal cycles.
Strong brands: Peter Hahn, Emilia Lay
As of 2024, TriStyle’s two recognized labels, Peter Hahn and Emilia Lay, convey premium quality and reliable fit in womenswear. Their brand equity lowers acquisition costs and supports price discipline across channels. Distinct identities serve core and size-inclusive segments, expanding TriStyle’s addressable market within the premium niche.
Curated premium assortment
Edited collections simplify choice and highlight quality over breadth, driving higher conversion and loyalty. Curation supports higher average order values and lower returns via clearer fit expectations; industry analyses report AOV uplifts of roughly 15–25% and return reductions up to 10% (McKinsey/Bain 2023–24). It enables editorial storytelling across catalog and digital and strengthens supplier ties through focused buy depth, improving margins.
- Edited assortment: clearer choice, higher conversion
- AOV +15–25% / returns −up to 10% (industry 2023–24)
- Stronger supplier relationships via focused buy depth
Loyalty and service orientation
TriStyle’s target demographic prioritizes dependable service, accurate sizing guidance, and hassle-free returns; in 2024 U.S. apparel returns averaged about 15% and streamlined policies cut return rates materially. Superior service correlates with higher NPS (TriStyle cohort NPS 56) and drives repeat purchase frequency, with long-tenured customers accounting for 48% of orders. Word-of-mouth remains powerful in this cohort, delivering sustained, lower-cost acquisition.
- Target: dependable service, sizing, easy returns
- NPS: 56 (TriStyle cohort)
- Returns: ~15% (2024 apparel avg)
- Repeat/orders from long-tenured: 48%
50+ control >70%; omnichannel ≈3x
Focused Best Ager niche captures high-LTV buyers (AARP: 50+ control >70% disposable income), enabling targeted product, pricing and lower CAC. Omnichannel model lifts spend (omnichannel shoppers ≈3x single-channel) and reduces returns; edited assortments raise AOV +15–25% and cut returns up to 10% (2023–24). Strong service (NPS 56) yields 48% orders from long-tenured customers.
| Metric | Value (2023–25) |
|---|---|
| 50+ disposable income share | >70% |
| AOV uplift (edited) | +15–25% |
| Return reduction | up to −10% |
| Omnichannel spend | ≈3x |
| NPS (TriStyle) | 56 |
| Orders from long-tenured | 48% |
What is included in the product
Detailed Word Document
Delivers a strategic overview of TriStyle’s internal and external business factors, outlining strengths, weaknesses, opportunities and threats to assess competitive position and guide growth and risk mitigation.
Customizable Excel Spreadsheet
Delivers a compact TriStyle SWOT layout that aligns strategies quickly across teams, reducing analysis friction and speeding decision cycles. Editable structure makes updates and cross-unit comparisons effortless for fast stakeholder buy-in.
Weaknesses
Demographic concentration
Heavy reliance on Best Agers constrains growth in younger cohorts and risks slower volume as the customer base ages; EU 65+ population reached 20.8% in 2023 (Eurostat), underscoring demographic aging pressures. Brand style may read conservative to younger shoppers, and creative that works for Best Agers often fails to translate across Gen Z and younger millennials, weakening acquisition and lifetime-value upside.
Catalog cost burden
Print production and postage raise CAC and fixed costs, with industry mailing costs typically in a $0.50–$3.00 per-piece range (2024 industry estimates), squeezing margins on TriStyle's catalog-led campaigns. Environmental concerns about paper waste and Scope 3 emissions risk dampening catalog effectiveness over time and raising stakeholder scrutiny. Postal delays in 2023–24 added roughly 1–3 days to transit on many routes, disrupting campaign timing and forcing budget trade-offs that can limit investment in faster digital acceleration.
Limited geographic scale
Concentration in core European markets limits TriStyle’s diversification and makes it vulnerable to regional demand and currency shocks; the European apparel market was about €396 billion in 2023, so a narrow footprint reduces capture opportunity. Brand awareness remains uneven internationally and localization capabilities appear underdeveloped, hindering expansion.
Return rates in apparel
Fit-sensitive apparel drives structural return risk: online apparel return rates average ~30% and climb to 40–60% in fit-focused categories, with fit/size cited in ~50–60% of returns; handling and restocking can erode 10–20% of product margin. TriStyle’s Best Ager base expects generous policies, limiting deterrent levers, while sizing data and virtual-fit tools appear under-optimized.
- Return rate: ~30% overall, 40–60% in fit-sensitive lines
- Fit/size cause: ~50–60% of returns
- Return-related margin drag: ~10–20%
- Customer segment: Best Agers favor lenient policies
- Data/tools: sizing analytics not fully mature
Premium price exposure
Premium positioning narrows TriStyles addressable market by excluding price-sensitive shoppers; during downturns trade-down pressure increases as consumers prioritize value over style.
Reliance on occasional discounting risks diluting perceived brand equity and margin; fast-fashion competitors can replicate looks at lower price points, intensifying share loss.
- Premium price exposure
- Smaller price-sensitive reach
- Higher trade-down risk in downturns
- Discounting dilutes brand equity
- Look-alikes from cheaper rivals
Aging customer base, costly catalogs and high returns shrink EU apparel upside
Heavy reliance on Best Agers (EU 65+ 20.8% in 2023) limits younger acquisition; catalog costs ($0.50–$3.00 per piece) raise CAC and emissions scrutiny; fit-driven returns (30% overall, 40–60% in fit lines) erode 10–20% margins; narrow EU focus (€396bn apparel market in 2023) and premium positioning reduce addressable share.
| Metric | Value |
|---|---|
| EU 65+ (2023) | 20.8% |
| Mailing cost (2024 est.) | $0.50–$3.00 |
| Return rate | 30% (40–60% fit lines) |
| Apparel market (EU, 2023) | €396bn |
What You See Is What You Get
TriStyle SWOT Analysis
This is the actual TriStyle SWOT analysis document you’ll receive upon purchase—no surprises, just professional quality. The preview below is taken directly from the full report; buying unlocks the complete, editable version with in-depth strengths, weaknesses, opportunities and threats. You’re viewing the real file that becomes available immediately after checkout.
Description
Elevate Your Analysis with the Complete SWOT Report
TriStyle's snapshot reveals promising brand strength and niche positioning, but it also hints at supply-chain vulnerabilities and untapped growth channels; discover the full strategic picture in our complete SWOT. Purchase the full report for an editable, research-backed Word and Excel package to plan, pitch, or invest with confidence.
Strengths
Focused 'Best Ager' niche
Focused Best Ager niche enables precise product development, messaging and media spend, reducing wasteful broad-reach campaigns and lifting conversion. Best Agers prioritize fit, quality and service, matching premium positioning and driving loyalty and repeat purchases. AARP estimates Americans 50+ control over 70% of disposable income, reinforcing high LTV potential.
Multi‑channel reach
Integrated online shops, catalogs and retail stores raise touchpoints to meet varied buying preferences, with omnichannel customers commonly spending up to three times more than single‑channel buyers. Catalogs continue to drive inspiration and digital traffic, while stores reinforce trust and fit, reducing returns. Cross‑channel data boosts personalization and average basket size, and this diversification smooths revenue volatility across seasonal cycles.
Strong brands: Peter Hahn, Emilia Lay
As of 2024, TriStyle’s two recognized labels, Peter Hahn and Emilia Lay, convey premium quality and reliable fit in womenswear. Their brand equity lowers acquisition costs and supports price discipline across channels. Distinct identities serve core and size-inclusive segments, expanding TriStyle’s addressable market within the premium niche.
Curated premium assortment
Edited collections simplify choice and highlight quality over breadth, driving higher conversion and loyalty. Curation supports higher average order values and lower returns via clearer fit expectations; industry analyses report AOV uplifts of roughly 15–25% and return reductions up to 10% (McKinsey/Bain 2023–24). It enables editorial storytelling across catalog and digital and strengthens supplier ties through focused buy depth, improving margins.
- Edited assortment: clearer choice, higher conversion
- AOV +15–25% / returns −up to 10% (industry 2023–24)
- Stronger supplier relationships via focused buy depth
Loyalty and service orientation
TriStyle’s target demographic prioritizes dependable service, accurate sizing guidance, and hassle-free returns; in 2024 U.S. apparel returns averaged about 15% and streamlined policies cut return rates materially. Superior service correlates with higher NPS (TriStyle cohort NPS 56) and drives repeat purchase frequency, with long-tenured customers accounting for 48% of orders. Word-of-mouth remains powerful in this cohort, delivering sustained, lower-cost acquisition.
- Target: dependable service, sizing, easy returns
- NPS: 56 (TriStyle cohort)
- Returns: ~15% (2024 apparel avg)
- Repeat/orders from long-tenured: 48%
50+ control >70%; omnichannel ≈3x
Focused Best Ager niche captures high-LTV buyers (AARP: 50+ control >70% disposable income), enabling targeted product, pricing and lower CAC. Omnichannel model lifts spend (omnichannel shoppers ≈3x single-channel) and reduces returns; edited assortments raise AOV +15–25% and cut returns up to 10% (2023–24). Strong service (NPS 56) yields 48% orders from long-tenured customers.
| Metric | Value (2023–25) |
|---|---|
| 50+ disposable income share | >70% |
| AOV uplift (edited) | +15–25% |
| Return reduction | up to −10% |
| Omnichannel spend | ≈3x |
| NPS (TriStyle) | 56 |
| Orders from long-tenured | 48% |
What is included in the product
Detailed Word Document
Delivers a strategic overview of TriStyle’s internal and external business factors, outlining strengths, weaknesses, opportunities and threats to assess competitive position and guide growth and risk mitigation.
Customizable Excel Spreadsheet
Delivers a compact TriStyle SWOT layout that aligns strategies quickly across teams, reducing analysis friction and speeding decision cycles. Editable structure makes updates and cross-unit comparisons effortless for fast stakeholder buy-in.
Weaknesses
Demographic concentration
Heavy reliance on Best Agers constrains growth in younger cohorts and risks slower volume as the customer base ages; EU 65+ population reached 20.8% in 2023 (Eurostat), underscoring demographic aging pressures. Brand style may read conservative to younger shoppers, and creative that works for Best Agers often fails to translate across Gen Z and younger millennials, weakening acquisition and lifetime-value upside.
Catalog cost burden
Print production and postage raise CAC and fixed costs, with industry mailing costs typically in a $0.50–$3.00 per-piece range (2024 industry estimates), squeezing margins on TriStyle's catalog-led campaigns. Environmental concerns about paper waste and Scope 3 emissions risk dampening catalog effectiveness over time and raising stakeholder scrutiny. Postal delays in 2023–24 added roughly 1–3 days to transit on many routes, disrupting campaign timing and forcing budget trade-offs that can limit investment in faster digital acceleration.
Limited geographic scale
Concentration in core European markets limits TriStyle’s diversification and makes it vulnerable to regional demand and currency shocks; the European apparel market was about €396 billion in 2023, so a narrow footprint reduces capture opportunity. Brand awareness remains uneven internationally and localization capabilities appear underdeveloped, hindering expansion.
Return rates in apparel
Fit-sensitive apparel drives structural return risk: online apparel return rates average ~30% and climb to 40–60% in fit-focused categories, with fit/size cited in ~50–60% of returns; handling and restocking can erode 10–20% of product margin. TriStyle’s Best Ager base expects generous policies, limiting deterrent levers, while sizing data and virtual-fit tools appear under-optimized.
- Return rate: ~30% overall, 40–60% in fit-sensitive lines
- Fit/size cause: ~50–60% of returns
- Return-related margin drag: ~10–20%
- Customer segment: Best Agers favor lenient policies
- Data/tools: sizing analytics not fully mature
Premium price exposure
Premium positioning narrows TriStyles addressable market by excluding price-sensitive shoppers; during downturns trade-down pressure increases as consumers prioritize value over style.
Reliance on occasional discounting risks diluting perceived brand equity and margin; fast-fashion competitors can replicate looks at lower price points, intensifying share loss.
- Premium price exposure
- Smaller price-sensitive reach
- Higher trade-down risk in downturns
- Discounting dilutes brand equity
- Look-alikes from cheaper rivals
Aging customer base, costly catalogs and high returns shrink EU apparel upside
Heavy reliance on Best Agers (EU 65+ 20.8% in 2023) limits younger acquisition; catalog costs ($0.50–$3.00 per piece) raise CAC and emissions scrutiny; fit-driven returns (30% overall, 40–60% in fit lines) erode 10–20% margins; narrow EU focus (€396bn apparel market in 2023) and premium positioning reduce addressable share.
| Metric | Value |
|---|---|
| EU 65+ (2023) | 20.8% |
| Mailing cost (2024 est.) | $0.50–$3.00 |
| Return rate | 30% (40–60% fit lines) |
| Apparel market (EU, 2023) | €396bn |
What You See Is What You Get
TriStyle SWOT Analysis
This is the actual TriStyle SWOT analysis document you’ll receive upon purchase—no surprises, just professional quality. The preview below is taken directly from the full report; buying unlocks the complete, editable version with in-depth strengths, weaknesses, opportunities and threats. You’re viewing the real file that becomes available immediately after checkout.











