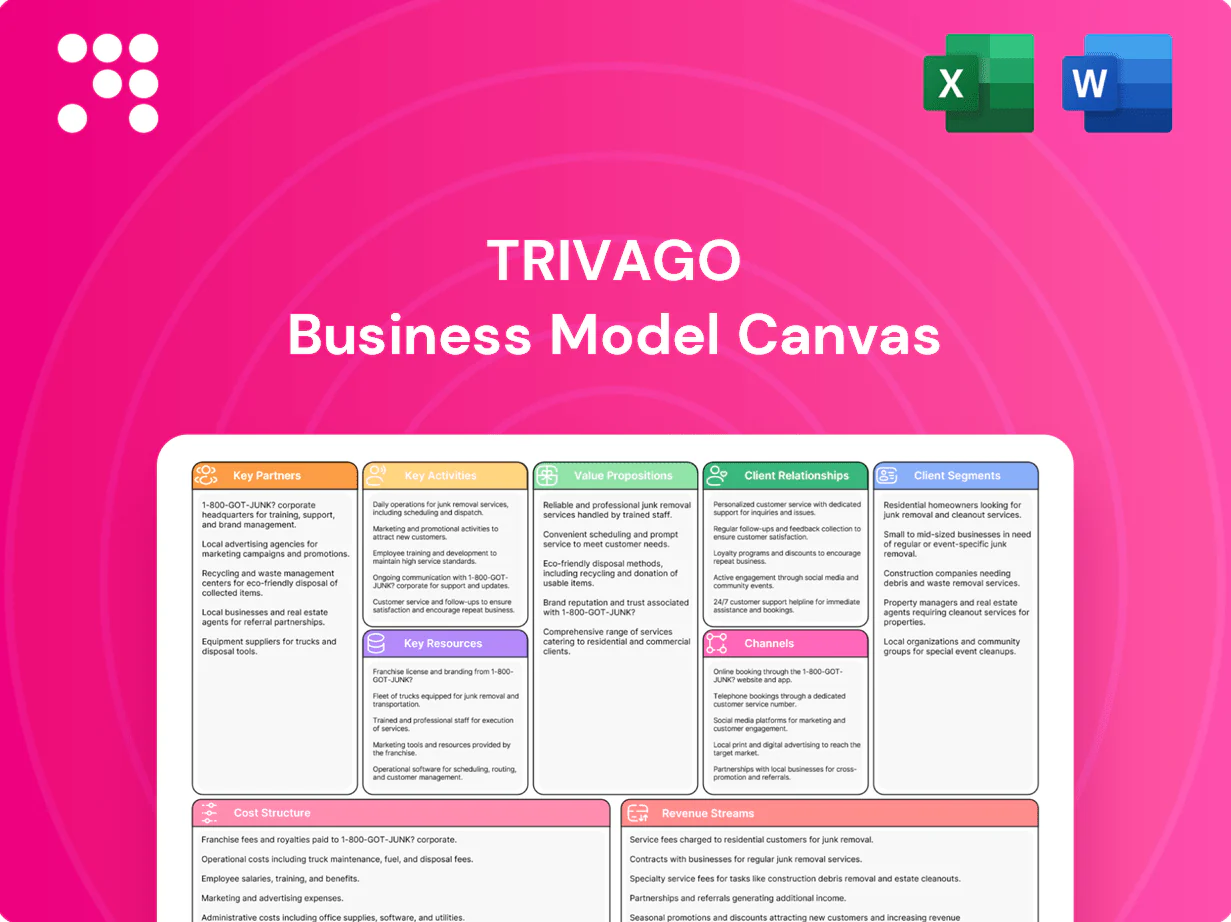
Trivago Business Model Canvas

Unlock strategic DNA with a concise Business Model Canvas and revenue levers
Unlock Trivago’s strategic DNA with a concise Business Model Canvas that maps customer segments, value propositions, key partners, and revenue levers. This snapshot distills how Trivago acquires users, monetizes traffic, and scales globally. Purchase the full Canvas to get editable Word/Excel files, deeper analysis, and actionable takeaways for investors and strategists.
Partnerships

Online travel agencies (OTAs)
OTAs supply the bulk of Trivago’s bookable inventory and bid for traffic via CPC/CPA models; Phocuswright 2024 shows OTAs drive roughly two-thirds of online hotel bookings in many markets. Strong partnerships secure wide rate coverage and competitive offers, while transparent performance metrics and reliable tracking underpin long-term cooperation. Joint seasonal campaigns can lift conversion rates significantly during peaks.
Hotel chains and independent properties
Direct hotel partners supply exclusive rates, availability and perks to differentiate listings, and in 2024 Trivago lists over 5 million properties and reaches millions of monthly users. Connectivity via APIs enables parity checks and real-time dynamic pricing, protecting rate integrity. Co-marketing campaigns help hotels shift mix toward direct channels, while data feedback loops from user searches and conversions improve yield management and visibility.

Connectivity and channel managers
Integrations with PMS, CRS, and channel managers ensure rates, inventory and content remain current across listings, reducing mismatches and lost sales. Stable APIs with 2024-grade SLAs cut errors and cancellations by improving real-time sync. Certification programs enforce data quality and uptime, while scalable connectivity reduces onboarding friction for long-tail hotels, accelerating go-live times.

Technology, cloud, and CDN providers
Technology, cloud, and CDN partners keep search fast and reliable worldwide; top cloud providers held ~31% (AWS), 23% (Azure) and 11% (GCP) market share in 2024. Observability and experimentation tooling tune relevance algorithms and support rapid A/B tests. Security partners harden the stack against abuse while cost-optimized infra and autoscaling absorb peak travel surges.
- Cloud market share 2024: AWS 31%, Azure 23%, GCP 11%
- Observability + experimentation for relevance
- Security partners mitigate abuse; autoscaling for peak demand
Marketing and affiliate networks
SEM, SEO and affiliate partners drive Trivago’s qualified demand funnel, with paid search and affiliates typically accounting for the majority of conversion-ready traffic; attribution alignment (last-click + multi-touch) keeps CAC efficient. Creative and localization partners lift CTRs and conversion rates across markets, while Meta and other social channels extend reach to new audiences—Meta reported ~3.07 billion monthly active users in 2024.
- SEM/SEO/affiliates: primary demand drivers
- Attribution alignment: improves spend efficiency
- Creative/localization: boosts ad performance
- Meta/social: expands audience reach (3.07B MAUs 2024)
OTAs drive ~66% of online hotel bookings; direct channels list 5M+ properties
OTAs drive ~two-thirds of online hotel bookings, supplying bulk inventory via CPC/CPA and ensuring wide rate coverage.
Direct hotels provide exclusive rates and perks across 5M+ properties listed in 2024, enabled by API parity checks.
Cloud and infra partners (AWS 31%, Azure 23%, GCP 11% in 2024) ensure fast search and autoscaling for peaks.
SEM/affiliates plus Meta (3.07B MAUs 2024) deliver conversion-ready demand with attribution alignment.
| Partner | Metric | 2024 |
|---|---|---|
| OTAs | Share | ~66% |
| Direct hotels | Properties | 5M+ |
| Cloud | Market share | AWS31%/Azure23%/GCP11% |
| Social/SEM | Reach | Meta 3.07B MAUs |
What is included in the product
 Detailed Word Document
A concise Business Model Canvas for Trivago detailing customer segments, value propositions, channels, revenue streams, key partners and activities, plus SWOT-linked insights to support presentations, investor discussions and strategic planning.

 Customizable Excel Spreadsheet
High-level view of Trivago’s business model that relieves strategic pain points by consolidating value propositions, partner channels, revenue streams and cost structure into editable cells for rapid analysis and decision-making.
Activities

Metasearch aggregation and normalization
Crawling, ingesting and standardizing rates and amenities across thousands of partners is core to Trivago’s metasearch, enabling comparison across over 5 million properties worldwide. De-duplication and mapping keep listings accurate so users see a single canonical offer. Real-time availability sync minimizes booking friction while continuous partner QA preserves platform trust.
Ranking, pricing, and relevance algorithms
Ranking models balance price, quality and partner performance to surface deals, feeding a system that supported Trivago’s platform as it pursued recovery after €264M revenue in 2023. Personalization algorithms lift conversion while algorithmic neutrality safeguards meta-search fairness. Continuous experimentation (thousands of A/B tests year-round) tunes UX and monetization. Click-quality controls and fraud filters reduce arbitrage and protect partner ROI.

Traffic acquisition and performance marketing
SEM, SEO and app-growth drive scale and predictable unit economics by lowering partner CPCs and boosting direct bookings; bid management ties spend to LTV and partner CPC targets to protect margins. Continuous creative testing raises CTR and reduces CAC across channels, while seasonality planning evens demand peaks and troughs to stabilize ROAS and inventory yield.

Partner onboarding and account management
Partner onboarding and account management leverages API integrations, automated feed validation and SLA setup to cut time-to-live by up to 40%, enabling faster inventory activation; ongoing bid optimization and A/B testing lift conversion and RevPAR contribution per partner. Regular compliance reviews maintain policy adherence and reduce delisting risk, while joint business planning targets high-growth segments and seasonal demand.
- APIs: faster activation (≤40%)
- Feed validation: fewer errors, higher uptime
- SLA: predictable go-live
- Optimization: improved bids & conversion
- Compliance: lowered policy risk
- Joint planning: targeted growth
Data analytics, reporting, and fraud prevention
Attribution, cohort analysis, and funnel metrics steer product and bid decisions across Trivago’s ~100 million monthly searches, linking channel spend to bookings and LTV. Partner-facing reports quantify performance and ROI by campaign; anomaly detection flags click-farm patterns amid industry IVT rates of 6–8%. Privacy and consent management align flows with GDPR (fines up to 4% of global turnover).
- Attribution
- Cohort analysis
- Funnel metrics
- Partner reporting
- Anomaly detection
- Privacy & consent (GDPR)
Crawling 5M+ properties, real-time sync and A/B testing power ~100M searches
Crawling, de-duplication and real-time sync across 5M+ properties enable Trivago’s meta-search and conversion optimization. Ranking, personalization and thousands of A/B tests drive relevance for ~100M monthly searches (2024) while partner QA and fraud controls limit IVT to ~6–8%. APIs, feed validation and SLA cut time-to-live by up to 40% and support RevPAR-linked monetization.
| Metric | Value |
|---|---|
| Properties | 5M+ |
| Monthly searches (2024) | ~100M |
| Revenue (2023) | €264M |
| Time-to-live | ≤40% |
| IVT | 6–8% |
| A/B tests/yr | Thousands |
What You See Is What You Get
Business Model Canvas
The document you're previewing is the actual Trivago Business Model Canvas you'll receive—no mockups or samples. Upon purchase you'll get this exact file with full content, formatted and ready to edit in Word and Excel. What you see is what you'll download.

Unlock strategic DNA with a concise Business Model Canvas and revenue levers
Unlock Trivago’s strategic DNA with a concise Business Model Canvas that maps customer segments, value propositions, key partners, and revenue levers. This snapshot distills how Trivago acquires users, monetizes traffic, and scales globally. Purchase the full Canvas to get editable Word/Excel files, deeper analysis, and actionable takeaways for investors and strategists.
Partnerships
Online travel agencies (OTAs)
OTAs supply the bulk of Trivago’s bookable inventory and bid for traffic via CPC/CPA models; Phocuswright 2024 shows OTAs drive roughly two-thirds of online hotel bookings in many markets. Strong partnerships secure wide rate coverage and competitive offers, while transparent performance metrics and reliable tracking underpin long-term cooperation. Joint seasonal campaigns can lift conversion rates significantly during peaks.
Hotel chains and independent properties
Direct hotel partners supply exclusive rates, availability and perks to differentiate listings, and in 2024 Trivago lists over 5 million properties and reaches millions of monthly users. Connectivity via APIs enables parity checks and real-time dynamic pricing, protecting rate integrity. Co-marketing campaigns help hotels shift mix toward direct channels, while data feedback loops from user searches and conversions improve yield management and visibility.
Connectivity and channel managers
Integrations with PMS, CRS, and channel managers ensure rates, inventory and content remain current across listings, reducing mismatches and lost sales. Stable APIs with 2024-grade SLAs cut errors and cancellations by improving real-time sync. Certification programs enforce data quality and uptime, while scalable connectivity reduces onboarding friction for long-tail hotels, accelerating go-live times.
Technology, cloud, and CDN providers
Technology, cloud, and CDN partners keep search fast and reliable worldwide; top cloud providers held ~31% (AWS), 23% (Azure) and 11% (GCP) market share in 2024. Observability and experimentation tooling tune relevance algorithms and support rapid A/B tests. Security partners harden the stack against abuse while cost-optimized infra and autoscaling absorb peak travel surges.
- Cloud market share 2024: AWS 31%, Azure 23%, GCP 11%
- Observability + experimentation for relevance
- Security partners mitigate abuse; autoscaling for peak demand
Marketing and affiliate networks
SEM, SEO and affiliate partners drive Trivago’s qualified demand funnel, with paid search and affiliates typically accounting for the majority of conversion-ready traffic; attribution alignment (last-click + multi-touch) keeps CAC efficient. Creative and localization partners lift CTRs and conversion rates across markets, while Meta and other social channels extend reach to new audiences—Meta reported ~3.07 billion monthly active users in 2024.
- SEM/SEO/affiliates: primary demand drivers
- Attribution alignment: improves spend efficiency
- Creative/localization: boosts ad performance
- Meta/social: expands audience reach (3.07B MAUs 2024)
OTAs drive ~66% of online hotel bookings; direct channels list 5M+ properties
OTAs drive ~two-thirds of online hotel bookings, supplying bulk inventory via CPC/CPA and ensuring wide rate coverage.
Direct hotels provide exclusive rates and perks across 5M+ properties listed in 2024, enabled by API parity checks.
Cloud and infra partners (AWS 31%, Azure 23%, GCP 11% in 2024) ensure fast search and autoscaling for peaks.
SEM/affiliates plus Meta (3.07B MAUs 2024) deliver conversion-ready demand with attribution alignment.
| Partner | Metric | 2024 |
|---|---|---|
| OTAs | Share | ~66% |
| Direct hotels | Properties | 5M+ |
| Cloud | Market share | AWS31%/Azure23%/GCP11% |
| Social/SEM | Reach | Meta 3.07B MAUs |
What is included in the product
Detailed Word Document
A concise Business Model Canvas for Trivago detailing customer segments, value propositions, channels, revenue streams, key partners and activities, plus SWOT-linked insights to support presentations, investor discussions and strategic planning.
Customizable Excel Spreadsheet
High-level view of Trivago’s business model that relieves strategic pain points by consolidating value propositions, partner channels, revenue streams and cost structure into editable cells for rapid analysis and decision-making.
Activities
Metasearch aggregation and normalization
Crawling, ingesting and standardizing rates and amenities across thousands of partners is core to Trivago’s metasearch, enabling comparison across over 5 million properties worldwide. De-duplication and mapping keep listings accurate so users see a single canonical offer. Real-time availability sync minimizes booking friction while continuous partner QA preserves platform trust.
Ranking, pricing, and relevance algorithms
Ranking models balance price, quality and partner performance to surface deals, feeding a system that supported Trivago’s platform as it pursued recovery after €264M revenue in 2023. Personalization algorithms lift conversion while algorithmic neutrality safeguards meta-search fairness. Continuous experimentation (thousands of A/B tests year-round) tunes UX and monetization. Click-quality controls and fraud filters reduce arbitrage and protect partner ROI.
Traffic acquisition and performance marketing
SEM, SEO and app-growth drive scale and predictable unit economics by lowering partner CPCs and boosting direct bookings; bid management ties spend to LTV and partner CPC targets to protect margins. Continuous creative testing raises CTR and reduces CAC across channels, while seasonality planning evens demand peaks and troughs to stabilize ROAS and inventory yield.
Partner onboarding and account management
Partner onboarding and account management leverages API integrations, automated feed validation and SLA setup to cut time-to-live by up to 40%, enabling faster inventory activation; ongoing bid optimization and A/B testing lift conversion and RevPAR contribution per partner. Regular compliance reviews maintain policy adherence and reduce delisting risk, while joint business planning targets high-growth segments and seasonal demand.
- APIs: faster activation (≤40%)
- Feed validation: fewer errors, higher uptime
- SLA: predictable go-live
- Optimization: improved bids & conversion
- Compliance: lowered policy risk
- Joint planning: targeted growth
Data analytics, reporting, and fraud prevention
Attribution, cohort analysis, and funnel metrics steer product and bid decisions across Trivago’s ~100 million monthly searches, linking channel spend to bookings and LTV. Partner-facing reports quantify performance and ROI by campaign; anomaly detection flags click-farm patterns amid industry IVT rates of 6–8%. Privacy and consent management align flows with GDPR (fines up to 4% of global turnover).
- Attribution
- Cohort analysis
- Funnel metrics
- Partner reporting
- Anomaly detection
- Privacy & consent (GDPR)
Crawling 5M+ properties, real-time sync and A/B testing power ~100M searches
Crawling, de-duplication and real-time sync across 5M+ properties enable Trivago’s meta-search and conversion optimization. Ranking, personalization and thousands of A/B tests drive relevance for ~100M monthly searches (2024) while partner QA and fraud controls limit IVT to ~6–8%. APIs, feed validation and SLA cut time-to-live by up to 40% and support RevPAR-linked monetization.
| Metric | Value |
|---|---|
| Properties | 5M+ |
| Monthly searches (2024) | ~100M |
| Revenue (2023) | €264M |
| Time-to-live | ≤40% |
| IVT | 6–8% |
| A/B tests/yr | Thousands |
What You See Is What You Get
Business Model Canvas
The document you're previewing is the actual Trivago Business Model Canvas you'll receive—no mockups or samples. Upon purchase you'll get this exact file with full content, formatted and ready to edit in Word and Excel. What you see is what you'll download.
Original: $10.00
-65%$10.00
$3.50Description
Unlock strategic DNA with a concise Business Model Canvas and revenue levers
Unlock Trivago’s strategic DNA with a concise Business Model Canvas that maps customer segments, value propositions, key partners, and revenue levers. This snapshot distills how Trivago acquires users, monetizes traffic, and scales globally. Purchase the full Canvas to get editable Word/Excel files, deeper analysis, and actionable takeaways for investors and strategists.
Partnerships
Online travel agencies (OTAs)
OTAs supply the bulk of Trivago’s bookable inventory and bid for traffic via CPC/CPA models; Phocuswright 2024 shows OTAs drive roughly two-thirds of online hotel bookings in many markets. Strong partnerships secure wide rate coverage and competitive offers, while transparent performance metrics and reliable tracking underpin long-term cooperation. Joint seasonal campaigns can lift conversion rates significantly during peaks.
Hotel chains and independent properties
Direct hotel partners supply exclusive rates, availability and perks to differentiate listings, and in 2024 Trivago lists over 5 million properties and reaches millions of monthly users. Connectivity via APIs enables parity checks and real-time dynamic pricing, protecting rate integrity. Co-marketing campaigns help hotels shift mix toward direct channels, while data feedback loops from user searches and conversions improve yield management and visibility.
Connectivity and channel managers
Integrations with PMS, CRS, and channel managers ensure rates, inventory and content remain current across listings, reducing mismatches and lost sales. Stable APIs with 2024-grade SLAs cut errors and cancellations by improving real-time sync. Certification programs enforce data quality and uptime, while scalable connectivity reduces onboarding friction for long-tail hotels, accelerating go-live times.
Technology, cloud, and CDN providers
Technology, cloud, and CDN partners keep search fast and reliable worldwide; top cloud providers held ~31% (AWS), 23% (Azure) and 11% (GCP) market share in 2024. Observability and experimentation tooling tune relevance algorithms and support rapid A/B tests. Security partners harden the stack against abuse while cost-optimized infra and autoscaling absorb peak travel surges.
- Cloud market share 2024: AWS 31%, Azure 23%, GCP 11%
- Observability + experimentation for relevance
- Security partners mitigate abuse; autoscaling for peak demand
Marketing and affiliate networks
SEM, SEO and affiliate partners drive Trivago’s qualified demand funnel, with paid search and affiliates typically accounting for the majority of conversion-ready traffic; attribution alignment (last-click + multi-touch) keeps CAC efficient. Creative and localization partners lift CTRs and conversion rates across markets, while Meta and other social channels extend reach to new audiences—Meta reported ~3.07 billion monthly active users in 2024.
- SEM/SEO/affiliates: primary demand drivers
- Attribution alignment: improves spend efficiency
- Creative/localization: boosts ad performance
- Meta/social: expands audience reach (3.07B MAUs 2024)
OTAs drive ~66% of online hotel bookings; direct channels list 5M+ properties
OTAs drive ~two-thirds of online hotel bookings, supplying bulk inventory via CPC/CPA and ensuring wide rate coverage.
Direct hotels provide exclusive rates and perks across 5M+ properties listed in 2024, enabled by API parity checks.
Cloud and infra partners (AWS 31%, Azure 23%, GCP 11% in 2024) ensure fast search and autoscaling for peaks.
SEM/affiliates plus Meta (3.07B MAUs 2024) deliver conversion-ready demand with attribution alignment.
| Partner | Metric | 2024 |
|---|---|---|
| OTAs | Share | ~66% |
| Direct hotels | Properties | 5M+ |
| Cloud | Market share | AWS31%/Azure23%/GCP11% |
| Social/SEM | Reach | Meta 3.07B MAUs |
What is included in the product
Detailed Word Document
A concise Business Model Canvas for Trivago detailing customer segments, value propositions, channels, revenue streams, key partners and activities, plus SWOT-linked insights to support presentations, investor discussions and strategic planning.
Customizable Excel Spreadsheet
High-level view of Trivago’s business model that relieves strategic pain points by consolidating value propositions, partner channels, revenue streams and cost structure into editable cells for rapid analysis and decision-making.
Activities
Metasearch aggregation and normalization
Crawling, ingesting and standardizing rates and amenities across thousands of partners is core to Trivago’s metasearch, enabling comparison across over 5 million properties worldwide. De-duplication and mapping keep listings accurate so users see a single canonical offer. Real-time availability sync minimizes booking friction while continuous partner QA preserves platform trust.
Ranking, pricing, and relevance algorithms
Ranking models balance price, quality and partner performance to surface deals, feeding a system that supported Trivago’s platform as it pursued recovery after €264M revenue in 2023. Personalization algorithms lift conversion while algorithmic neutrality safeguards meta-search fairness. Continuous experimentation (thousands of A/B tests year-round) tunes UX and monetization. Click-quality controls and fraud filters reduce arbitrage and protect partner ROI.
Traffic acquisition and performance marketing
SEM, SEO and app-growth drive scale and predictable unit economics by lowering partner CPCs and boosting direct bookings; bid management ties spend to LTV and partner CPC targets to protect margins. Continuous creative testing raises CTR and reduces CAC across channels, while seasonality planning evens demand peaks and troughs to stabilize ROAS and inventory yield.
Partner onboarding and account management
Partner onboarding and account management leverages API integrations, automated feed validation and SLA setup to cut time-to-live by up to 40%, enabling faster inventory activation; ongoing bid optimization and A/B testing lift conversion and RevPAR contribution per partner. Regular compliance reviews maintain policy adherence and reduce delisting risk, while joint business planning targets high-growth segments and seasonal demand.
- APIs: faster activation (≤40%)
- Feed validation: fewer errors, higher uptime
- SLA: predictable go-live
- Optimization: improved bids & conversion
- Compliance: lowered policy risk
- Joint planning: targeted growth
Data analytics, reporting, and fraud prevention
Attribution, cohort analysis, and funnel metrics steer product and bid decisions across Trivago’s ~100 million monthly searches, linking channel spend to bookings and LTV. Partner-facing reports quantify performance and ROI by campaign; anomaly detection flags click-farm patterns amid industry IVT rates of 6–8%. Privacy and consent management align flows with GDPR (fines up to 4% of global turnover).
- Attribution
- Cohort analysis
- Funnel metrics
- Partner reporting
- Anomaly detection
- Privacy & consent (GDPR)
Crawling 5M+ properties, real-time sync and A/B testing power ~100M searches
Crawling, de-duplication and real-time sync across 5M+ properties enable Trivago’s meta-search and conversion optimization. Ranking, personalization and thousands of A/B tests drive relevance for ~100M monthly searches (2024) while partner QA and fraud controls limit IVT to ~6–8%. APIs, feed validation and SLA cut time-to-live by up to 40% and support RevPAR-linked monetization.
| Metric | Value |
|---|---|
| Properties | 5M+ |
| Monthly searches (2024) | ~100M |
| Revenue (2023) | €264M |
| Time-to-live | ≤40% |
| IVT | 6–8% |
| A/B tests/yr | Thousands |
What You See Is What You Get
Business Model Canvas
The document you're previewing is the actual Trivago Business Model Canvas you'll receive—no mockups or samples. Upon purchase you'll get this exact file with full content, formatted and ready to edit in Word and Excel. What you see is what you'll download.











