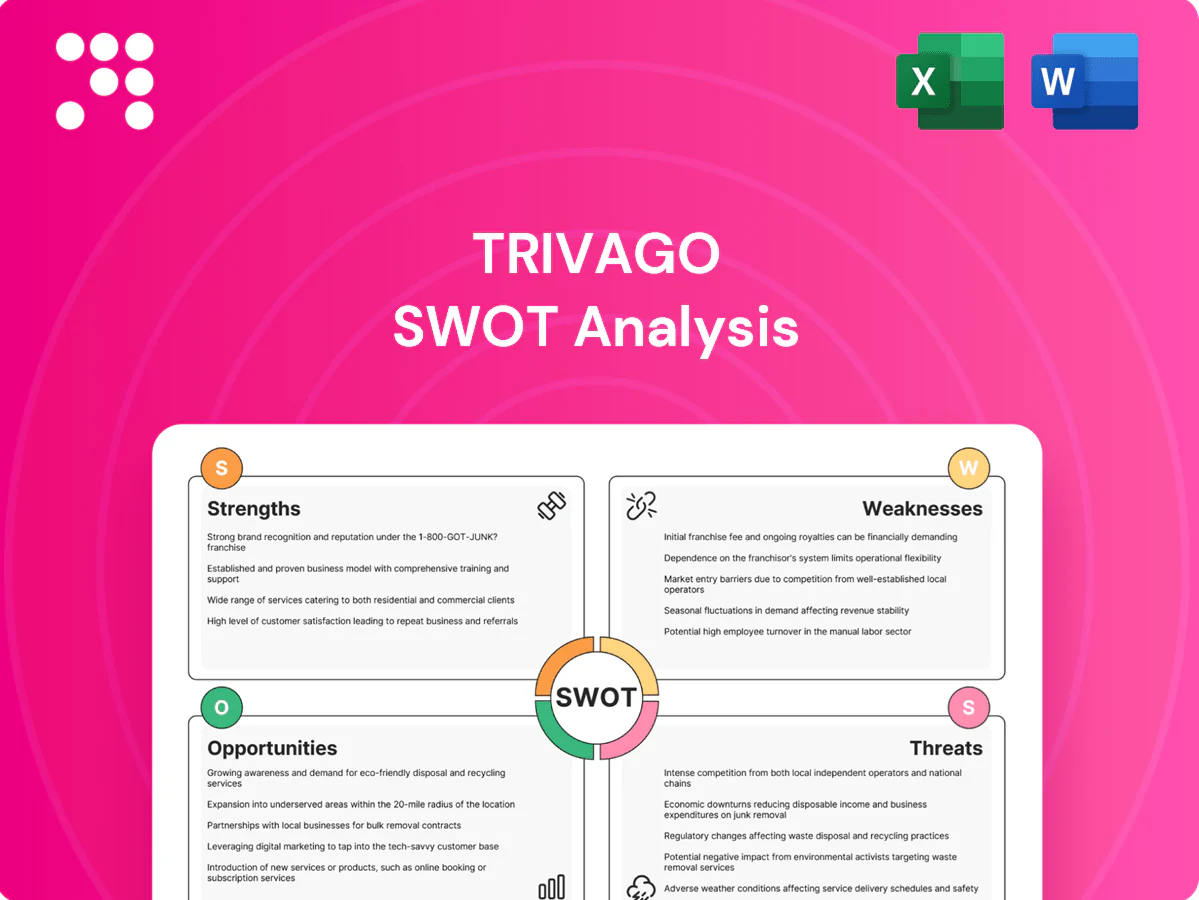
Trivago SWOT Analysis

Dive Deeper Into the Company’s Strategic Blueprint
Trivago’s strong global brand and high-traffic platform contrast with dependence on paid marketing and fierce OTA competition, while mobile monetization and strategic partnerships present growth avenues as Google and Expedia pose clear threats. Discover the full SWOT report—editable Word and Excel deliverables for investors and strategists.
Strengths

Global metasearch scale and brand recognition
Trivago operates in over 190 countries and 55 languages, giving it strong global brand recall in hotel price comparison. This wide reach draws both travelers and advertisers, reinforcing network effects that boost listings and demand. Broad inventory coverage increases relevance and click-through rates, while scale provides richer data for continual optimization and pricing insights.
Asset-light intermediary model
As a referral-based platform present in 190+ countries and listed on NASDAQ as TRVG, Trivago avoids inventory risk and heavy working capital by not owning hotels. The asset-light model prioritizes technology and marketing over operations, enabling rapid product iteration and scalability. Marketing spend remains largely variable and can be flexed with demand cycles to protect margins.

Diversified supply from OTAs and hotel chains
Aggregating prices from hundreds of OTAs and hotel chains gives Trivago deep price and availability coverage across millions of accommodations, increasing visible competitive options and improving advertiser conversion rates. Diversification reduces reliance on any single hotel inventory, mitigating gaps and seasonal shortages. This scale supports the price transparency users cite as a core value driver.

Data-driven performance marketing and pricing intelligence
Trivago leverages large-scale clickstream data to sharpen auction bidding, placement and ROI, while machine learning personalizes listings to boost ad yield and conversion. Granular attribution and budget controls give advertisers measurable ROI and campaign agility, and improved matching increases user satisfaction and repeat usage.
- clickstream-driven bidding
- ML personalization for higher ad yield
- granular attribution & budget control
- better match → higher retention
Two-sided network effects
Trivago’s two-sided network effects mean more advertisers improve coverage and price competitiveness, which attracts more users, while rising user traffic increases advertiser value and bid intensity, strengthening CPC and commission monetization and raising barriers for smaller entrants.
- Advertisers → broader inventory, sharper prices
- Users → higher conversion value for advertisers
- Monetization → CPC and commissions reinforced
- Barrier → scale advantage vs smaller entrants
Global hotel search platform in 190+ countries, 55 languages — asset-light referral model
Trivago operates in 190+ countries and 55 languages and is listed on NASDAQ as TRVG, giving strong global brand and advertiser reach.
The asset-light referral model avoids hotel inventory risk and focuses investment on technology and variable marketing spend.
Aggregation of hundreds of OTAs, clickstream-driven ML and two-sided network effects raise ad yield, conversion and scale barriers.
| Metric | Value |
|---|---|
| Presence | 190+ countries |
| Languages | 55 |
| Listing | NASDAQ: TRVG |
| Model | Asset-light, referral |
| Inventory | Hundreds of OTAs |
What is included in the product
 Detailed Word Document
Provides a concise SWOT assessment of Trivago, highlighting internal strengths and weaknesses and mapping external opportunities and threats to clarify its competitive position and strategic risks.

 Customizable Excel Spreadsheet
Provides a focused Trivago SWOT matrix to quickly surface competitive weaknesses and market opportunities, easing strategic prioritization and decision-making for product, marketing, and partnership teams.
Weaknesses

High dependence on traffic acquisition
Trivago remains highly dependent on paid channels and brand advertising to drive visits, making it vulnerable when auction dynamics or ad prices rise. Spikes in cost-per-click have compressed margins historically and organic search plus app engagement have not consistently offset those cost surges. Volatility in marketing ROI reduces revenue predictability and complicates quarterly guidance.
Limited control over end-to-end customer experience
Trivago redirects virtually all bookings to partner sites, so any friction or service failures on those pages directly damage perceived quality and net promoter scores. Industry conversion rates for metasearch listings often sit below 1%, giving Trivago fewer levers to recover lost sales. Limited control over post-click experience hampers rapid remediation and weakens loyalty versus full-stack platforms that own booking, payments and support.

Revenue concentration among major OTAs
A few large partners, notably Booking.com and Expedia Group, contribute a disproportionate share of Trivago click-out revenue, concentrating commercial exposure. That concentration gives dominant OTAs negotiation leverage over placement and CPC terms. Policy changes or budget pullbacks by these partners can materially impact Trivago’s traffic and revenue. Dependence on a small set of partners raises strategic and execution risk.

Low user switching costs
Travelers can bypass Trivago and compare prices directly on Google (global search share ~92% in 2024), Booking or Expedia, reducing stickiness and enabling instant switching.
Minimal differentiation beyond price comparison weakens retention; without direct-booking perks, loyalty and repeat usage remain low, pressuring CPCs and conversion rates.
- Easy comparison with dominant Google search (~92% market share, 2024)
- Limited product differentiation reduces user stickiness
- Low loyalty without booking incentives hampers repeat usage
- Downward pressure on CPCs and conversion
Thin take rates versus full-service booking
As a referrer, Trivago earns thin take rates—typically single-digit percentage points—well below full-service OTAs (15–25%), so revenue per booking is low and scaling needs huge click volumes and tight CPC/CPA optimization.
Any traffic or conversion decline rapidly pressures profitability; in 2024 Trivago reported year-over-year revenue sensitivity tied to advertising spend shifts and seasonality.
- Low take rates
- High volume dependence
- Conversion-sensitive margins
- Limited upsell/cross-sell
Paid-ads reliance and Google dominance squeeze margins; conversions under 1%
Heavy reliance on paid ads and CPC-driven traffic compresses margins; take rates are single-digit versus 15–25% for full OTAs, and metasearch conversion commonly <1%. Revenue concentration with major partners limits pricing leverage and magnifies downside when partners cut budgets. Low product differentiation and ability to bypass via Google (search ~92% in 2024) weakens retention and repeat usage.
| Weakness | Metric | 2024 value |
|---|---|---|
| Search dominance | Google share | ~92% |
| Take rate | Trivago vs OTAs | Single-digit vs 15–25% |
| Conversion | Metasearch | <1% |
Full Version Awaits
Trivago SWOT Analysis
This is the actual Trivago SWOT analysis document you’ll receive upon purchase—no surprises, just professional quality. The preview below is taken directly from the full report you'll get. Buy now to unlock the complete, editable version. The file shown here is the real analysis included in your download.

Dive Deeper Into the Company’s Strategic Blueprint
Trivago’s strong global brand and high-traffic platform contrast with dependence on paid marketing and fierce OTA competition, while mobile monetization and strategic partnerships present growth avenues as Google and Expedia pose clear threats. Discover the full SWOT report—editable Word and Excel deliverables for investors and strategists.
Strengths
Global metasearch scale and brand recognition
Trivago operates in over 190 countries and 55 languages, giving it strong global brand recall in hotel price comparison. This wide reach draws both travelers and advertisers, reinforcing network effects that boost listings and demand. Broad inventory coverage increases relevance and click-through rates, while scale provides richer data for continual optimization and pricing insights.
Asset-light intermediary model
As a referral-based platform present in 190+ countries and listed on NASDAQ as TRVG, Trivago avoids inventory risk and heavy working capital by not owning hotels. The asset-light model prioritizes technology and marketing over operations, enabling rapid product iteration and scalability. Marketing spend remains largely variable and can be flexed with demand cycles to protect margins.
Diversified supply from OTAs and hotel chains
Aggregating prices from hundreds of OTAs and hotel chains gives Trivago deep price and availability coverage across millions of accommodations, increasing visible competitive options and improving advertiser conversion rates. Diversification reduces reliance on any single hotel inventory, mitigating gaps and seasonal shortages. This scale supports the price transparency users cite as a core value driver.
Data-driven performance marketing and pricing intelligence
Trivago leverages large-scale clickstream data to sharpen auction bidding, placement and ROI, while machine learning personalizes listings to boost ad yield and conversion. Granular attribution and budget controls give advertisers measurable ROI and campaign agility, and improved matching increases user satisfaction and repeat usage.
- clickstream-driven bidding
- ML personalization for higher ad yield
- granular attribution & budget control
- better match → higher retention
Two-sided network effects
Trivago’s two-sided network effects mean more advertisers improve coverage and price competitiveness, which attracts more users, while rising user traffic increases advertiser value and bid intensity, strengthening CPC and commission monetization and raising barriers for smaller entrants.
- Advertisers → broader inventory, sharper prices
- Users → higher conversion value for advertisers
- Monetization → CPC and commissions reinforced
- Barrier → scale advantage vs smaller entrants
Global hotel search platform in 190+ countries, 55 languages — asset-light referral model
Trivago operates in 190+ countries and 55 languages and is listed on NASDAQ as TRVG, giving strong global brand and advertiser reach.
The asset-light referral model avoids hotel inventory risk and focuses investment on technology and variable marketing spend.
Aggregation of hundreds of OTAs, clickstream-driven ML and two-sided network effects raise ad yield, conversion and scale barriers.
| Metric | Value |
|---|---|
| Presence | 190+ countries |
| Languages | 55 |
| Listing | NASDAQ: TRVG |
| Model | Asset-light, referral |
| Inventory | Hundreds of OTAs |
What is included in the product
Detailed Word Document
Provides a concise SWOT assessment of Trivago, highlighting internal strengths and weaknesses and mapping external opportunities and threats to clarify its competitive position and strategic risks.
Customizable Excel Spreadsheet
Provides a focused Trivago SWOT matrix to quickly surface competitive weaknesses and market opportunities, easing strategic prioritization and decision-making for product, marketing, and partnership teams.
Weaknesses
High dependence on traffic acquisition
Trivago remains highly dependent on paid channels and brand advertising to drive visits, making it vulnerable when auction dynamics or ad prices rise. Spikes in cost-per-click have compressed margins historically and organic search plus app engagement have not consistently offset those cost surges. Volatility in marketing ROI reduces revenue predictability and complicates quarterly guidance.
Limited control over end-to-end customer experience
Trivago redirects virtually all bookings to partner sites, so any friction or service failures on those pages directly damage perceived quality and net promoter scores. Industry conversion rates for metasearch listings often sit below 1%, giving Trivago fewer levers to recover lost sales. Limited control over post-click experience hampers rapid remediation and weakens loyalty versus full-stack platforms that own booking, payments and support.
Revenue concentration among major OTAs
A few large partners, notably Booking.com and Expedia Group, contribute a disproportionate share of Trivago click-out revenue, concentrating commercial exposure. That concentration gives dominant OTAs negotiation leverage over placement and CPC terms. Policy changes or budget pullbacks by these partners can materially impact Trivago’s traffic and revenue. Dependence on a small set of partners raises strategic and execution risk.
Low user switching costs
Travelers can bypass Trivago and compare prices directly on Google (global search share ~92% in 2024), Booking or Expedia, reducing stickiness and enabling instant switching.
Minimal differentiation beyond price comparison weakens retention; without direct-booking perks, loyalty and repeat usage remain low, pressuring CPCs and conversion rates.
- Easy comparison with dominant Google search (~92% market share, 2024)
- Limited product differentiation reduces user stickiness
- Low loyalty without booking incentives hampers repeat usage
- Downward pressure on CPCs and conversion
Thin take rates versus full-service booking
As a referrer, Trivago earns thin take rates—typically single-digit percentage points—well below full-service OTAs (15–25%), so revenue per booking is low and scaling needs huge click volumes and tight CPC/CPA optimization.
Any traffic or conversion decline rapidly pressures profitability; in 2024 Trivago reported year-over-year revenue sensitivity tied to advertising spend shifts and seasonality.
- Low take rates
- High volume dependence
- Conversion-sensitive margins
- Limited upsell/cross-sell
Paid-ads reliance and Google dominance squeeze margins; conversions under 1%
Heavy reliance on paid ads and CPC-driven traffic compresses margins; take rates are single-digit versus 15–25% for full OTAs, and metasearch conversion commonly <1%. Revenue concentration with major partners limits pricing leverage and magnifies downside when partners cut budgets. Low product differentiation and ability to bypass via Google (search ~92% in 2024) weakens retention and repeat usage.
| Weakness | Metric | 2024 value |
|---|---|---|
| Search dominance | Google share | ~92% |
| Take rate | Trivago vs OTAs | Single-digit vs 15–25% |
| Conversion | Metasearch | <1% |
Full Version Awaits
Trivago SWOT Analysis
This is the actual Trivago SWOT analysis document you’ll receive upon purchase—no surprises, just professional quality. The preview below is taken directly from the full report you'll get. Buy now to unlock the complete, editable version. The file shown here is the real analysis included in your download.
Original: $10.00
-65%$10.00
$3.50Description
Dive Deeper Into the Company’s Strategic Blueprint
Trivago’s strong global brand and high-traffic platform contrast with dependence on paid marketing and fierce OTA competition, while mobile monetization and strategic partnerships present growth avenues as Google and Expedia pose clear threats. Discover the full SWOT report—editable Word and Excel deliverables for investors and strategists.
Strengths
Global metasearch scale and brand recognition
Trivago operates in over 190 countries and 55 languages, giving it strong global brand recall in hotel price comparison. This wide reach draws both travelers and advertisers, reinforcing network effects that boost listings and demand. Broad inventory coverage increases relevance and click-through rates, while scale provides richer data for continual optimization and pricing insights.
Asset-light intermediary model
As a referral-based platform present in 190+ countries and listed on NASDAQ as TRVG, Trivago avoids inventory risk and heavy working capital by not owning hotels. The asset-light model prioritizes technology and marketing over operations, enabling rapid product iteration and scalability. Marketing spend remains largely variable and can be flexed with demand cycles to protect margins.
Diversified supply from OTAs and hotel chains
Aggregating prices from hundreds of OTAs and hotel chains gives Trivago deep price and availability coverage across millions of accommodations, increasing visible competitive options and improving advertiser conversion rates. Diversification reduces reliance on any single hotel inventory, mitigating gaps and seasonal shortages. This scale supports the price transparency users cite as a core value driver.
Data-driven performance marketing and pricing intelligence
Trivago leverages large-scale clickstream data to sharpen auction bidding, placement and ROI, while machine learning personalizes listings to boost ad yield and conversion. Granular attribution and budget controls give advertisers measurable ROI and campaign agility, and improved matching increases user satisfaction and repeat usage.
- clickstream-driven bidding
- ML personalization for higher ad yield
- granular attribution & budget control
- better match → higher retention
Two-sided network effects
Trivago’s two-sided network effects mean more advertisers improve coverage and price competitiveness, which attracts more users, while rising user traffic increases advertiser value and bid intensity, strengthening CPC and commission monetization and raising barriers for smaller entrants.
- Advertisers → broader inventory, sharper prices
- Users → higher conversion value for advertisers
- Monetization → CPC and commissions reinforced
- Barrier → scale advantage vs smaller entrants
Global hotel search platform in 190+ countries, 55 languages — asset-light referral model
Trivago operates in 190+ countries and 55 languages and is listed on NASDAQ as TRVG, giving strong global brand and advertiser reach.
The asset-light referral model avoids hotel inventory risk and focuses investment on technology and variable marketing spend.
Aggregation of hundreds of OTAs, clickstream-driven ML and two-sided network effects raise ad yield, conversion and scale barriers.
| Metric | Value |
|---|---|
| Presence | 190+ countries |
| Languages | 55 |
| Listing | NASDAQ: TRVG |
| Model | Asset-light, referral |
| Inventory | Hundreds of OTAs |
What is included in the product
Detailed Word Document
Provides a concise SWOT assessment of Trivago, highlighting internal strengths and weaknesses and mapping external opportunities and threats to clarify its competitive position and strategic risks.
Customizable Excel Spreadsheet
Provides a focused Trivago SWOT matrix to quickly surface competitive weaknesses and market opportunities, easing strategic prioritization and decision-making for product, marketing, and partnership teams.
Weaknesses
High dependence on traffic acquisition
Trivago remains highly dependent on paid channels and brand advertising to drive visits, making it vulnerable when auction dynamics or ad prices rise. Spikes in cost-per-click have compressed margins historically and organic search plus app engagement have not consistently offset those cost surges. Volatility in marketing ROI reduces revenue predictability and complicates quarterly guidance.
Limited control over end-to-end customer experience
Trivago redirects virtually all bookings to partner sites, so any friction or service failures on those pages directly damage perceived quality and net promoter scores. Industry conversion rates for metasearch listings often sit below 1%, giving Trivago fewer levers to recover lost sales. Limited control over post-click experience hampers rapid remediation and weakens loyalty versus full-stack platforms that own booking, payments and support.
Revenue concentration among major OTAs
A few large partners, notably Booking.com and Expedia Group, contribute a disproportionate share of Trivago click-out revenue, concentrating commercial exposure. That concentration gives dominant OTAs negotiation leverage over placement and CPC terms. Policy changes or budget pullbacks by these partners can materially impact Trivago’s traffic and revenue. Dependence on a small set of partners raises strategic and execution risk.
Low user switching costs
Travelers can bypass Trivago and compare prices directly on Google (global search share ~92% in 2024), Booking or Expedia, reducing stickiness and enabling instant switching.
Minimal differentiation beyond price comparison weakens retention; without direct-booking perks, loyalty and repeat usage remain low, pressuring CPCs and conversion rates.
- Easy comparison with dominant Google search (~92% market share, 2024)
- Limited product differentiation reduces user stickiness
- Low loyalty without booking incentives hampers repeat usage
- Downward pressure on CPCs and conversion
Thin take rates versus full-service booking
As a referrer, Trivago earns thin take rates—typically single-digit percentage points—well below full-service OTAs (15–25%), so revenue per booking is low and scaling needs huge click volumes and tight CPC/CPA optimization.
Any traffic or conversion decline rapidly pressures profitability; in 2024 Trivago reported year-over-year revenue sensitivity tied to advertising spend shifts and seasonality.
- Low take rates
- High volume dependence
- Conversion-sensitive margins
- Limited upsell/cross-sell
Paid-ads reliance and Google dominance squeeze margins; conversions under 1%
Heavy reliance on paid ads and CPC-driven traffic compresses margins; take rates are single-digit versus 15–25% for full OTAs, and metasearch conversion commonly <1%. Revenue concentration with major partners limits pricing leverage and magnifies downside when partners cut budgets. Low product differentiation and ability to bypass via Google (search ~92% in 2024) weakens retention and repeat usage.
| Weakness | Metric | 2024 value |
|---|---|---|
| Search dominance | Google share | ~92% |
| Take rate | Trivago vs OTAs | Single-digit vs 15–25% |
| Conversion | Metasearch | <1% |
Full Version Awaits
Trivago SWOT Analysis
This is the actual Trivago SWOT analysis document you’ll receive upon purchase—no surprises, just professional quality. The preview below is taken directly from the full report you'll get. Buy now to unlock the complete, editable version. The file shown here is the real analysis included in your download.











