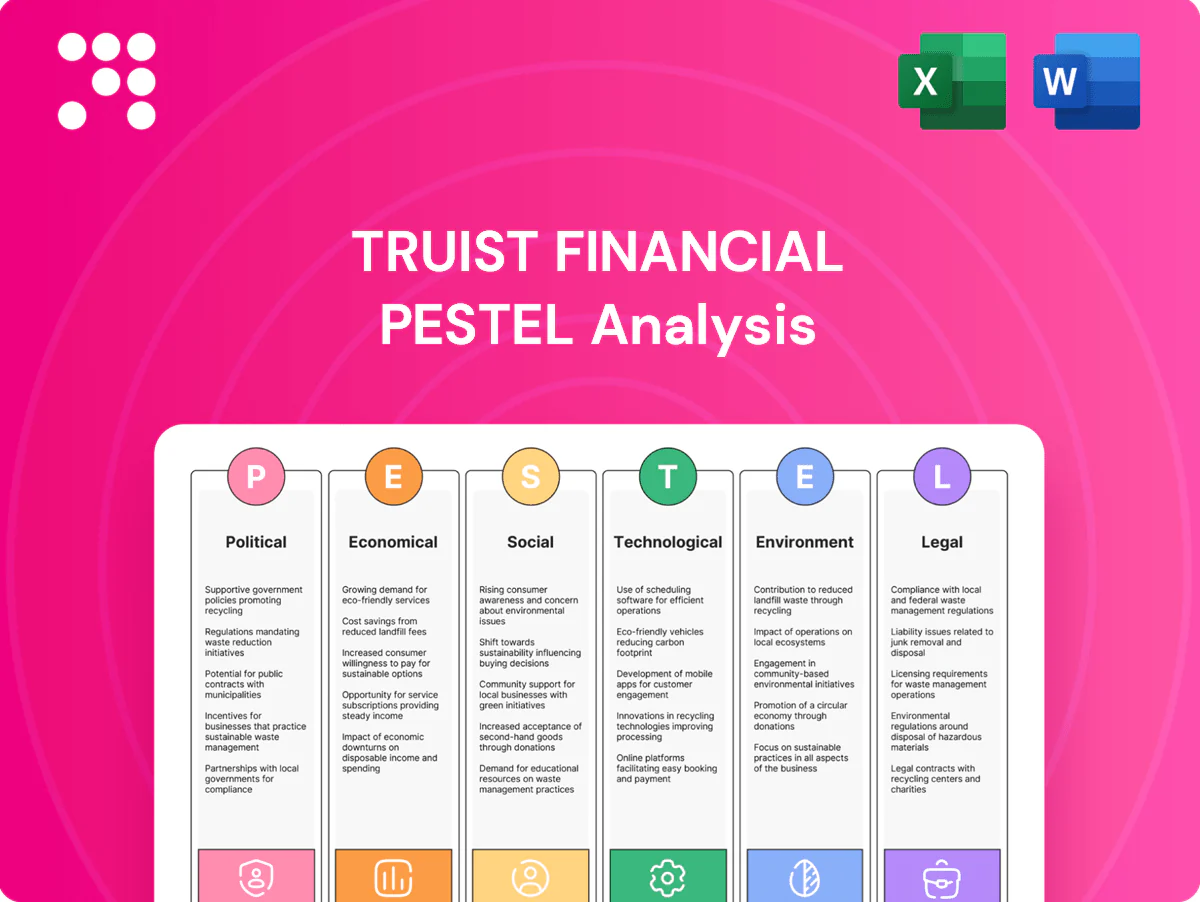
Truist Financial PESTLE Analysis

Plan Smarter. Present Sharper. Compete Stronger.
Unlock strategic clarity with our PESTLE analysis of Truist Financial—three concise perspectives on political, economic, and technological drivers reshaping the bank's outlook. Gain actionable insights to anticipate risks and spot growth opportunities. Purchase the full, downloadable report now for the complete, ready-to-use breakdown.
Political factors

US banking oversight (Fed, OCC, FDIC)
US supervisors (Fed, OCC, FDIC) shape Truist’s capital, liquidity and resolution planning—Truist, as a bank holding company above the $100 billion threshold, faces enhanced Fed oversight. The three high‑profile failures in 2023 (SVB, Signature, First Republic) drove elevated exam intensity that can constrain growth or force de‑risking. Quality of engagement with regulators materially affects product and M&A approvals. Regional bank scrutiny remains higher post‑2023 sector stress.
Election-driven policy shifts
Election-driven shifts in administration can re-prioritize consumer protection, fair lending, and tax policy, affecting Truist’s compliance burden and margins; Truist reported roughly $629 billion in assets at year-end 2024, so regulatory changes could materially impact capital and profitability levers. Budget choices influence SBA support and municipal activity—US muni issuance remained a key funding source in 2024—so scenario planning must cover multiple regulatory trajectories and cost scenarios.

Basel III Endgame and capital rules
Proposed Basel III Endgame recalibrations could raise RWAs and CET1 needs for market, credit, and operational risk, with industry estimates suggesting RWA increases of about 5–15% and CET1 demand rising roughly 25–75 bps. Higher capital buffers will pressure Truist’s ROE and pricing, forcing margin compression or repricing of risk-weighted products. Balance-sheet mix and hedging strategies are likely to be adjusted to optimize within new constraints, making advocacy and advanced modeling critical ahead of final rules.

Geopolitical risk and sanctions
Geopolitical risk and expanding sanctions regimes constrain correspondent banking, trade finance, and KYC screening, pressuring Truist, which manages over $500 billion in assets, to restrict exposures and client onboarding. Cyber threats spike during tensions, forcing heightened defense and incident-response readiness. Market volatility from shocks compresses underwriting margins and redirects wealth flows. Policy coordination across regulators demands robust, well-resourced compliance operations.
- sanctions:correspondent+trade+KYC
- cyber:heightened+defense
- volatility:underwriting+wealthflows
- compliance:policy+coordination
Community investment expectations
CRA modernization (finalized rules in 2023) guides Truist’s lending, investments and services toward LMI neighborhoods; with ~600 billion in assets, Truist must align branch deployment and product design to meet heightened financial inclusion priorities.
Political emphasis on inclusion affects branch footprints and affordable-product rollouts; meeting community objectives improves reputation and speeds approvals while data-driven CRA performance—now under tighter quantitative scrutiny—directly influences supervisory ratings.
- CRA rule finalization: 2023
- Truist scale: ~600 billion assets
- Focus: LMI lending, branch strategy, product access
- Trend: increasing data-driven CRA examinations
Heightened regulator scrutiny and Basel III lift RWAs 5-15%, CET1 +25-75 bps
Enhanced Fed/OCC/FDIC scrutiny (Truist >$629bn AUM end‑2024) raises compliance and capital planning costs; post‑2023 failures keep regional exam intensity high. Basel III Endgame could lift RWAs ~5–15% and CET1 needs ~25–75 bps, pressuring ROE and pricing. CRA modernization (2023) forces LMI lending and branch/product shifts, increasing operational and reporting burden.
| Metric | Value |
|---|---|
| Total assets (YE 2024) | $629bn |
| RWA uplift est. | 5–15% |
| CET1 impact est. | 25–75 bps |
| CRA rule | Finalized 2023 |
What is included in the product
 Detailed Word Document
Explores how Political, Economic, Social, Technological, Environmental and Legal forces uniquely impact Truist Financial, using current data and regional regulatory context to identify risks and opportunities; designed for executives and advisors to inform strategy, scenario planning and investor communications.

 Customizable Excel Spreadsheet
A concise, visually segmented Truist Financial PESTLE summary—ready to drop into presentations or strategy sessions—helps teams quickly align on external risks, market positioning, and add region‑ or line‑specific notes.
Economic factors

Interest-rate cycle and NIM
Rate path drives asset yields, deposit betas, and hedging outcomes — with the federal funds target at 5.25–5.50% (July 2025), higher short-term rates lift asset yields while accelerating deposit repricing pressure.
Rapid rate shifts can compress or expand Truist’s net interest margin as deposit betas rise and hedge effectiveness changes, stressing near-term NIM volatility.
Balance between fixed and floating exposures and strict ALM discipline, including hedging programs and duration limits, underpins earnings stability and capital planning.
Credit cycle and charge-offs
Economic softness has driven higher delinquencies across cards, autos and CRE, pressuring Truist's portfolios and increasing charge-off risk in 2024–25. CECL provisioning creates earnings volatility because lifetime loss recognition can require sizable, front-loaded reserves in downturns. Concentrated exposures in the Southeast and Mid-Atlantic mean localized economic and CRE dynamics materially affect loss rates. Strong underwriting and active workouts help mitigate loss severity.

Regional growth dynamics
Population inflows to the Sun Belt have boosted deposits, mortgages and small-business lending for regional banks like Truist, with Census estimates showing the South gaining roughly 5 million residents between 2020 and 2023, concentrating growth in metros such as Charlotte and Atlanta.
Infrastructure and housing cycles—residential starts in Sun Belt states ran above the national average in 2023 (single-family starts up about 10% year-over-year in key states)—directly influence mortgage demand and construction lending pipelines.
Employer expansions, including corporate relocations and tech hub growth, expand commercial loan opportunities: regional job gains in 2023 outpaced the national rate in several Sun Belt metros, feeding CRE and C&I pipelines.
Market share gains for Truist hinge on localized relationship coverage, where branch and commercial-banking density correlate with deposit and lending market share in high-growth Sun Belt counties.

Capital markets activity
Capital markets activity drives Truist's IB fees as ECM/DCM issuance and M&A advisory are highly sensitive to volatility and valuation swings; 2024 market softness weighed on fee pools while recoveries in sentiment can revive deal flow. Wealth management flows track market returns and client risk appetite, influencing fee income and deposits. Insurance commissions move with economic activity and pricing; diversification across banking, wealth, and insurance smooths revenue but cyclicality persists.
- IB fees: volatile with ECM/DCM and M&A
- Wealth flows: track market performance
- Insurance commissions: tied to economy/pricing
- Diversification: smooths but cycles remain
Inflation and cost structure
High inflation (US CPI ~3.4% in 2024) elevated compensation and vendor costs, squeezing Truist’s efficiency; fee and spread repricing have offset only part of the pressure. Truist is increasing tech spend to drive durable productivity gains and automation. Active vendor renegotiations and branch footprint optimization are being used to support margins.
- Inflation: US CPI ~3.4% (2024)
- Offset: fees/spreads partially mitigate margin pressure
- Remedies: tech investment, vendor renegotiation, footprint optimization
Heightened regulator scrutiny and Basel III lift RWAs 5-15%, CET1 +25-75 bps
Rate path (Fed funds 5.25–5.50% July 2025) lifts asset yields but raises deposit repricing and NIM volatility; CECL provisioning and higher delinquencies in 2024–25 increase reserve sensitivity. Sun Belt migration (+~5M residents 2020–23) and higher residential starts (~+10% in key states 2023) bolster mortgage, deposit and CRE pipelines. Inflation (~3.4% CPI 2024) pressures costs; tech spend and footprint optimization aim to restore efficiency.
| Metric | Value |
|---|---|
| Fed funds (Jul 2025) | 5.25–5.50% |
| US CPI (2024) | ~3.4% |
| Sun Belt pop gain (2020–23) | ~+5M |
| Res starts key states (2023) | ~+10% YoY |
What You See Is What You Get
Truist Financial PESTLE Analysis
The preview shown here is the exact Truist Financial PESTLE Analysis you’ll receive after purchase—fully formatted, professionally structured, and ready to use. This is a real snapshot of the product you’re buying, delivered exactly as shown with no placeholders or teasers. The layout, content, and structure visible are what you’ll download immediately after payment.

Plan Smarter. Present Sharper. Compete Stronger.
Unlock strategic clarity with our PESTLE analysis of Truist Financial—three concise perspectives on political, economic, and technological drivers reshaping the bank's outlook. Gain actionable insights to anticipate risks and spot growth opportunities. Purchase the full, downloadable report now for the complete, ready-to-use breakdown.
Political factors
US banking oversight (Fed, OCC, FDIC)
US supervisors (Fed, OCC, FDIC) shape Truist’s capital, liquidity and resolution planning—Truist, as a bank holding company above the $100 billion threshold, faces enhanced Fed oversight. The three high‑profile failures in 2023 (SVB, Signature, First Republic) drove elevated exam intensity that can constrain growth or force de‑risking. Quality of engagement with regulators materially affects product and M&A approvals. Regional bank scrutiny remains higher post‑2023 sector stress.
Election-driven policy shifts
Election-driven shifts in administration can re-prioritize consumer protection, fair lending, and tax policy, affecting Truist’s compliance burden and margins; Truist reported roughly $629 billion in assets at year-end 2024, so regulatory changes could materially impact capital and profitability levers. Budget choices influence SBA support and municipal activity—US muni issuance remained a key funding source in 2024—so scenario planning must cover multiple regulatory trajectories and cost scenarios.
Basel III Endgame and capital rules
Proposed Basel III Endgame recalibrations could raise RWAs and CET1 needs for market, credit, and operational risk, with industry estimates suggesting RWA increases of about 5–15% and CET1 demand rising roughly 25–75 bps. Higher capital buffers will pressure Truist’s ROE and pricing, forcing margin compression or repricing of risk-weighted products. Balance-sheet mix and hedging strategies are likely to be adjusted to optimize within new constraints, making advocacy and advanced modeling critical ahead of final rules.
Geopolitical risk and sanctions
Geopolitical risk and expanding sanctions regimes constrain correspondent banking, trade finance, and KYC screening, pressuring Truist, which manages over $500 billion in assets, to restrict exposures and client onboarding. Cyber threats spike during tensions, forcing heightened defense and incident-response readiness. Market volatility from shocks compresses underwriting margins and redirects wealth flows. Policy coordination across regulators demands robust, well-resourced compliance operations.
- sanctions:correspondent+trade+KYC
- cyber:heightened+defense
- volatility:underwriting+wealthflows
- compliance:policy+coordination
Community investment expectations
CRA modernization (finalized rules in 2023) guides Truist’s lending, investments and services toward LMI neighborhoods; with ~600 billion in assets, Truist must align branch deployment and product design to meet heightened financial inclusion priorities.
Political emphasis on inclusion affects branch footprints and affordable-product rollouts; meeting community objectives improves reputation and speeds approvals while data-driven CRA performance—now under tighter quantitative scrutiny—directly influences supervisory ratings.
- CRA rule finalization: 2023
- Truist scale: ~600 billion assets
- Focus: LMI lending, branch strategy, product access
- Trend: increasing data-driven CRA examinations
Heightened regulator scrutiny and Basel III lift RWAs 5-15%, CET1 +25-75 bps
Enhanced Fed/OCC/FDIC scrutiny (Truist >$629bn AUM end‑2024) raises compliance and capital planning costs; post‑2023 failures keep regional exam intensity high. Basel III Endgame could lift RWAs ~5–15% and CET1 needs ~25–75 bps, pressuring ROE and pricing. CRA modernization (2023) forces LMI lending and branch/product shifts, increasing operational and reporting burden.
| Metric | Value |
|---|---|
| Total assets (YE 2024) | $629bn |
| RWA uplift est. | 5–15% |
| CET1 impact est. | 25–75 bps |
| CRA rule | Finalized 2023 |
What is included in the product
Detailed Word Document
Explores how Political, Economic, Social, Technological, Environmental and Legal forces uniquely impact Truist Financial, using current data and regional regulatory context to identify risks and opportunities; designed for executives and advisors to inform strategy, scenario planning and investor communications.
Customizable Excel Spreadsheet
A concise, visually segmented Truist Financial PESTLE summary—ready to drop into presentations or strategy sessions—helps teams quickly align on external risks, market positioning, and add region‑ or line‑specific notes.
Economic factors
Interest-rate cycle and NIM
Rate path drives asset yields, deposit betas, and hedging outcomes — with the federal funds target at 5.25–5.50% (July 2025), higher short-term rates lift asset yields while accelerating deposit repricing pressure.
Rapid rate shifts can compress or expand Truist’s net interest margin as deposit betas rise and hedge effectiveness changes, stressing near-term NIM volatility.
Balance between fixed and floating exposures and strict ALM discipline, including hedging programs and duration limits, underpins earnings stability and capital planning.
Credit cycle and charge-offs
Economic softness has driven higher delinquencies across cards, autos and CRE, pressuring Truist's portfolios and increasing charge-off risk in 2024–25. CECL provisioning creates earnings volatility because lifetime loss recognition can require sizable, front-loaded reserves in downturns. Concentrated exposures in the Southeast and Mid-Atlantic mean localized economic and CRE dynamics materially affect loss rates. Strong underwriting and active workouts help mitigate loss severity.
Regional growth dynamics
Population inflows to the Sun Belt have boosted deposits, mortgages and small-business lending for regional banks like Truist, with Census estimates showing the South gaining roughly 5 million residents between 2020 and 2023, concentrating growth in metros such as Charlotte and Atlanta.
Infrastructure and housing cycles—residential starts in Sun Belt states ran above the national average in 2023 (single-family starts up about 10% year-over-year in key states)—directly influence mortgage demand and construction lending pipelines.
Employer expansions, including corporate relocations and tech hub growth, expand commercial loan opportunities: regional job gains in 2023 outpaced the national rate in several Sun Belt metros, feeding CRE and C&I pipelines.
Market share gains for Truist hinge on localized relationship coverage, where branch and commercial-banking density correlate with deposit and lending market share in high-growth Sun Belt counties.
Capital markets activity
Capital markets activity drives Truist's IB fees as ECM/DCM issuance and M&A advisory are highly sensitive to volatility and valuation swings; 2024 market softness weighed on fee pools while recoveries in sentiment can revive deal flow. Wealth management flows track market returns and client risk appetite, influencing fee income and deposits. Insurance commissions move with economic activity and pricing; diversification across banking, wealth, and insurance smooths revenue but cyclicality persists.
- IB fees: volatile with ECM/DCM and M&A
- Wealth flows: track market performance
- Insurance commissions: tied to economy/pricing
- Diversification: smooths but cycles remain
Inflation and cost structure
High inflation (US CPI ~3.4% in 2024) elevated compensation and vendor costs, squeezing Truist’s efficiency; fee and spread repricing have offset only part of the pressure. Truist is increasing tech spend to drive durable productivity gains and automation. Active vendor renegotiations and branch footprint optimization are being used to support margins.
- Inflation: US CPI ~3.4% (2024)
- Offset: fees/spreads partially mitigate margin pressure
- Remedies: tech investment, vendor renegotiation, footprint optimization
Heightened regulator scrutiny and Basel III lift RWAs 5-15%, CET1 +25-75 bps
Rate path (Fed funds 5.25–5.50% July 2025) lifts asset yields but raises deposit repricing and NIM volatility; CECL provisioning and higher delinquencies in 2024–25 increase reserve sensitivity. Sun Belt migration (+~5M residents 2020–23) and higher residential starts (~+10% in key states 2023) bolster mortgage, deposit and CRE pipelines. Inflation (~3.4% CPI 2024) pressures costs; tech spend and footprint optimization aim to restore efficiency.
| Metric | Value |
|---|---|
| Fed funds (Jul 2025) | 5.25–5.50% |
| US CPI (2024) | ~3.4% |
| Sun Belt pop gain (2020–23) | ~+5M |
| Res starts key states (2023) | ~+10% YoY |
What You See Is What You Get
Truist Financial PESTLE Analysis
The preview shown here is the exact Truist Financial PESTLE Analysis you’ll receive after purchase—fully formatted, professionally structured, and ready to use. This is a real snapshot of the product you’re buying, delivered exactly as shown with no placeholders or teasers. The layout, content, and structure visible are what you’ll download immediately after payment.
Original: $10.00
-65%$10.00
$3.50Description
Plan Smarter. Present Sharper. Compete Stronger.
Unlock strategic clarity with our PESTLE analysis of Truist Financial—three concise perspectives on political, economic, and technological drivers reshaping the bank's outlook. Gain actionable insights to anticipate risks and spot growth opportunities. Purchase the full, downloadable report now for the complete, ready-to-use breakdown.
Political factors
US banking oversight (Fed, OCC, FDIC)
US supervisors (Fed, OCC, FDIC) shape Truist’s capital, liquidity and resolution planning—Truist, as a bank holding company above the $100 billion threshold, faces enhanced Fed oversight. The three high‑profile failures in 2023 (SVB, Signature, First Republic) drove elevated exam intensity that can constrain growth or force de‑risking. Quality of engagement with regulators materially affects product and M&A approvals. Regional bank scrutiny remains higher post‑2023 sector stress.
Election-driven policy shifts
Election-driven shifts in administration can re-prioritize consumer protection, fair lending, and tax policy, affecting Truist’s compliance burden and margins; Truist reported roughly $629 billion in assets at year-end 2024, so regulatory changes could materially impact capital and profitability levers. Budget choices influence SBA support and municipal activity—US muni issuance remained a key funding source in 2024—so scenario planning must cover multiple regulatory trajectories and cost scenarios.
Basel III Endgame and capital rules
Proposed Basel III Endgame recalibrations could raise RWAs and CET1 needs for market, credit, and operational risk, with industry estimates suggesting RWA increases of about 5–15% and CET1 demand rising roughly 25–75 bps. Higher capital buffers will pressure Truist’s ROE and pricing, forcing margin compression or repricing of risk-weighted products. Balance-sheet mix and hedging strategies are likely to be adjusted to optimize within new constraints, making advocacy and advanced modeling critical ahead of final rules.
Geopolitical risk and sanctions
Geopolitical risk and expanding sanctions regimes constrain correspondent banking, trade finance, and KYC screening, pressuring Truist, which manages over $500 billion in assets, to restrict exposures and client onboarding. Cyber threats spike during tensions, forcing heightened defense and incident-response readiness. Market volatility from shocks compresses underwriting margins and redirects wealth flows. Policy coordination across regulators demands robust, well-resourced compliance operations.
- sanctions:correspondent+trade+KYC
- cyber:heightened+defense
- volatility:underwriting+wealthflows
- compliance:policy+coordination
Community investment expectations
CRA modernization (finalized rules in 2023) guides Truist’s lending, investments and services toward LMI neighborhoods; with ~600 billion in assets, Truist must align branch deployment and product design to meet heightened financial inclusion priorities.
Political emphasis on inclusion affects branch footprints and affordable-product rollouts; meeting community objectives improves reputation and speeds approvals while data-driven CRA performance—now under tighter quantitative scrutiny—directly influences supervisory ratings.
- CRA rule finalization: 2023
- Truist scale: ~600 billion assets
- Focus: LMI lending, branch strategy, product access
- Trend: increasing data-driven CRA examinations
Heightened regulator scrutiny and Basel III lift RWAs 5-15%, CET1 +25-75 bps
Enhanced Fed/OCC/FDIC scrutiny (Truist >$629bn AUM end‑2024) raises compliance and capital planning costs; post‑2023 failures keep regional exam intensity high. Basel III Endgame could lift RWAs ~5–15% and CET1 needs ~25–75 bps, pressuring ROE and pricing. CRA modernization (2023) forces LMI lending and branch/product shifts, increasing operational and reporting burden.
| Metric | Value |
|---|---|
| Total assets (YE 2024) | $629bn |
| RWA uplift est. | 5–15% |
| CET1 impact est. | 25–75 bps |
| CRA rule | Finalized 2023 |
What is included in the product
Detailed Word Document
Explores how Political, Economic, Social, Technological, Environmental and Legal forces uniquely impact Truist Financial, using current data and regional regulatory context to identify risks and opportunities; designed for executives and advisors to inform strategy, scenario planning and investor communications.
Customizable Excel Spreadsheet
A concise, visually segmented Truist Financial PESTLE summary—ready to drop into presentations or strategy sessions—helps teams quickly align on external risks, market positioning, and add region‑ or line‑specific notes.
Economic factors
Interest-rate cycle and NIM
Rate path drives asset yields, deposit betas, and hedging outcomes — with the federal funds target at 5.25–5.50% (July 2025), higher short-term rates lift asset yields while accelerating deposit repricing pressure.
Rapid rate shifts can compress or expand Truist’s net interest margin as deposit betas rise and hedge effectiveness changes, stressing near-term NIM volatility.
Balance between fixed and floating exposures and strict ALM discipline, including hedging programs and duration limits, underpins earnings stability and capital planning.
Credit cycle and charge-offs
Economic softness has driven higher delinquencies across cards, autos and CRE, pressuring Truist's portfolios and increasing charge-off risk in 2024–25. CECL provisioning creates earnings volatility because lifetime loss recognition can require sizable, front-loaded reserves in downturns. Concentrated exposures in the Southeast and Mid-Atlantic mean localized economic and CRE dynamics materially affect loss rates. Strong underwriting and active workouts help mitigate loss severity.
Regional growth dynamics
Population inflows to the Sun Belt have boosted deposits, mortgages and small-business lending for regional banks like Truist, with Census estimates showing the South gaining roughly 5 million residents between 2020 and 2023, concentrating growth in metros such as Charlotte and Atlanta.
Infrastructure and housing cycles—residential starts in Sun Belt states ran above the national average in 2023 (single-family starts up about 10% year-over-year in key states)—directly influence mortgage demand and construction lending pipelines.
Employer expansions, including corporate relocations and tech hub growth, expand commercial loan opportunities: regional job gains in 2023 outpaced the national rate in several Sun Belt metros, feeding CRE and C&I pipelines.
Market share gains for Truist hinge on localized relationship coverage, where branch and commercial-banking density correlate with deposit and lending market share in high-growth Sun Belt counties.
Capital markets activity
Capital markets activity drives Truist's IB fees as ECM/DCM issuance and M&A advisory are highly sensitive to volatility and valuation swings; 2024 market softness weighed on fee pools while recoveries in sentiment can revive deal flow. Wealth management flows track market returns and client risk appetite, influencing fee income and deposits. Insurance commissions move with economic activity and pricing; diversification across banking, wealth, and insurance smooths revenue but cyclicality persists.
- IB fees: volatile with ECM/DCM and M&A
- Wealth flows: track market performance
- Insurance commissions: tied to economy/pricing
- Diversification: smooths but cycles remain
Inflation and cost structure
High inflation (US CPI ~3.4% in 2024) elevated compensation and vendor costs, squeezing Truist’s efficiency; fee and spread repricing have offset only part of the pressure. Truist is increasing tech spend to drive durable productivity gains and automation. Active vendor renegotiations and branch footprint optimization are being used to support margins.
- Inflation: US CPI ~3.4% (2024)
- Offset: fees/spreads partially mitigate margin pressure
- Remedies: tech investment, vendor renegotiation, footprint optimization
Heightened regulator scrutiny and Basel III lift RWAs 5-15%, CET1 +25-75 bps
Rate path (Fed funds 5.25–5.50% July 2025) lifts asset yields but raises deposit repricing and NIM volatility; CECL provisioning and higher delinquencies in 2024–25 increase reserve sensitivity. Sun Belt migration (+~5M residents 2020–23) and higher residential starts (~+10% in key states 2023) bolster mortgage, deposit and CRE pipelines. Inflation (~3.4% CPI 2024) pressures costs; tech spend and footprint optimization aim to restore efficiency.
| Metric | Value |
|---|---|
| Fed funds (Jul 2025) | 5.25–5.50% |
| US CPI (2024) | ~3.4% |
| Sun Belt pop gain (2020–23) | ~+5M |
| Res starts key states (2023) | ~+10% YoY |
What You See Is What You Get
Truist Financial PESTLE Analysis
The preview shown here is the exact Truist Financial PESTLE Analysis you’ll receive after purchase—fully formatted, professionally structured, and ready to use. This is a real snapshot of the product you’re buying, delivered exactly as shown with no placeholders or teasers. The layout, content, and structure visible are what you’ll download immediately after payment.











