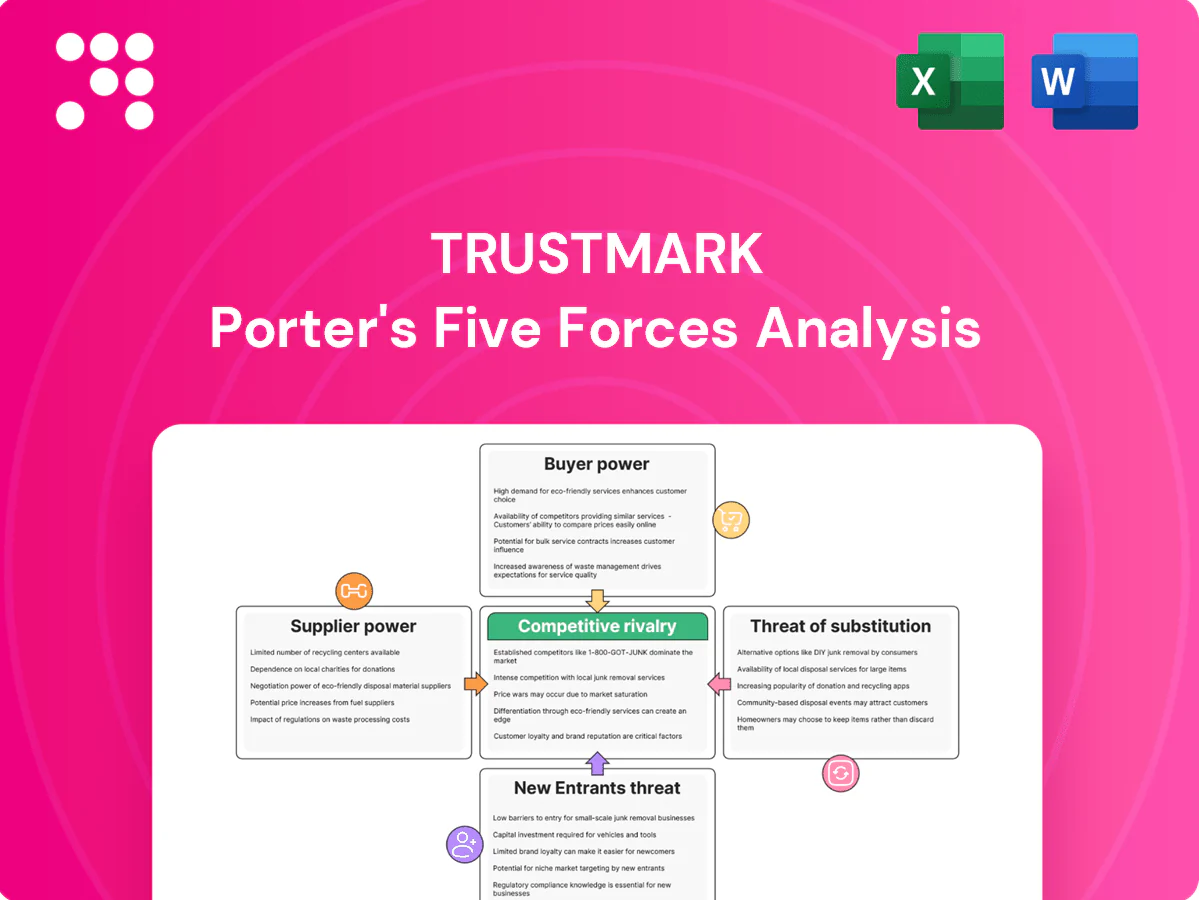
Trustmark Porter's Five Forces Analysis

Don't Miss the Bigger Picture
Trustmark faces moderate buyer power, niche supplier influence, and manageable threats from new entrants and substitutes—this snapshot highlights where competitive stress concentrates and where strategic levers exist. This brief only scratches the surface; unlock the full Porter's Five Forces Analysis to get force-by-force ratings, visuals, and actionable insights tailored to Trustmark.
Suppliers Bargaining Power

Core tech vendors concentration
Trustmark relies on a concentrated set of core processors, payments networks and cloud/data providers, with AWS (≈31%), Azure (≈22%) and Google Cloud (≈10%) holding the bulk of cloud capacity in 2024 and Visa+Mastercard accounting for roughly 78% of US card transactions (Nilson Report 2023), giving suppliers leverage on price and terms. Supplier switching is costly and operationally risky, though multi-year contracts and regulatory scrutiny limit abrupt changes. Co-development roadmaps reduce but do not remove vendor dependence.
Funding mix sensitivity
Depositors, FHLB advances and capital markets are Trustmark’s primary funding suppliers; with the fed funds target at 5.25–5.50% in 2024, tight liquidity pushes wholesale funding costs higher and depositors demand richer rates, lifting input costs. Trustmark’s brand and broad branch/relationship network help stabilize core deposits, but intensified rate competition heightens supplier bargaining power.

Talent as critical input
Experienced bankers, wealth advisors and underwriters remain scarce in 2024, raising supplier power for Trustmark as cyclic compensation and active poaching by larger peers push wages higher; remote work has expanded the hiring pool globally, intensifying bidding for senior talent. Strong culture, defined career paths and internal mobility materially reduce turnover risk and help offset labor bargaining leverage.

Data and risk tools
Credit bureaus, AML/KYC providers and analytics platforms act as specialized suppliers—the three major US bureaus hold roughly 95% of consumer credit files, AML/KYC vendor spend was around USD 2–3bn in 2024, and deep integration with client stacks plus 3–5 year contracts raise switching frictions, limiting substitution and strengthening supplier pricing power.
- Concentration: credit bureaus ~95% US market
- Market size: AML/KYC ~USD 2–3bn (2024)
- Contract terms: 3–5 years
- Volume discounts: ~10–20% but increase dependency
Insurance and investment product manufacturers
For Trustmark, carriers and asset managers materially shape shelf economics: platform access and revenue-sharing commonly range from about 10–50 basis points, directly compressing margins. A diversified lineup across 40+ carrier/manager relationships in 2024 reduces single-supplier leverage, and observed performance dispersion lets Trustmark curate offerings and renegotiate terms based on flows and alpha.
- revenue-sharing: 10–50 bps (2024 market norm)
- diversification: 40+ partners (Trustmark 2024)
- top-10 managers ~35% global AUM (2024)
Concentrated cloud and card rails, higher funding costs elevate supplier leverage
Suppliers exert moderate‑high power: concentrated cloud (AWS ≈31%, Azure ≈22%, GCP ≈10%) and card rails (Visa+MC ~78% US) raise leverage; funding costs rose with fed funds 5.25–5.50% (2024), boosting wholesale pricing pressure. Labor, bureaus (~95% files) and AML/KYC ($2–3bn) add switching frictions; diversification across 40+ managers softens some risk.
| Item | 2024 |
|---|---|
| Cloud share | AWS31%/Azure22%/GCP10% |
| Card rails | Visa+MC ~78% |
| Fed funds | 5.25–5.50% |
| Credit bureaus | ~95% |
| AML/KYC spend | $2–3bn |
| Managers | 40+ partners |
What is included in the product
 Detailed Word Document
Concise Porter's Five Forces analysis for Trustmark, uncovering competitive drivers, buyer/supplier power, threat of entrants and substitutes, and strategic levers to protect margins and market share.

 Customizable Excel Spreadsheet
One-sheet Trustmark Porter's Five Forces summary that instantly reveals strategic pressure with a spider chart, customizable pressure levels and labels, no macros—easy to copy into decks or integrate with Excel for fast, board-ready decision-making.
Customers Bargaining Power

Rate-sensitive depositors
Rate-sensitive depositors can rapidly shift funds to higher-yield options, with many online savings APYs topping 4% in 2024. Mobile comparison tools and aggregators increase price transparency and bargaining power, while relationship bundling (mortgages, payments, wealth) helps reduce churn. The 2024 federal funds target of 5.25–5.50% keeps rate competition intense, sharpening depositor leverage.
Commercial clients’ negotiating clout
Middle-market and treasury clients routinely secure custom pricing and covenants, with 2024 market surveys reporting about 60% of middle-market firms soliciting multiple lender bids, boosting their leverage versus a single-provider model. Competing proposals from regional and national banks intensify pricing pressure, while deeper cross-sell relationships at Trustmark help defend spreads; service quality and transaction speed remain decisive tie-breakers.

Wealth clients’ portability
Advisory and brokerage assets are highly portable via ACATS, which in 2024 still enables most U.S. account transfers in about 1–7 business days, and digital onboarding accelerates exits. Fee transparency gives clients leverage to demand discounts or tiering. Differentiated financial planning and a local adviser relationship can blunt pure price competition. Performance track record and trust remain primary drivers of retention.

Insurance shoppers
- tags: comparison ~60% (2024)
- tags: aggregators ~50% quote share
- tags: bundling increases stickiness
- tags: claims & coverage drive loyalty
Low switching frictions digitally
Account opening and payments migration now take minutes, reducing lock-in and raising buyer power across retail segments; industry reports in 2024 show digital onboarding times fell roughly 50% and contactless/tokenized payments surpassed 45% adoption in many markets, making frictionless service table stakes. Loyalty programs and data-driven personalization can partially restore switching costs, but firms must match seamless experiences just to stay even.
- Reduced onboarding times ~50% (2024)
- Payments tokenization adoption >45% (2024)
- Loyalty + personalization needed to offset higher buyer power
Customers demand yield and speed: >4% APYs, 1-7 day transfers
Customers exert strong price and convenience leverage: retail depositors chase >4% APYs, middle‑market firms solicit multiple bids (~60% in 2024), and brokerage transfers via ACATS move accounts in 1–7 days. Online aggregators drive ~50% of initial insurance quote searches and digital onboarding times dropped ~50% in 2024, while payments tokenization exceeded 45% adoption.
| Metric | 2024 Value |
|---|---|
| Retail APY competition | >4% |
| Middle‑market multi‑bid rate | ~60% |
| ACATS transfer time | 1–7 days |
| Aggregator quote share | ~50% |
| Onboarding time change | −50% |
| Payments tokenization | >45% |
Preview Before You Purchase
Trustmark Porter's Five Forces Analysis
This preview shows the exact Trustmark Porter's Five Forces Analysis you'll receive immediately after purchase—no placeholders or samples. The file is the fully formatted, final report, ready for download and use upon payment. You’re viewing the complete deliverable, with the same content, structure and visuals provided to buyers.

Don't Miss the Bigger Picture
Trustmark faces moderate buyer power, niche supplier influence, and manageable threats from new entrants and substitutes—this snapshot highlights where competitive stress concentrates and where strategic levers exist. This brief only scratches the surface; unlock the full Porter's Five Forces Analysis to get force-by-force ratings, visuals, and actionable insights tailored to Trustmark.
Suppliers Bargaining Power
Core tech vendors concentration
Trustmark relies on a concentrated set of core processors, payments networks and cloud/data providers, with AWS (≈31%), Azure (≈22%) and Google Cloud (≈10%) holding the bulk of cloud capacity in 2024 and Visa+Mastercard accounting for roughly 78% of US card transactions (Nilson Report 2023), giving suppliers leverage on price and terms. Supplier switching is costly and operationally risky, though multi-year contracts and regulatory scrutiny limit abrupt changes. Co-development roadmaps reduce but do not remove vendor dependence.
Funding mix sensitivity
Depositors, FHLB advances and capital markets are Trustmark’s primary funding suppliers; with the fed funds target at 5.25–5.50% in 2024, tight liquidity pushes wholesale funding costs higher and depositors demand richer rates, lifting input costs. Trustmark’s brand and broad branch/relationship network help stabilize core deposits, but intensified rate competition heightens supplier bargaining power.
Talent as critical input
Experienced bankers, wealth advisors and underwriters remain scarce in 2024, raising supplier power for Trustmark as cyclic compensation and active poaching by larger peers push wages higher; remote work has expanded the hiring pool globally, intensifying bidding for senior talent. Strong culture, defined career paths and internal mobility materially reduce turnover risk and help offset labor bargaining leverage.
Data and risk tools
Credit bureaus, AML/KYC providers and analytics platforms act as specialized suppliers—the three major US bureaus hold roughly 95% of consumer credit files, AML/KYC vendor spend was around USD 2–3bn in 2024, and deep integration with client stacks plus 3–5 year contracts raise switching frictions, limiting substitution and strengthening supplier pricing power.
- Concentration: credit bureaus ~95% US market
- Market size: AML/KYC ~USD 2–3bn (2024)
- Contract terms: 3–5 years
- Volume discounts: ~10–20% but increase dependency
Insurance and investment product manufacturers
For Trustmark, carriers and asset managers materially shape shelf economics: platform access and revenue-sharing commonly range from about 10–50 basis points, directly compressing margins. A diversified lineup across 40+ carrier/manager relationships in 2024 reduces single-supplier leverage, and observed performance dispersion lets Trustmark curate offerings and renegotiate terms based on flows and alpha.
- revenue-sharing: 10–50 bps (2024 market norm)
- diversification: 40+ partners (Trustmark 2024)
- top-10 managers ~35% global AUM (2024)
Concentrated cloud and card rails, higher funding costs elevate supplier leverage
Suppliers exert moderate‑high power: concentrated cloud (AWS ≈31%, Azure ≈22%, GCP ≈10%) and card rails (Visa+MC ~78% US) raise leverage; funding costs rose with fed funds 5.25–5.50% (2024), boosting wholesale pricing pressure. Labor, bureaus (~95% files) and AML/KYC ($2–3bn) add switching frictions; diversification across 40+ managers softens some risk.
| Item | 2024 |
|---|---|
| Cloud share | AWS31%/Azure22%/GCP10% |
| Card rails | Visa+MC ~78% |
| Fed funds | 5.25–5.50% |
| Credit bureaus | ~95% |
| AML/KYC spend | $2–3bn |
| Managers | 40+ partners |
What is included in the product
Detailed Word Document
Concise Porter's Five Forces analysis for Trustmark, uncovering competitive drivers, buyer/supplier power, threat of entrants and substitutes, and strategic levers to protect margins and market share.
Customizable Excel Spreadsheet
One-sheet Trustmark Porter's Five Forces summary that instantly reveals strategic pressure with a spider chart, customizable pressure levels and labels, no macros—easy to copy into decks or integrate with Excel for fast, board-ready decision-making.
Customers Bargaining Power
Rate-sensitive depositors
Rate-sensitive depositors can rapidly shift funds to higher-yield options, with many online savings APYs topping 4% in 2024. Mobile comparison tools and aggregators increase price transparency and bargaining power, while relationship bundling (mortgages, payments, wealth) helps reduce churn. The 2024 federal funds target of 5.25–5.50% keeps rate competition intense, sharpening depositor leverage.
Commercial clients’ negotiating clout
Middle-market and treasury clients routinely secure custom pricing and covenants, with 2024 market surveys reporting about 60% of middle-market firms soliciting multiple lender bids, boosting their leverage versus a single-provider model. Competing proposals from regional and national banks intensify pricing pressure, while deeper cross-sell relationships at Trustmark help defend spreads; service quality and transaction speed remain decisive tie-breakers.
Wealth clients’ portability
Advisory and brokerage assets are highly portable via ACATS, which in 2024 still enables most U.S. account transfers in about 1–7 business days, and digital onboarding accelerates exits. Fee transparency gives clients leverage to demand discounts or tiering. Differentiated financial planning and a local adviser relationship can blunt pure price competition. Performance track record and trust remain primary drivers of retention.
Insurance shoppers
- tags: comparison ~60% (2024)
- tags: aggregators ~50% quote share
- tags: bundling increases stickiness
- tags: claims & coverage drive loyalty
Low switching frictions digitally
Account opening and payments migration now take minutes, reducing lock-in and raising buyer power across retail segments; industry reports in 2024 show digital onboarding times fell roughly 50% and contactless/tokenized payments surpassed 45% adoption in many markets, making frictionless service table stakes. Loyalty programs and data-driven personalization can partially restore switching costs, but firms must match seamless experiences just to stay even.
- Reduced onboarding times ~50% (2024)
- Payments tokenization adoption >45% (2024)
- Loyalty + personalization needed to offset higher buyer power
Customers demand yield and speed: >4% APYs, 1-7 day transfers
Customers exert strong price and convenience leverage: retail depositors chase >4% APYs, middle‑market firms solicit multiple bids (~60% in 2024), and brokerage transfers via ACATS move accounts in 1–7 days. Online aggregators drive ~50% of initial insurance quote searches and digital onboarding times dropped ~50% in 2024, while payments tokenization exceeded 45% adoption.
| Metric | 2024 Value |
|---|---|
| Retail APY competition | >4% |
| Middle‑market multi‑bid rate | ~60% |
| ACATS transfer time | 1–7 days |
| Aggregator quote share | ~50% |
| Onboarding time change | −50% |
| Payments tokenization | >45% |
Preview Before You Purchase
Trustmark Porter's Five Forces Analysis
This preview shows the exact Trustmark Porter's Five Forces Analysis you'll receive immediately after purchase—no placeholders or samples. The file is the fully formatted, final report, ready for download and use upon payment. You’re viewing the complete deliverable, with the same content, structure and visuals provided to buyers.
Original: $10.00
-65%$10.00
$3.50Description
Don't Miss the Bigger Picture
Trustmark faces moderate buyer power, niche supplier influence, and manageable threats from new entrants and substitutes—this snapshot highlights where competitive stress concentrates and where strategic levers exist. This brief only scratches the surface; unlock the full Porter's Five Forces Analysis to get force-by-force ratings, visuals, and actionable insights tailored to Trustmark.
Suppliers Bargaining Power
Core tech vendors concentration
Trustmark relies on a concentrated set of core processors, payments networks and cloud/data providers, with AWS (≈31%), Azure (≈22%) and Google Cloud (≈10%) holding the bulk of cloud capacity in 2024 and Visa+Mastercard accounting for roughly 78% of US card transactions (Nilson Report 2023), giving suppliers leverage on price and terms. Supplier switching is costly and operationally risky, though multi-year contracts and regulatory scrutiny limit abrupt changes. Co-development roadmaps reduce but do not remove vendor dependence.
Funding mix sensitivity
Depositors, FHLB advances and capital markets are Trustmark’s primary funding suppliers; with the fed funds target at 5.25–5.50% in 2024, tight liquidity pushes wholesale funding costs higher and depositors demand richer rates, lifting input costs. Trustmark’s brand and broad branch/relationship network help stabilize core deposits, but intensified rate competition heightens supplier bargaining power.
Talent as critical input
Experienced bankers, wealth advisors and underwriters remain scarce in 2024, raising supplier power for Trustmark as cyclic compensation and active poaching by larger peers push wages higher; remote work has expanded the hiring pool globally, intensifying bidding for senior talent. Strong culture, defined career paths and internal mobility materially reduce turnover risk and help offset labor bargaining leverage.
Data and risk tools
Credit bureaus, AML/KYC providers and analytics platforms act as specialized suppliers—the three major US bureaus hold roughly 95% of consumer credit files, AML/KYC vendor spend was around USD 2–3bn in 2024, and deep integration with client stacks plus 3–5 year contracts raise switching frictions, limiting substitution and strengthening supplier pricing power.
- Concentration: credit bureaus ~95% US market
- Market size: AML/KYC ~USD 2–3bn (2024)
- Contract terms: 3–5 years
- Volume discounts: ~10–20% but increase dependency
Insurance and investment product manufacturers
For Trustmark, carriers and asset managers materially shape shelf economics: platform access and revenue-sharing commonly range from about 10–50 basis points, directly compressing margins. A diversified lineup across 40+ carrier/manager relationships in 2024 reduces single-supplier leverage, and observed performance dispersion lets Trustmark curate offerings and renegotiate terms based on flows and alpha.
- revenue-sharing: 10–50 bps (2024 market norm)
- diversification: 40+ partners (Trustmark 2024)
- top-10 managers ~35% global AUM (2024)
Concentrated cloud and card rails, higher funding costs elevate supplier leverage
Suppliers exert moderate‑high power: concentrated cloud (AWS ≈31%, Azure ≈22%, GCP ≈10%) and card rails (Visa+MC ~78% US) raise leverage; funding costs rose with fed funds 5.25–5.50% (2024), boosting wholesale pricing pressure. Labor, bureaus (~95% files) and AML/KYC ($2–3bn) add switching frictions; diversification across 40+ managers softens some risk.
| Item | 2024 |
|---|---|
| Cloud share | AWS31%/Azure22%/GCP10% |
| Card rails | Visa+MC ~78% |
| Fed funds | 5.25–5.50% |
| Credit bureaus | ~95% |
| AML/KYC spend | $2–3bn |
| Managers | 40+ partners |
What is included in the product
Detailed Word Document
Concise Porter's Five Forces analysis for Trustmark, uncovering competitive drivers, buyer/supplier power, threat of entrants and substitutes, and strategic levers to protect margins and market share.
Customizable Excel Spreadsheet
One-sheet Trustmark Porter's Five Forces summary that instantly reveals strategic pressure with a spider chart, customizable pressure levels and labels, no macros—easy to copy into decks or integrate with Excel for fast, board-ready decision-making.
Customers Bargaining Power
Rate-sensitive depositors
Rate-sensitive depositors can rapidly shift funds to higher-yield options, with many online savings APYs topping 4% in 2024. Mobile comparison tools and aggregators increase price transparency and bargaining power, while relationship bundling (mortgages, payments, wealth) helps reduce churn. The 2024 federal funds target of 5.25–5.50% keeps rate competition intense, sharpening depositor leverage.
Commercial clients’ negotiating clout
Middle-market and treasury clients routinely secure custom pricing and covenants, with 2024 market surveys reporting about 60% of middle-market firms soliciting multiple lender bids, boosting their leverage versus a single-provider model. Competing proposals from regional and national banks intensify pricing pressure, while deeper cross-sell relationships at Trustmark help defend spreads; service quality and transaction speed remain decisive tie-breakers.
Wealth clients’ portability
Advisory and brokerage assets are highly portable via ACATS, which in 2024 still enables most U.S. account transfers in about 1–7 business days, and digital onboarding accelerates exits. Fee transparency gives clients leverage to demand discounts or tiering. Differentiated financial planning and a local adviser relationship can blunt pure price competition. Performance track record and trust remain primary drivers of retention.
Insurance shoppers
- tags: comparison ~60% (2024)
- tags: aggregators ~50% quote share
- tags: bundling increases stickiness
- tags: claims & coverage drive loyalty
Low switching frictions digitally
Account opening and payments migration now take minutes, reducing lock-in and raising buyer power across retail segments; industry reports in 2024 show digital onboarding times fell roughly 50% and contactless/tokenized payments surpassed 45% adoption in many markets, making frictionless service table stakes. Loyalty programs and data-driven personalization can partially restore switching costs, but firms must match seamless experiences just to stay even.
- Reduced onboarding times ~50% (2024)
- Payments tokenization adoption >45% (2024)
- Loyalty + personalization needed to offset higher buyer power
Customers demand yield and speed: >4% APYs, 1-7 day transfers
Customers exert strong price and convenience leverage: retail depositors chase >4% APYs, middle‑market firms solicit multiple bids (~60% in 2024), and brokerage transfers via ACATS move accounts in 1–7 days. Online aggregators drive ~50% of initial insurance quote searches and digital onboarding times dropped ~50% in 2024, while payments tokenization exceeded 45% adoption.
| Metric | 2024 Value |
|---|---|
| Retail APY competition | >4% |
| Middle‑market multi‑bid rate | ~60% |
| ACATS transfer time | 1–7 days |
| Aggregator quote share | ~50% |
| Onboarding time change | −50% |
| Payments tokenization | >45% |
Preview Before You Purchase
Trustmark Porter's Five Forces Analysis
This preview shows the exact Trustmark Porter's Five Forces Analysis you'll receive immediately after purchase—no placeholders or samples. The file is the fully formatted, final report, ready for download and use upon payment. You’re viewing the complete deliverable, with the same content, structure and visuals provided to buyers.











