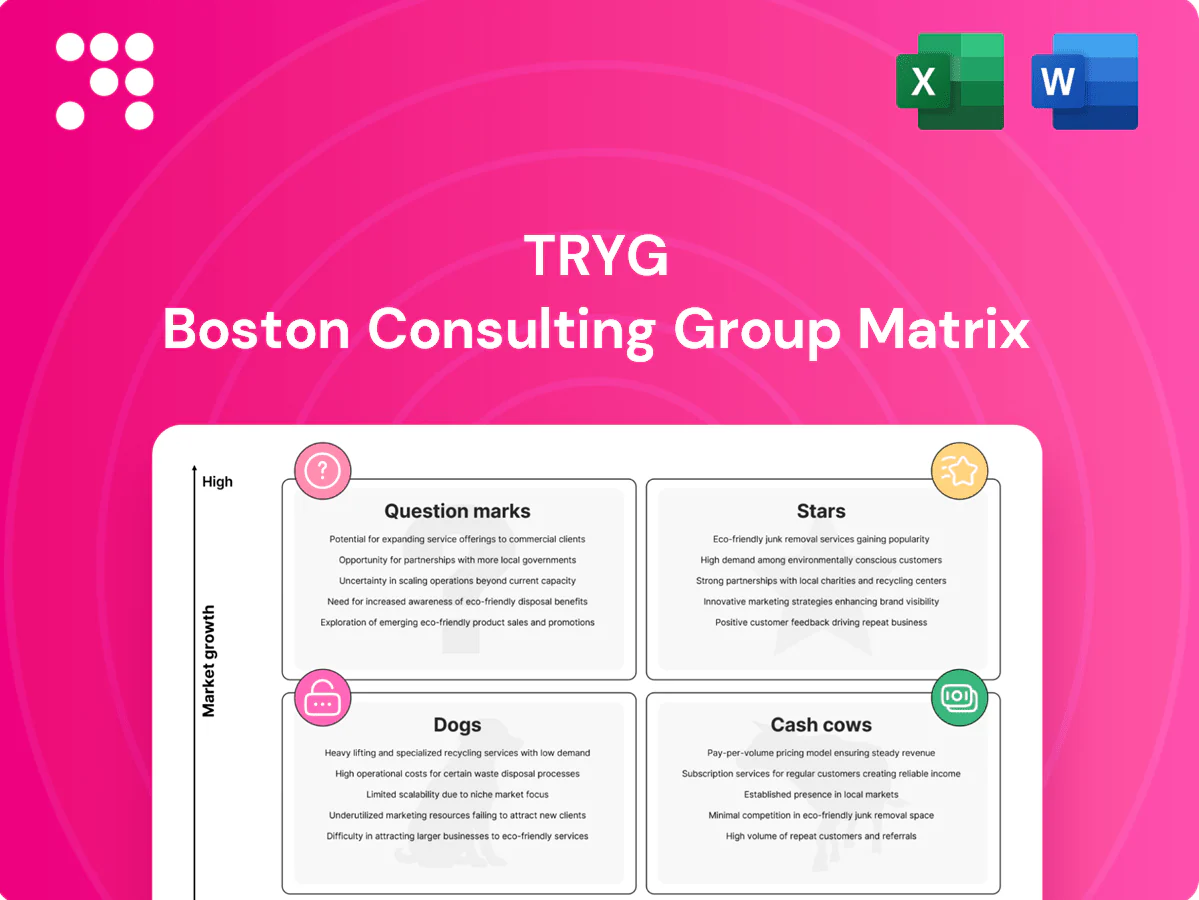
Tryg Boston Consulting Group Matrix

Unlock Strategic Clarity
Want to know which of Tryg’s products are market winners, which generate steady cash, and which are dragging results down? This Tryg BCG Matrix preview gives you the outline—buy the full report to see precise quadrant placements, data-backed recommendations, and a clear action plan. Get it in Word and Excel for easy presenting and further analysis. Purchase now to skip the guesswork and start reallocating capital with confidence.
Stars

DK/NO Private P&C leadership
DK/NO Private P&C is a Star for Tryg with roughly 30% market share in Denmark and ~18% in Norway, growing premium income (~+8% Y/Y in 2024) driven by inflation-led price increases and add-on upsell; Tryg’s brand and broad distribution sustain the lead but require steady marketing and claims innovation to defend margin. Cash in largely matches cash out as growth consumes investment; keep leaning in to defend share and let this mature into Cash Cow.
SME insurance momentum
SME insurance momentum: SMEs are buying broader covers and higher limits, with Tryg holding a market-leading footprint in Denmark (>30% share) and strong presence in Norway; cross-sell of property, liability and cyber add‑ons is driving fast SME growth (>15% YoY) and solid retention (~90%). It needs more sales enablement and broker engagement, plus investment to scale underwriting capacity and digital quoting in 2024.

Health insurance add‑ons
Private health and wellness riders grew in 2024 roughly 25% faster than Tryg’s core non‑life market, driven by demand for preventive care and mental health services. Tryg’s strong brand and employer distribution enable bundled offers with reported take‑up approaching 30% in workplace schemes. Growth is brisk but needs continuous product refresh and provider networks; modest capex reallocations can compound into a durable income stream.

Digital claims experience
Tryg’s digital claims experience is a Star: 2024 digital adoption ~65% with high satisfaction and clear retention drivers; it lowers loss‑adjustment expense (LAE) materially but requires continuous tech spend and AI tuning as market digital usage rises and leaders widen their gap fast.
- Keep funding automation and straight‑through claims to lock in advantage
Direct and omnichannel distribution
Tryg leverages strong direct traffic plus brokers and partners to reach roughly 3 million customers, giving scale and rich claims and behavioral data that keep acquisition costs efficient but require ongoing investment in media, CX and analytics.
As the market shifts online, digital leaders consolidate share; Tryg should double down on precision marketing and streamlined onboarding flows to capture this migration.
- Scale: ~3 million customers
- Focus: precision marketing, onboarding
- Invest: media, CX, analytics
DK/NO P&C: DK ~30%, NO ~18%, +8%premiums
DK/NO Private P&C is a Star for Tryg (DK ~30% share, NO ~18%) with premium growth ~+8% Y/Y in 2024; SMEs grow >15% YoY with ~90% retention; private health riders grew ~25% faster than core. Digital claims adoption ~65% in 2024 lowers LAE but needs ongoing AI and automation spend; scale ~3.0m customers supports efficient acquisition.
| Metric | 2024 |
|---|---|
| DK market share | ~30% |
| NO market share | ~18% |
| Premium growth | +8% Y/Y |
| SME growth | >15% Y/Y |
| Retention | ~90% |
| Digital adoption | ~65% |
| Customers | ~3.0m |
What is included in the product
 Detailed Word Document
Clear BCG Matrix analysis of Tryg’s units—Stars, Cash Cows, Question Marks, Dogs—with investment, divestment and trend insights.

 Customizable Excel Spreadsheet
One-page Tryg BCG Matrix placing each business unit in a quadrant to cut analysis time and align exec decisions.
Cash Cows

Home & contents (mature Nordic)
Home & contents (mature Nordic) represents a large, sticky book for Tryg with renewal rates around 90% and strong pricing power; market growth was modest at roughly 2–3% in 2024. Tight underwriting sustains attractive margins with a combined ratio near 90%, needing limited promo spend beyond brand maintenance. The line is a reliable cash generator, funding automation and FNOL efficiency investments.
Motor insurance core book
Tryg’s motor insurance core book, with roughly DKK 11bn in annual premiums, leverages scale, rich telematics and claims datasets, and extensive repair-network agreements to keep loss ratios in check. Unit growth is modest, yet recurring premiums deliver reliable cash generation and contributed materially to Tryg’s 2024 operating profit. Telematics pockets show double-digit growth potential, while disciplined rating and tight claims leakage control maximize yield.

Established commercial property
Established commercial property sits in Tryg's cash‑cow quadrant with mature segments, solid broker relationships and predictable loss trends reported as stable through H1 2024. Low organic growth but high in‑force value means infrastructure and pricing tools in 2024 lift margin more than new business. Strategy is to harvest cash while fine‑tuning portfolio mix and selective re-pricing.

Bancassurance & affinity renewals
Bancassurance and affinity renewals at Tryg act as cash cows: partnership channels deliver recurring policy flows at low incremental cost, growth was flat in 2024 while churn remained low and marketing spend minimal, allowing the unit to fund broader innovation and product development; maintain tight SLAs and renegotiate commercial terms to sustain contribution.
- Low incremental cost
- Flat growth, low churn (2024)
- Minimal marketing spend
- Funds innovation
- Tighten SLAs, renegotiate terms
Accident & travel add‑ons (core, stable)
Accident and travel add‑ons show high penetration and, at group scale, claims volatility is manageable, delivering a dependable margin rather than significant growth; minimal sales effort beyond cross‑sell prompts sustains volumes while pricing analytics keep profitability steady.
- High penetration
- Manageable claims volatility
- Dependable margin, low growth
- Minimal cross‑sell effort
- Pricing analytics maintain profitability
Stable, high-margin cash engines: home renewals ~90%, motor DKK 11bn
Tryg’s cash‑cow lines (home & contents, motor, commercial property, bancassurance, accident/add‑ons) generated stable, high-margin cash flow in 2024: home renewals ~90% and combined ratio ~90%; motor premiums ~DKK 11bn with disciplined underwriting; commercial property stable H1 2024; bancassurance flat growth with low acquisition cost.
| Line | 2024 metric | Growth | Role |
|---|---|---|---|
| Home & contents | Renewal ~90% | 2–3% | Fund investments |
| Motor | Premiums DKK 11bn | Modest | Core cash |
| Commercial prop | Stable H1 2024 | Low | Harvest |
| Bancassurance | Low cost | Flat | Recurring cash |
Delivered as Shown
Tryg BCG Matrix
The file you're previewing is the exact BCG Matrix document you'll receive after purchase—no watermarks, no demo copy, just the finished, professionally formatted report. It's built for immediate use: editable, printable, and ready to drop straight into your strategy sessions or investor decks. Buy once and get the full file delivered instantly to your inbox. No surprises, no follow-ups—just clean, analysis-ready material you can trust.

Unlock Strategic Clarity
Want to know which of Tryg’s products are market winners, which generate steady cash, and which are dragging results down? This Tryg BCG Matrix preview gives you the outline—buy the full report to see precise quadrant placements, data-backed recommendations, and a clear action plan. Get it in Word and Excel for easy presenting and further analysis. Purchase now to skip the guesswork and start reallocating capital with confidence.
Stars
DK/NO Private P&C leadership
DK/NO Private P&C is a Star for Tryg with roughly 30% market share in Denmark and ~18% in Norway, growing premium income (~+8% Y/Y in 2024) driven by inflation-led price increases and add-on upsell; Tryg’s brand and broad distribution sustain the lead but require steady marketing and claims innovation to defend margin. Cash in largely matches cash out as growth consumes investment; keep leaning in to defend share and let this mature into Cash Cow.
SME insurance momentum
SME insurance momentum: SMEs are buying broader covers and higher limits, with Tryg holding a market-leading footprint in Denmark (>30% share) and strong presence in Norway; cross-sell of property, liability and cyber add‑ons is driving fast SME growth (>15% YoY) and solid retention (~90%). It needs more sales enablement and broker engagement, plus investment to scale underwriting capacity and digital quoting in 2024.
Health insurance add‑ons
Private health and wellness riders grew in 2024 roughly 25% faster than Tryg’s core non‑life market, driven by demand for preventive care and mental health services. Tryg’s strong brand and employer distribution enable bundled offers with reported take‑up approaching 30% in workplace schemes. Growth is brisk but needs continuous product refresh and provider networks; modest capex reallocations can compound into a durable income stream.
Digital claims experience
Tryg’s digital claims experience is a Star: 2024 digital adoption ~65% with high satisfaction and clear retention drivers; it lowers loss‑adjustment expense (LAE) materially but requires continuous tech spend and AI tuning as market digital usage rises and leaders widen their gap fast.
- Keep funding automation and straight‑through claims to lock in advantage
Direct and omnichannel distribution
Tryg leverages strong direct traffic plus brokers and partners to reach roughly 3 million customers, giving scale and rich claims and behavioral data that keep acquisition costs efficient but require ongoing investment in media, CX and analytics.
As the market shifts online, digital leaders consolidate share; Tryg should double down on precision marketing and streamlined onboarding flows to capture this migration.
- Scale: ~3 million customers
- Focus: precision marketing, onboarding
- Invest: media, CX, analytics
DK/NO P&C: DK ~30%, NO ~18%, +8%premiums
DK/NO Private P&C is a Star for Tryg (DK ~30% share, NO ~18%) with premium growth ~+8% Y/Y in 2024; SMEs grow >15% YoY with ~90% retention; private health riders grew ~25% faster than core. Digital claims adoption ~65% in 2024 lowers LAE but needs ongoing AI and automation spend; scale ~3.0m customers supports efficient acquisition.
| Metric | 2024 |
|---|---|
| DK market share | ~30% |
| NO market share | ~18% |
| Premium growth | +8% Y/Y |
| SME growth | >15% Y/Y |
| Retention | ~90% |
| Digital adoption | ~65% |
| Customers | ~3.0m |
What is included in the product
Detailed Word Document
Clear BCG Matrix analysis of Tryg’s units—Stars, Cash Cows, Question Marks, Dogs—with investment, divestment and trend insights.
Customizable Excel Spreadsheet
One-page Tryg BCG Matrix placing each business unit in a quadrant to cut analysis time and align exec decisions.
Cash Cows
Home & contents (mature Nordic)
Home & contents (mature Nordic) represents a large, sticky book for Tryg with renewal rates around 90% and strong pricing power; market growth was modest at roughly 2–3% in 2024. Tight underwriting sustains attractive margins with a combined ratio near 90%, needing limited promo spend beyond brand maintenance. The line is a reliable cash generator, funding automation and FNOL efficiency investments.
Motor insurance core book
Tryg’s motor insurance core book, with roughly DKK 11bn in annual premiums, leverages scale, rich telematics and claims datasets, and extensive repair-network agreements to keep loss ratios in check. Unit growth is modest, yet recurring premiums deliver reliable cash generation and contributed materially to Tryg’s 2024 operating profit. Telematics pockets show double-digit growth potential, while disciplined rating and tight claims leakage control maximize yield.
Established commercial property
Established commercial property sits in Tryg's cash‑cow quadrant with mature segments, solid broker relationships and predictable loss trends reported as stable through H1 2024. Low organic growth but high in‑force value means infrastructure and pricing tools in 2024 lift margin more than new business. Strategy is to harvest cash while fine‑tuning portfolio mix and selective re-pricing.
Bancassurance & affinity renewals
Bancassurance and affinity renewals at Tryg act as cash cows: partnership channels deliver recurring policy flows at low incremental cost, growth was flat in 2024 while churn remained low and marketing spend minimal, allowing the unit to fund broader innovation and product development; maintain tight SLAs and renegotiate commercial terms to sustain contribution.
- Low incremental cost
- Flat growth, low churn (2024)
- Minimal marketing spend
- Funds innovation
- Tighten SLAs, renegotiate terms
Accident & travel add‑ons (core, stable)
Accident and travel add‑ons show high penetration and, at group scale, claims volatility is manageable, delivering a dependable margin rather than significant growth; minimal sales effort beyond cross‑sell prompts sustains volumes while pricing analytics keep profitability steady.
- High penetration
- Manageable claims volatility
- Dependable margin, low growth
- Minimal cross‑sell effort
- Pricing analytics maintain profitability
Stable, high-margin cash engines: home renewals ~90%, motor DKK 11bn
Tryg’s cash‑cow lines (home & contents, motor, commercial property, bancassurance, accident/add‑ons) generated stable, high-margin cash flow in 2024: home renewals ~90% and combined ratio ~90%; motor premiums ~DKK 11bn with disciplined underwriting; commercial property stable H1 2024; bancassurance flat growth with low acquisition cost.
| Line | 2024 metric | Growth | Role |
|---|---|---|---|
| Home & contents | Renewal ~90% | 2–3% | Fund investments |
| Motor | Premiums DKK 11bn | Modest | Core cash |
| Commercial prop | Stable H1 2024 | Low | Harvest |
| Bancassurance | Low cost | Flat | Recurring cash |
Delivered as Shown
Tryg BCG Matrix
The file you're previewing is the exact BCG Matrix document you'll receive after purchase—no watermarks, no demo copy, just the finished, professionally formatted report. It's built for immediate use: editable, printable, and ready to drop straight into your strategy sessions or investor decks. Buy once and get the full file delivered instantly to your inbox. No surprises, no follow-ups—just clean, analysis-ready material you can trust.
Description
Unlock Strategic Clarity
Want to know which of Tryg’s products are market winners, which generate steady cash, and which are dragging results down? This Tryg BCG Matrix preview gives you the outline—buy the full report to see precise quadrant placements, data-backed recommendations, and a clear action plan. Get it in Word and Excel for easy presenting and further analysis. Purchase now to skip the guesswork and start reallocating capital with confidence.
Stars
DK/NO Private P&C leadership
DK/NO Private P&C is a Star for Tryg with roughly 30% market share in Denmark and ~18% in Norway, growing premium income (~+8% Y/Y in 2024) driven by inflation-led price increases and add-on upsell; Tryg’s brand and broad distribution sustain the lead but require steady marketing and claims innovation to defend margin. Cash in largely matches cash out as growth consumes investment; keep leaning in to defend share and let this mature into Cash Cow.
SME insurance momentum
SME insurance momentum: SMEs are buying broader covers and higher limits, with Tryg holding a market-leading footprint in Denmark (>30% share) and strong presence in Norway; cross-sell of property, liability and cyber add‑ons is driving fast SME growth (>15% YoY) and solid retention (~90%). It needs more sales enablement and broker engagement, plus investment to scale underwriting capacity and digital quoting in 2024.
Health insurance add‑ons
Private health and wellness riders grew in 2024 roughly 25% faster than Tryg’s core non‑life market, driven by demand for preventive care and mental health services. Tryg’s strong brand and employer distribution enable bundled offers with reported take‑up approaching 30% in workplace schemes. Growth is brisk but needs continuous product refresh and provider networks; modest capex reallocations can compound into a durable income stream.
Digital claims experience
Tryg’s digital claims experience is a Star: 2024 digital adoption ~65% with high satisfaction and clear retention drivers; it lowers loss‑adjustment expense (LAE) materially but requires continuous tech spend and AI tuning as market digital usage rises and leaders widen their gap fast.
- Keep funding automation and straight‑through claims to lock in advantage
Direct and omnichannel distribution
Tryg leverages strong direct traffic plus brokers and partners to reach roughly 3 million customers, giving scale and rich claims and behavioral data that keep acquisition costs efficient but require ongoing investment in media, CX and analytics.
As the market shifts online, digital leaders consolidate share; Tryg should double down on precision marketing and streamlined onboarding flows to capture this migration.
- Scale: ~3 million customers
- Focus: precision marketing, onboarding
- Invest: media, CX, analytics
DK/NO P&C: DK ~30%, NO ~18%, +8%premiums
DK/NO Private P&C is a Star for Tryg (DK ~30% share, NO ~18%) with premium growth ~+8% Y/Y in 2024; SMEs grow >15% YoY with ~90% retention; private health riders grew ~25% faster than core. Digital claims adoption ~65% in 2024 lowers LAE but needs ongoing AI and automation spend; scale ~3.0m customers supports efficient acquisition.
| Metric | 2024 |
|---|---|
| DK market share | ~30% |
| NO market share | ~18% |
| Premium growth | +8% Y/Y |
| SME growth | >15% Y/Y |
| Retention | ~90% |
| Digital adoption | ~65% |
| Customers | ~3.0m |
What is included in the product
Detailed Word Document
Clear BCG Matrix analysis of Tryg’s units—Stars, Cash Cows, Question Marks, Dogs—with investment, divestment and trend insights.
Customizable Excel Spreadsheet
One-page Tryg BCG Matrix placing each business unit in a quadrant to cut analysis time and align exec decisions.
Cash Cows
Home & contents (mature Nordic)
Home & contents (mature Nordic) represents a large, sticky book for Tryg with renewal rates around 90% and strong pricing power; market growth was modest at roughly 2–3% in 2024. Tight underwriting sustains attractive margins with a combined ratio near 90%, needing limited promo spend beyond brand maintenance. The line is a reliable cash generator, funding automation and FNOL efficiency investments.
Motor insurance core book
Tryg’s motor insurance core book, with roughly DKK 11bn in annual premiums, leverages scale, rich telematics and claims datasets, and extensive repair-network agreements to keep loss ratios in check. Unit growth is modest, yet recurring premiums deliver reliable cash generation and contributed materially to Tryg’s 2024 operating profit. Telematics pockets show double-digit growth potential, while disciplined rating and tight claims leakage control maximize yield.
Established commercial property
Established commercial property sits in Tryg's cash‑cow quadrant with mature segments, solid broker relationships and predictable loss trends reported as stable through H1 2024. Low organic growth but high in‑force value means infrastructure and pricing tools in 2024 lift margin more than new business. Strategy is to harvest cash while fine‑tuning portfolio mix and selective re-pricing.
Bancassurance & affinity renewals
Bancassurance and affinity renewals at Tryg act as cash cows: partnership channels deliver recurring policy flows at low incremental cost, growth was flat in 2024 while churn remained low and marketing spend minimal, allowing the unit to fund broader innovation and product development; maintain tight SLAs and renegotiate commercial terms to sustain contribution.
- Low incremental cost
- Flat growth, low churn (2024)
- Minimal marketing spend
- Funds innovation
- Tighten SLAs, renegotiate terms
Accident & travel add‑ons (core, stable)
Accident and travel add‑ons show high penetration and, at group scale, claims volatility is manageable, delivering a dependable margin rather than significant growth; minimal sales effort beyond cross‑sell prompts sustains volumes while pricing analytics keep profitability steady.
- High penetration
- Manageable claims volatility
- Dependable margin, low growth
- Minimal cross‑sell effort
- Pricing analytics maintain profitability
Stable, high-margin cash engines: home renewals ~90%, motor DKK 11bn
Tryg’s cash‑cow lines (home & contents, motor, commercial property, bancassurance, accident/add‑ons) generated stable, high-margin cash flow in 2024: home renewals ~90% and combined ratio ~90%; motor premiums ~DKK 11bn with disciplined underwriting; commercial property stable H1 2024; bancassurance flat growth with low acquisition cost.
| Line | 2024 metric | Growth | Role |
|---|---|---|---|
| Home & contents | Renewal ~90% | 2–3% | Fund investments |
| Motor | Premiums DKK 11bn | Modest | Core cash |
| Commercial prop | Stable H1 2024 | Low | Harvest |
| Bancassurance | Low cost | Flat | Recurring cash |
Delivered as Shown
Tryg BCG Matrix
The file you're previewing is the exact BCG Matrix document you'll receive after purchase—no watermarks, no demo copy, just the finished, professionally formatted report. It's built for immediate use: editable, printable, and ready to drop straight into your strategy sessions or investor decks. Buy once and get the full file delivered instantly to your inbox. No surprises, no follow-ups—just clean, analysis-ready material you can trust.











