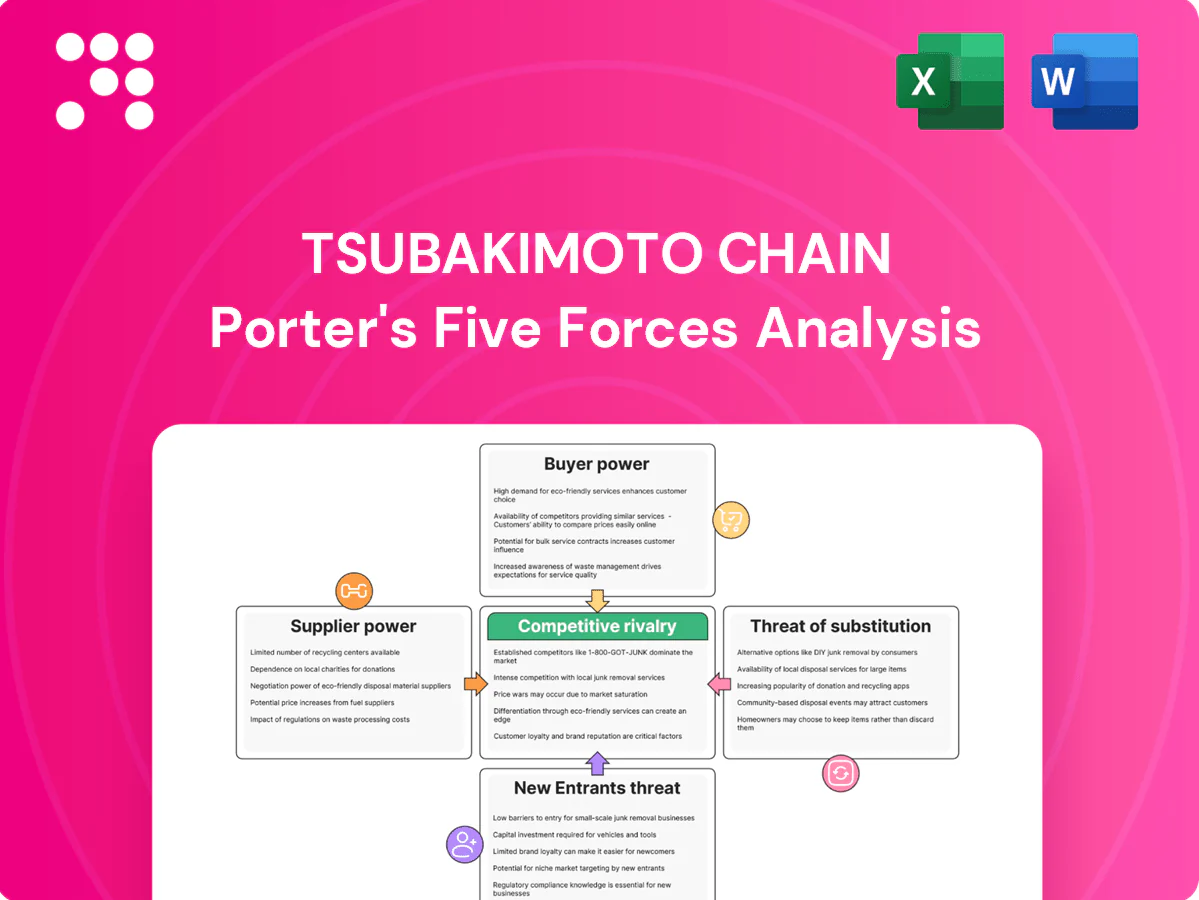
Tsubakimoto Chain Porter's Five Forces Analysis

Go Beyond the Preview—Access the Full Strategic Report
Tsubakimoto Chain faces varied competitive pressures from concentrated suppliers, specialized buyers, and moderate substitute threats; technological differentiation and scale offer defensive advantages. This snapshot highlights key dynamics but only scratches the surface. Unlock the full Porter's Five Forces Analysis for force-by-force ratings, visuals, and actionable strategy tailored to Tsubakimoto Chain.
Suppliers Bargaining Power

Steel and alloy input concentration
Supplier power hinges on access to high-grade steels and specialty alloys for chains and sprockets, and when only a handful of mills meet Tsubakimoto’s tight specifications leverage shifts to suppliers; long qualification cycles slow switching and increase supplier clout. Long-term contracts and dual-sourcing reduce exposure, but commodity price spikes still compress margins and can erode negotiated savings. Qualification timelines and technical approvals reinforce supplier bargaining strength.
Specialized components and heat treatment
Precision heat treatment, specialized coatings, bearings, motors and control systems for Tsubakimoto come from niche vendors, with custom lead times commonly 8–12 weeks in 2024 and ISO/TS quality requirements limiting interchangeable sources. Technical specificity and certification-driven sourcing elevate switching costs and supply-delay risk, while co-development agreements (often covering 3–5 year programs) reduce price pressure but increase supplier dependency.

Global logistics and energy costs
Freight, energy and geopolitical disruptions in 2024—with container rates roughly 60% below 2021 peaks per UNCTAD—still create volatile input availability and cost. Suppliers increasingly pass fuel and energy surcharges to buyers, tightening Tsubakimoto’s margins. Nearshoring and larger inventory buffers reduce exposure but can raise working capital by an estimated 5–10%. Contract surcharge clauses materially affect negotiating leverage.

Scale vs. supplier fragmentation
Tsubakimoto’s global scale enables aggregation of spend and vendor scorecards, leveraging centralized sourcing to extract savings; commoditized categories with high supplier fragmentation dilute supplier power, while niche engineered inputs (few qualified sources) elevate it, and active portfolioing across categories balances negotiating leverage; operating in 23 countries as of 2024 supports these dynamics.
- Scale: centralized spend aggregation, vendor scorecards
- Commodities: fragmented suppliers → lower power
- Niche inputs: limited qualified sources → higher power
- Portfolioing: balances power across spend base
Quality and compliance requirements
Automotive, food and steel customers require strict QA and end-to-end traceability—IATF 16949, HACCP/FSMA and ISO 9001 are common requisites—raising technical barriers and concentrating qualified suppliers. Supplier pools certified to these norms are smaller, increasing supplier leverage; supplier approvals and audits typically take 3–12 months, slowing alternate onboarding. Stringent SLAs with measurable KPIs and financial penalties can recover service levels and partially offset supplier power.
- IATF 16949, HACCP/FSMA, ISO 9001: mandatory for key customers
- Qualified supplier pool: materially smaller, raising leverage
- Approval/audit lag: commonly 3–12 months
- SLAs with KPIs and penalties can reduce supplier influence
Supplier power high for niche steels: 8–12 week lead times; 3–12 month approvals
Supplier power is elevated for high-grade steels, specialty alloys and niche heat-treat/coating vendors due to few qualified mills, 8–12 week lead times (2024) and 3–12 month approval cycles, increasing switching costs. Centralized sourcing across 23 countries and commodity fragmentation lower power; nearshoring and larger inventory (raising WC ~5–10%) partially mitigate risks.
| Metric | 2024 |
|---|---|
| Lead times (niche) | 8–12 weeks |
| Approval/audit | 3–12 months |
| Countries | 23 |
| WC impact (buffers) | +5–10% |
| Container rates vs 2021 | -60% |
What is included in the product
 Detailed Word Document
Tailored Five Forces analysis of Tsubakimoto Chain identifying competitive intensity, supplier and buyer power, threat of substitutes and new entrants, and highlighting disruptive forces and strategic levers backed by industry data to inform pricing, positioning, and defensive growth strategies.

 Customizable Excel Spreadsheet
A clear, one-sheet Porter's Five Forces summary for Tsubakimoto Chain—perfect for quick strategic decisions, highlighting supplier, buyer and competitive pressures to relieve analysis bottlenecks.
Customers Bargaining Power

Large OEMs and integrators
Automotive OEMs, steel plants and global system integrators place sizable recurring orders—OEM platform awards in 2024 commonly represent tens to hundreds of millions of dollars in lifetime revenue—granting them high bargaining power. Their scale, rigorous RFQs and global sourcing drive demands for price breaks, extended warranty terms and strict service-level commitments. Losing a platform can therefore cost suppliers a material portion of annual volume and margin.
Standardization and price transparency
Many chains, sprockets, and reducers adhere to ANSI and ISO standardized specifications, making cross-supplier comparisons straightforward. Comparable offerings and extensive online catalogues enable easy price benchmarking, intensifying discount pressure in both MRO and OEM channels. Resist pure price play by differentiating on wear life and total cost of ownership through warranty, testing data, and lifecycle service agreements.

Customization and engineering lock-in
Engineered conveyors and power-transmission solutions embed custom designs that create technical and contractual switching frictions during integration and commissioning. These frictions, given typical industrial equipment life cycles of 10–20 years, materially reduce buyer power post-installation. Buyers therefore push harder on upfront pricing, warranties and service terms to offset future lock-in.

Aftermarket vs. initial equipment
Aftermarket spares and maintenance are less price-sensitive because downtime risk shifts buyer focus to availability and reliability; a 2024 survey found 62% of industrial buyers prioritize lead time over unit price, letting suppliers capture a 10–20% aftermarket premium. This reduces buyer power for critical spares, while OEM nominations and framework agreements, often covering ~70% of initial equipment buys, keep initial prices tight.
- Aftermarket premium: 10–20%
- Buyers prioritizing lead time: 62% (2024)
- Framework coverage of initial purchases: ~70%
Service expectations and SLAs
Buyers demand rapid response, predictive maintenance, and uptime guarantees, shifting procurement toward vendors offering measurable SLA commitments and 24/7 support.
Strong service capabilities let Tsubakimoto defend pricing by converting SLAs into value-based contracts; studies show predictive maintenance can reduce downtime by up to 30% and extend asset life.
Weak service widens buyer leverage for concessions, whereas digital monitoring platforms (adopted by ~40% of manufacturers by 2024) move negotiations from price to uptime/value.
- Service SLAs: rapid response, 24/7 support, uptime guarantees
- Value levers: predictive maintenance ≈30% downtime reduction
- Market shift: ~40% manufacturer predictive adoption (2024)
OEM procurement and lead-time premiums push spares pricing toward uptime value
Automotive OEMs and steel plants exert high bargaining power via large platform awards (tens–hundreds of $M) and strict RFQs. Standardized chain specs enable price benchmarking, pressuring margins, while aftermarket spares capture a 10–20% premium as 62% of buyers (2024) prioritize lead time. Strong SLAs and predictive maintenance (≈40% adoption in 2024) shift negotiations to uptime/value.
| Metric | Value (2024) |
|---|---|
| Aftermarket premium | 10–20% |
| Buyers prioritizing lead time | 62% |
| Framework coverage of initial purchases | ≈70% |
| Predictive maintenance adoption | ≈40% |
Full Version Awaits
Tsubakimoto Chain Porter's Five Forces Analysis
This preview shows the exact Porter’s Five Forces analysis for Tsubakimoto Chain you’ll receive after purchase—no placeholders or samples. The file is fully formatted, professional, and download-ready immediately upon payment. Use it directly for strategic insight, valuation inputs, or competitive assessment.

Go Beyond the Preview—Access the Full Strategic Report
Tsubakimoto Chain faces varied competitive pressures from concentrated suppliers, specialized buyers, and moderate substitute threats; technological differentiation and scale offer defensive advantages. This snapshot highlights key dynamics but only scratches the surface. Unlock the full Porter's Five Forces Analysis for force-by-force ratings, visuals, and actionable strategy tailored to Tsubakimoto Chain.
Suppliers Bargaining Power
Steel and alloy input concentration
Supplier power hinges on access to high-grade steels and specialty alloys for chains and sprockets, and when only a handful of mills meet Tsubakimoto’s tight specifications leverage shifts to suppliers; long qualification cycles slow switching and increase supplier clout. Long-term contracts and dual-sourcing reduce exposure, but commodity price spikes still compress margins and can erode negotiated savings. Qualification timelines and technical approvals reinforce supplier bargaining strength.
Specialized components and heat treatment
Precision heat treatment, specialized coatings, bearings, motors and control systems for Tsubakimoto come from niche vendors, with custom lead times commonly 8–12 weeks in 2024 and ISO/TS quality requirements limiting interchangeable sources. Technical specificity and certification-driven sourcing elevate switching costs and supply-delay risk, while co-development agreements (often covering 3–5 year programs) reduce price pressure but increase supplier dependency.
Global logistics and energy costs
Freight, energy and geopolitical disruptions in 2024—with container rates roughly 60% below 2021 peaks per UNCTAD—still create volatile input availability and cost. Suppliers increasingly pass fuel and energy surcharges to buyers, tightening Tsubakimoto’s margins. Nearshoring and larger inventory buffers reduce exposure but can raise working capital by an estimated 5–10%. Contract surcharge clauses materially affect negotiating leverage.
Scale vs. supplier fragmentation
Tsubakimoto’s global scale enables aggregation of spend and vendor scorecards, leveraging centralized sourcing to extract savings; commoditized categories with high supplier fragmentation dilute supplier power, while niche engineered inputs (few qualified sources) elevate it, and active portfolioing across categories balances negotiating leverage; operating in 23 countries as of 2024 supports these dynamics.
- Scale: centralized spend aggregation, vendor scorecards
- Commodities: fragmented suppliers → lower power
- Niche inputs: limited qualified sources → higher power
- Portfolioing: balances power across spend base
Quality and compliance requirements
Automotive, food and steel customers require strict QA and end-to-end traceability—IATF 16949, HACCP/FSMA and ISO 9001 are common requisites—raising technical barriers and concentrating qualified suppliers. Supplier pools certified to these norms are smaller, increasing supplier leverage; supplier approvals and audits typically take 3–12 months, slowing alternate onboarding. Stringent SLAs with measurable KPIs and financial penalties can recover service levels and partially offset supplier power.
- IATF 16949, HACCP/FSMA, ISO 9001: mandatory for key customers
- Qualified supplier pool: materially smaller, raising leverage
- Approval/audit lag: commonly 3–12 months
- SLAs with KPIs and penalties can reduce supplier influence
Supplier power high for niche steels: 8–12 week lead times; 3–12 month approvals
Supplier power is elevated for high-grade steels, specialty alloys and niche heat-treat/coating vendors due to few qualified mills, 8–12 week lead times (2024) and 3–12 month approval cycles, increasing switching costs. Centralized sourcing across 23 countries and commodity fragmentation lower power; nearshoring and larger inventory (raising WC ~5–10%) partially mitigate risks.
| Metric | 2024 |
|---|---|
| Lead times (niche) | 8–12 weeks |
| Approval/audit | 3–12 months |
| Countries | 23 |
| WC impact (buffers) | +5–10% |
| Container rates vs 2021 | -60% |
What is included in the product
Detailed Word Document
Tailored Five Forces analysis of Tsubakimoto Chain identifying competitive intensity, supplier and buyer power, threat of substitutes and new entrants, and highlighting disruptive forces and strategic levers backed by industry data to inform pricing, positioning, and defensive growth strategies.
Customizable Excel Spreadsheet
A clear, one-sheet Porter's Five Forces summary for Tsubakimoto Chain—perfect for quick strategic decisions, highlighting supplier, buyer and competitive pressures to relieve analysis bottlenecks.
Customers Bargaining Power
Large OEMs and integrators
Automotive OEMs, steel plants and global system integrators place sizable recurring orders—OEM platform awards in 2024 commonly represent tens to hundreds of millions of dollars in lifetime revenue—granting them high bargaining power. Their scale, rigorous RFQs and global sourcing drive demands for price breaks, extended warranty terms and strict service-level commitments. Losing a platform can therefore cost suppliers a material portion of annual volume and margin.
Standardization and price transparency
Many chains, sprockets, and reducers adhere to ANSI and ISO standardized specifications, making cross-supplier comparisons straightforward. Comparable offerings and extensive online catalogues enable easy price benchmarking, intensifying discount pressure in both MRO and OEM channels. Resist pure price play by differentiating on wear life and total cost of ownership through warranty, testing data, and lifecycle service agreements.
Customization and engineering lock-in
Engineered conveyors and power-transmission solutions embed custom designs that create technical and contractual switching frictions during integration and commissioning. These frictions, given typical industrial equipment life cycles of 10–20 years, materially reduce buyer power post-installation. Buyers therefore push harder on upfront pricing, warranties and service terms to offset future lock-in.
Aftermarket vs. initial equipment
Aftermarket spares and maintenance are less price-sensitive because downtime risk shifts buyer focus to availability and reliability; a 2024 survey found 62% of industrial buyers prioritize lead time over unit price, letting suppliers capture a 10–20% aftermarket premium. This reduces buyer power for critical spares, while OEM nominations and framework agreements, often covering ~70% of initial equipment buys, keep initial prices tight.
- Aftermarket premium: 10–20%
- Buyers prioritizing lead time: 62% (2024)
- Framework coverage of initial purchases: ~70%
Service expectations and SLAs
Buyers demand rapid response, predictive maintenance, and uptime guarantees, shifting procurement toward vendors offering measurable SLA commitments and 24/7 support.
Strong service capabilities let Tsubakimoto defend pricing by converting SLAs into value-based contracts; studies show predictive maintenance can reduce downtime by up to 30% and extend asset life.
Weak service widens buyer leverage for concessions, whereas digital monitoring platforms (adopted by ~40% of manufacturers by 2024) move negotiations from price to uptime/value.
- Service SLAs: rapid response, 24/7 support, uptime guarantees
- Value levers: predictive maintenance ≈30% downtime reduction
- Market shift: ~40% manufacturer predictive adoption (2024)
OEM procurement and lead-time premiums push spares pricing toward uptime value
Automotive OEMs and steel plants exert high bargaining power via large platform awards (tens–hundreds of $M) and strict RFQs. Standardized chain specs enable price benchmarking, pressuring margins, while aftermarket spares capture a 10–20% premium as 62% of buyers (2024) prioritize lead time. Strong SLAs and predictive maintenance (≈40% adoption in 2024) shift negotiations to uptime/value.
| Metric | Value (2024) |
|---|---|
| Aftermarket premium | 10–20% |
| Buyers prioritizing lead time | 62% |
| Framework coverage of initial purchases | ≈70% |
| Predictive maintenance adoption | ≈40% |
Full Version Awaits
Tsubakimoto Chain Porter's Five Forces Analysis
This preview shows the exact Porter’s Five Forces analysis for Tsubakimoto Chain you’ll receive after purchase—no placeholders or samples. The file is fully formatted, professional, and download-ready immediately upon payment. Use it directly for strategic insight, valuation inputs, or competitive assessment.
Description
Go Beyond the Preview—Access the Full Strategic Report
Tsubakimoto Chain faces varied competitive pressures from concentrated suppliers, specialized buyers, and moderate substitute threats; technological differentiation and scale offer defensive advantages. This snapshot highlights key dynamics but only scratches the surface. Unlock the full Porter's Five Forces Analysis for force-by-force ratings, visuals, and actionable strategy tailored to Tsubakimoto Chain.
Suppliers Bargaining Power
Steel and alloy input concentration
Supplier power hinges on access to high-grade steels and specialty alloys for chains and sprockets, and when only a handful of mills meet Tsubakimoto’s tight specifications leverage shifts to suppliers; long qualification cycles slow switching and increase supplier clout. Long-term contracts and dual-sourcing reduce exposure, but commodity price spikes still compress margins and can erode negotiated savings. Qualification timelines and technical approvals reinforce supplier bargaining strength.
Specialized components and heat treatment
Precision heat treatment, specialized coatings, bearings, motors and control systems for Tsubakimoto come from niche vendors, with custom lead times commonly 8–12 weeks in 2024 and ISO/TS quality requirements limiting interchangeable sources. Technical specificity and certification-driven sourcing elevate switching costs and supply-delay risk, while co-development agreements (often covering 3–5 year programs) reduce price pressure but increase supplier dependency.
Global logistics and energy costs
Freight, energy and geopolitical disruptions in 2024—with container rates roughly 60% below 2021 peaks per UNCTAD—still create volatile input availability and cost. Suppliers increasingly pass fuel and energy surcharges to buyers, tightening Tsubakimoto’s margins. Nearshoring and larger inventory buffers reduce exposure but can raise working capital by an estimated 5–10%. Contract surcharge clauses materially affect negotiating leverage.
Scale vs. supplier fragmentation
Tsubakimoto’s global scale enables aggregation of spend and vendor scorecards, leveraging centralized sourcing to extract savings; commoditized categories with high supplier fragmentation dilute supplier power, while niche engineered inputs (few qualified sources) elevate it, and active portfolioing across categories balances negotiating leverage; operating in 23 countries as of 2024 supports these dynamics.
- Scale: centralized spend aggregation, vendor scorecards
- Commodities: fragmented suppliers → lower power
- Niche inputs: limited qualified sources → higher power
- Portfolioing: balances power across spend base
Quality and compliance requirements
Automotive, food and steel customers require strict QA and end-to-end traceability—IATF 16949, HACCP/FSMA and ISO 9001 are common requisites—raising technical barriers and concentrating qualified suppliers. Supplier pools certified to these norms are smaller, increasing supplier leverage; supplier approvals and audits typically take 3–12 months, slowing alternate onboarding. Stringent SLAs with measurable KPIs and financial penalties can recover service levels and partially offset supplier power.
- IATF 16949, HACCP/FSMA, ISO 9001: mandatory for key customers
- Qualified supplier pool: materially smaller, raising leverage
- Approval/audit lag: commonly 3–12 months
- SLAs with KPIs and penalties can reduce supplier influence
Supplier power high for niche steels: 8–12 week lead times; 3–12 month approvals
Supplier power is elevated for high-grade steels, specialty alloys and niche heat-treat/coating vendors due to few qualified mills, 8–12 week lead times (2024) and 3–12 month approval cycles, increasing switching costs. Centralized sourcing across 23 countries and commodity fragmentation lower power; nearshoring and larger inventory (raising WC ~5–10%) partially mitigate risks.
| Metric | 2024 |
|---|---|
| Lead times (niche) | 8–12 weeks |
| Approval/audit | 3–12 months |
| Countries | 23 |
| WC impact (buffers) | +5–10% |
| Container rates vs 2021 | -60% |
What is included in the product
Detailed Word Document
Tailored Five Forces analysis of Tsubakimoto Chain identifying competitive intensity, supplier and buyer power, threat of substitutes and new entrants, and highlighting disruptive forces and strategic levers backed by industry data to inform pricing, positioning, and defensive growth strategies.
Customizable Excel Spreadsheet
A clear, one-sheet Porter's Five Forces summary for Tsubakimoto Chain—perfect for quick strategic decisions, highlighting supplier, buyer and competitive pressures to relieve analysis bottlenecks.
Customers Bargaining Power
Large OEMs and integrators
Automotive OEMs, steel plants and global system integrators place sizable recurring orders—OEM platform awards in 2024 commonly represent tens to hundreds of millions of dollars in lifetime revenue—granting them high bargaining power. Their scale, rigorous RFQs and global sourcing drive demands for price breaks, extended warranty terms and strict service-level commitments. Losing a platform can therefore cost suppliers a material portion of annual volume and margin.
Standardization and price transparency
Many chains, sprockets, and reducers adhere to ANSI and ISO standardized specifications, making cross-supplier comparisons straightforward. Comparable offerings and extensive online catalogues enable easy price benchmarking, intensifying discount pressure in both MRO and OEM channels. Resist pure price play by differentiating on wear life and total cost of ownership through warranty, testing data, and lifecycle service agreements.
Customization and engineering lock-in
Engineered conveyors and power-transmission solutions embed custom designs that create technical and contractual switching frictions during integration and commissioning. These frictions, given typical industrial equipment life cycles of 10–20 years, materially reduce buyer power post-installation. Buyers therefore push harder on upfront pricing, warranties and service terms to offset future lock-in.
Aftermarket vs. initial equipment
Aftermarket spares and maintenance are less price-sensitive because downtime risk shifts buyer focus to availability and reliability; a 2024 survey found 62% of industrial buyers prioritize lead time over unit price, letting suppliers capture a 10–20% aftermarket premium. This reduces buyer power for critical spares, while OEM nominations and framework agreements, often covering ~70% of initial equipment buys, keep initial prices tight.
- Aftermarket premium: 10–20%
- Buyers prioritizing lead time: 62% (2024)
- Framework coverage of initial purchases: ~70%
Service expectations and SLAs
Buyers demand rapid response, predictive maintenance, and uptime guarantees, shifting procurement toward vendors offering measurable SLA commitments and 24/7 support.
Strong service capabilities let Tsubakimoto defend pricing by converting SLAs into value-based contracts; studies show predictive maintenance can reduce downtime by up to 30% and extend asset life.
Weak service widens buyer leverage for concessions, whereas digital monitoring platforms (adopted by ~40% of manufacturers by 2024) move negotiations from price to uptime/value.
- Service SLAs: rapid response, 24/7 support, uptime guarantees
- Value levers: predictive maintenance ≈30% downtime reduction
- Market shift: ~40% manufacturer predictive adoption (2024)
OEM procurement and lead-time premiums push spares pricing toward uptime value
Automotive OEMs and steel plants exert high bargaining power via large platform awards (tens–hundreds of $M) and strict RFQs. Standardized chain specs enable price benchmarking, pressuring margins, while aftermarket spares capture a 10–20% premium as 62% of buyers (2024) prioritize lead time. Strong SLAs and predictive maintenance (≈40% adoption in 2024) shift negotiations to uptime/value.
| Metric | Value (2024) |
|---|---|
| Aftermarket premium | 10–20% |
| Buyers prioritizing lead time | 62% |
| Framework coverage of initial purchases | ≈70% |
| Predictive maintenance adoption | ≈40% |
Full Version Awaits
Tsubakimoto Chain Porter's Five Forces Analysis
This preview shows the exact Porter’s Five Forces analysis for Tsubakimoto Chain you’ll receive after purchase—no placeholders or samples. The file is fully formatted, professional, and download-ready immediately upon payment. Use it directly for strategic insight, valuation inputs, or competitive assessment.











