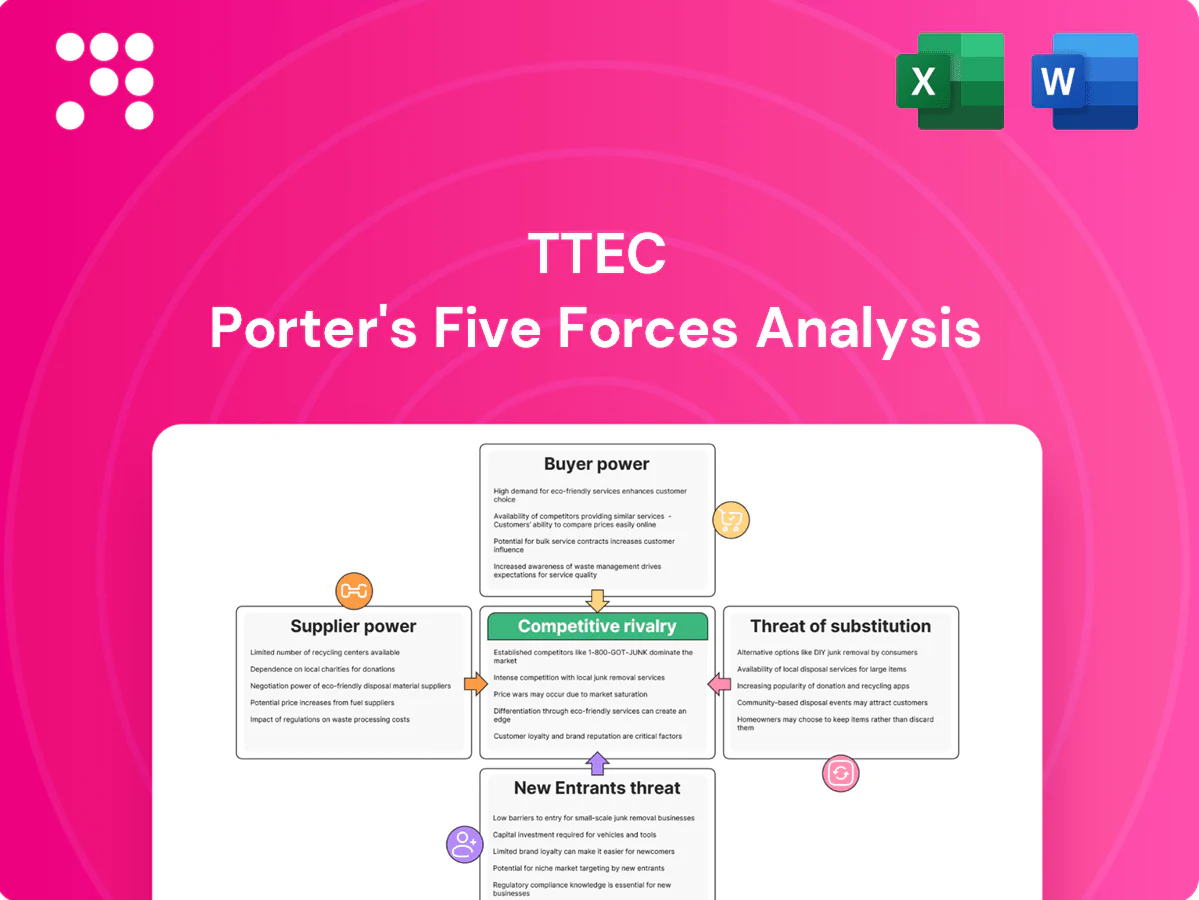
TTEC Porter's Five Forces Analysis

Go Beyond the Preview—Access the Full Strategic Report
TTEC operates in a competitive customer experience and digital services market where supplier leverage, buyer power, and tech-driven substitutes shape margins. Our brief Porter’s Five Forces snapshot highlights key tensions and strategic levers. This preview only scratches the surface. Unlock the full Porter's Five Forces Analysis to explore TTEC’s competitive dynamics, market pressures, and strategic advantages in detail.
Suppliers Bargaining Power

Concentrated cloud and CCaaS stack
Dependence on hyperscalers and CCaaS/CRM platforms concentrates supplier influence—AWS (≈32%), Microsoft Azure (≈23%) and Google Cloud (≈11%) in 2024 give major leverage to a few providers, while CCaaS leaders (Genesys, NICE, Salesforce) dominate feature stacks. Pricing changes, reserved-instance commitments or roadmap shifts can compress TTEC’s margins and slow feature velocity. Multi-cloud and platform diversification mitigate risk but add non-trivial integration cost; strategic partnerships and volume discounts partially offset supplier leverage.
Specialized talent scarcity
Skilled CX agents, data scientists, conversation designers and AI engineers remain scarce in key markets, driving contact-center attrition rates of roughly 30–45% that raise recruitment and delivery costs and disrupt service consistency.

Telecom and data dependencies
Carrier connectivity, omnichannel routing and data vendors are critical for TTEC’s uptime and service quality, with industry SLAs targeting 99.99% availability; breaches or sudden rate hikes can disrupt operations and compress margins. Redundancy and peering lower outage risk but raise fixed costs and complexity. Vendor consolidation — three national US carriers covering over 99% of mobile subscribers in 2024 — strengthens supplier bargaining power.

Software licensing and lock-in
Proprietary analytics, WEM and security tooling drive measurable switching frictions for TTEC clients, raising migration costs and timelines.
License metric shifts (seats, interactions, AI tokens) commonly lift per-unit costs and can increase vendor spend over baseline by months of budgeted run-rates.
Open architectures and APIs can dilute lock-in but require engineering investment and 12–36 month integration timelines; long-term enterprise agreements (12–36 months) trade flexibility for price stability.
- switching-friction: proprietary tools
- license-risk: metric changes
- integration-cost: 12-36 months
- capex-impact: engineering investment
- contract: multi-year price stability
Compliance and infrastructure requirements
PCI, HIPAA, ISO and SOC certifications and secure facilities/equipment rely on vetted suppliers; by 2024 these certifications became baseline requirements for enterprise CX providers. Audit demands give certified vendors leverage in renewals, while alternate certified suppliers exist but migrations commonly take 6–18 months. Shared responsibility models shift compliance risk but often leave customers covering significant implementation costs.
- Certifications: PCI, HIPAA, ISO, SOC
- Audit leverage: stronger at renewal
- Transition time: 6–18 months
- Shared responsibility: risk shifted, costs often retained
High supplier leverage and 30–45% attrition risk contact center margins
Supplier power is high: cloud providers (AWS 32%, Azure 23%, GCP 11% in 2024) and CCaaS leaders concentrate leverage, risking margin compression via price or metric shifts. Talent scarcity (30–45% contact-center attrition) raises labor costs. Certifications and carrier consolidation (three carriers >99% US mobile reach) increase switching time (6–18 months) and renewal leverage.
| Metric | 2024 |
|---|---|
| AWS | 32% |
| Azure | 23% |
| GCP | 11% |
| Attrition | 30–45% |
| Carrier reach | >99% |
What is included in the product
 Detailed Word Document
Uncovers competitive drivers, buyer/supplier power, threat of substitutes and new entrants, plus rivalry intensity and regulatory and technological disruptors affecting TTEC’s pricing, margins and market positioning; provides actionable insights for strategy, investor materials, and competitive defense.

 Customizable Excel Spreadsheet
A one-sheet summary of TTEC's five forces with customizable pressure levels and an instant spider chart—clean layout ready for decks, easy to duplicate for scenarios, no macros, and swappable data for seamless integration into reports.
Customers Bargaining Power

Enterprise clients with RFP leverage
Enterprise clients wield strong RFP leverage, with TTEC reporting fiscal 2024 revenue of about $2.15 billion and a significant portion tied to large, multi-year contracts that drive concentrated revenue and client negotiating strength. Multi-region, multi-year deals often embed outcomes-based SLAs that shift performance and financial risk onto TTEC, intensifying price pressure. Referenceability and co-innovation credits are routinely traded for price concessions in major RFPs.
Ability to insource or multisource
Customers can insource or multisource contact center work—reducing vendor price power—while hybrid models lower switching risk and expand options; TTEC operates in 80+ countries with roughly 70,000 employees (2024), enabling both onshore and offshore mixes. TTEC must differentiate through proprietary IP, analytics and fast speed-to-value to justify premiums. Robust transitions and governance practices cut churn and preserve contract value.

High but manageable switching costs
Process migration, knowledge transfer, and tech re-integration make switching from TTEC costly and risky, locking clients into multi-month transitions and higher implementation spend. Standardized cloud CX stacks have lowered barriers, with Gartner reporting over 70% enterprise CX cloud adoption by 2024. Strong KPIs and CSAT (often >80% in top-tier BPOs) curb buyer appetite, though sustained poor performance can trigger rapid rebids.

Price sensitivity in cyclical budgets
Demand for TTEC services swings with macro cycles, prompting seat rationalization and rate pressure as buyers renegotiate volumes and favor automation/deflection to cut costs; Gartner 2024 found about 70% of service leaders increasing AI spend and McKinsey estimates automation can lower contact-center costs up to 30%. Tiered pricing and AI-led productivity gains (20–30% agent uplift) plus flexible staffing models help defend margins and absorb volatility.
- Seat rationalization: renegotiated volumes
- Automation push: ~30% cost savings
- Tiered pricing: margin defense
- Flexible staffing: volatility absorption
Demand for measurable ROI
Clients tie fees to measurable ROI: typical expectations are 3–10% revenue lift, 10–20% AHT reduction, and 5–10 NPS/CSAT point gains; transparent analytics and pilot programs are required to win and retain deals. Value-based pricing raises scrutiny but can expand wallet share when attribution is clear; robust attribution frameworks increase client stickiness.
- ROI targets: 3–10% revenue lift
- AHT: 10–20% reduction
- NPS/CSAT: +5–10 points
- Prereqs: analytics + pilots
- Pricing: value-based = higher scrutiny, more wallet share
RFP leverage drives outcomes SLAs; cloud CX ~70%, AI uplift 20-30%
Enterprise clients hold strong RFP leverage vs TTEC (fiscal 2024 revenue ~$2.15B), driving outcomes-based SLAs and price pressure. Multi-region delivery (80+ countries, ~70,000 employees in 2024) and switching costs retain clients, while cloud CX adoption (~70% enterprises, 2024) plus automation (AI spend ↑; ~20–30% agent uplift) compress pricing power. Value-based fees demand clear ROI (typical targets: 3–10% rev lift).
| Metric | 2024 Value |
|---|---|
| Revenue | $2.15B |
| Employees | ~70,000 |
| Countries | 80+ |
| CX cloud adoption | ~70% |
| Agent uplift (AI) | 20–30% |
Full Version Awaits
TTEC Porter's Five Forces Analysis
This preview shows the exact TTEC Porter's Five Forces Analysis you'll receive immediately after purchase—no placeholders or sample pages. The full, professionally formatted document is ready for download and use the moment you buy. You're viewing the final deliverable, complete and actionable.

Go Beyond the Preview—Access the Full Strategic Report
TTEC operates in a competitive customer experience and digital services market where supplier leverage, buyer power, and tech-driven substitutes shape margins. Our brief Porter’s Five Forces snapshot highlights key tensions and strategic levers. This preview only scratches the surface. Unlock the full Porter's Five Forces Analysis to explore TTEC’s competitive dynamics, market pressures, and strategic advantages in detail.
Suppliers Bargaining Power
Concentrated cloud and CCaaS stack
Dependence on hyperscalers and CCaaS/CRM platforms concentrates supplier influence—AWS (≈32%), Microsoft Azure (≈23%) and Google Cloud (≈11%) in 2024 give major leverage to a few providers, while CCaaS leaders (Genesys, NICE, Salesforce) dominate feature stacks. Pricing changes, reserved-instance commitments or roadmap shifts can compress TTEC’s margins and slow feature velocity. Multi-cloud and platform diversification mitigate risk but add non-trivial integration cost; strategic partnerships and volume discounts partially offset supplier leverage.
Specialized talent scarcity
Skilled CX agents, data scientists, conversation designers and AI engineers remain scarce in key markets, driving contact-center attrition rates of roughly 30–45% that raise recruitment and delivery costs and disrupt service consistency.
Telecom and data dependencies
Carrier connectivity, omnichannel routing and data vendors are critical for TTEC’s uptime and service quality, with industry SLAs targeting 99.99% availability; breaches or sudden rate hikes can disrupt operations and compress margins. Redundancy and peering lower outage risk but raise fixed costs and complexity. Vendor consolidation — three national US carriers covering over 99% of mobile subscribers in 2024 — strengthens supplier bargaining power.
Software licensing and lock-in
Proprietary analytics, WEM and security tooling drive measurable switching frictions for TTEC clients, raising migration costs and timelines.
License metric shifts (seats, interactions, AI tokens) commonly lift per-unit costs and can increase vendor spend over baseline by months of budgeted run-rates.
Open architectures and APIs can dilute lock-in but require engineering investment and 12–36 month integration timelines; long-term enterprise agreements (12–36 months) trade flexibility for price stability.
- switching-friction: proprietary tools
- license-risk: metric changes
- integration-cost: 12-36 months
- capex-impact: engineering investment
- contract: multi-year price stability
Compliance and infrastructure requirements
PCI, HIPAA, ISO and SOC certifications and secure facilities/equipment rely on vetted suppliers; by 2024 these certifications became baseline requirements for enterprise CX providers. Audit demands give certified vendors leverage in renewals, while alternate certified suppliers exist but migrations commonly take 6–18 months. Shared responsibility models shift compliance risk but often leave customers covering significant implementation costs.
- Certifications: PCI, HIPAA, ISO, SOC
- Audit leverage: stronger at renewal
- Transition time: 6–18 months
- Shared responsibility: risk shifted, costs often retained
High supplier leverage and 30–45% attrition risk contact center margins
Supplier power is high: cloud providers (AWS 32%, Azure 23%, GCP 11% in 2024) and CCaaS leaders concentrate leverage, risking margin compression via price or metric shifts. Talent scarcity (30–45% contact-center attrition) raises labor costs. Certifications and carrier consolidation (three carriers >99% US mobile reach) increase switching time (6–18 months) and renewal leverage.
| Metric | 2024 |
|---|---|
| AWS | 32% |
| Azure | 23% |
| GCP | 11% |
| Attrition | 30–45% |
| Carrier reach | >99% |
What is included in the product
Detailed Word Document
Uncovers competitive drivers, buyer/supplier power, threat of substitutes and new entrants, plus rivalry intensity and regulatory and technological disruptors affecting TTEC’s pricing, margins and market positioning; provides actionable insights for strategy, investor materials, and competitive defense.
Customizable Excel Spreadsheet
A one-sheet summary of TTEC's five forces with customizable pressure levels and an instant spider chart—clean layout ready for decks, easy to duplicate for scenarios, no macros, and swappable data for seamless integration into reports.
Customers Bargaining Power
Enterprise clients with RFP leverage
Enterprise clients wield strong RFP leverage, with TTEC reporting fiscal 2024 revenue of about $2.15 billion and a significant portion tied to large, multi-year contracts that drive concentrated revenue and client negotiating strength. Multi-region, multi-year deals often embed outcomes-based SLAs that shift performance and financial risk onto TTEC, intensifying price pressure. Referenceability and co-innovation credits are routinely traded for price concessions in major RFPs.
Ability to insource or multisource
Customers can insource or multisource contact center work—reducing vendor price power—while hybrid models lower switching risk and expand options; TTEC operates in 80+ countries with roughly 70,000 employees (2024), enabling both onshore and offshore mixes. TTEC must differentiate through proprietary IP, analytics and fast speed-to-value to justify premiums. Robust transitions and governance practices cut churn and preserve contract value.
High but manageable switching costs
Process migration, knowledge transfer, and tech re-integration make switching from TTEC costly and risky, locking clients into multi-month transitions and higher implementation spend. Standardized cloud CX stacks have lowered barriers, with Gartner reporting over 70% enterprise CX cloud adoption by 2024. Strong KPIs and CSAT (often >80% in top-tier BPOs) curb buyer appetite, though sustained poor performance can trigger rapid rebids.
Price sensitivity in cyclical budgets
Demand for TTEC services swings with macro cycles, prompting seat rationalization and rate pressure as buyers renegotiate volumes and favor automation/deflection to cut costs; Gartner 2024 found about 70% of service leaders increasing AI spend and McKinsey estimates automation can lower contact-center costs up to 30%. Tiered pricing and AI-led productivity gains (20–30% agent uplift) plus flexible staffing models help defend margins and absorb volatility.
- Seat rationalization: renegotiated volumes
- Automation push: ~30% cost savings
- Tiered pricing: margin defense
- Flexible staffing: volatility absorption
Demand for measurable ROI
Clients tie fees to measurable ROI: typical expectations are 3–10% revenue lift, 10–20% AHT reduction, and 5–10 NPS/CSAT point gains; transparent analytics and pilot programs are required to win and retain deals. Value-based pricing raises scrutiny but can expand wallet share when attribution is clear; robust attribution frameworks increase client stickiness.
- ROI targets: 3–10% revenue lift
- AHT: 10–20% reduction
- NPS/CSAT: +5–10 points
- Prereqs: analytics + pilots
- Pricing: value-based = higher scrutiny, more wallet share
RFP leverage drives outcomes SLAs; cloud CX ~70%, AI uplift 20-30%
Enterprise clients hold strong RFP leverage vs TTEC (fiscal 2024 revenue ~$2.15B), driving outcomes-based SLAs and price pressure. Multi-region delivery (80+ countries, ~70,000 employees in 2024) and switching costs retain clients, while cloud CX adoption (~70% enterprises, 2024) plus automation (AI spend ↑; ~20–30% agent uplift) compress pricing power. Value-based fees demand clear ROI (typical targets: 3–10% rev lift).
| Metric | 2024 Value |
|---|---|
| Revenue | $2.15B |
| Employees | ~70,000 |
| Countries | 80+ |
| CX cloud adoption | ~70% |
| Agent uplift (AI) | 20–30% |
Full Version Awaits
TTEC Porter's Five Forces Analysis
This preview shows the exact TTEC Porter's Five Forces Analysis you'll receive immediately after purchase—no placeholders or sample pages. The full, professionally formatted document is ready for download and use the moment you buy. You're viewing the final deliverable, complete and actionable.
Description
Go Beyond the Preview—Access the Full Strategic Report
TTEC operates in a competitive customer experience and digital services market where supplier leverage, buyer power, and tech-driven substitutes shape margins. Our brief Porter’s Five Forces snapshot highlights key tensions and strategic levers. This preview only scratches the surface. Unlock the full Porter's Five Forces Analysis to explore TTEC’s competitive dynamics, market pressures, and strategic advantages in detail.
Suppliers Bargaining Power
Concentrated cloud and CCaaS stack
Dependence on hyperscalers and CCaaS/CRM platforms concentrates supplier influence—AWS (≈32%), Microsoft Azure (≈23%) and Google Cloud (≈11%) in 2024 give major leverage to a few providers, while CCaaS leaders (Genesys, NICE, Salesforce) dominate feature stacks. Pricing changes, reserved-instance commitments or roadmap shifts can compress TTEC’s margins and slow feature velocity. Multi-cloud and platform diversification mitigate risk but add non-trivial integration cost; strategic partnerships and volume discounts partially offset supplier leverage.
Specialized talent scarcity
Skilled CX agents, data scientists, conversation designers and AI engineers remain scarce in key markets, driving contact-center attrition rates of roughly 30–45% that raise recruitment and delivery costs and disrupt service consistency.
Telecom and data dependencies
Carrier connectivity, omnichannel routing and data vendors are critical for TTEC’s uptime and service quality, with industry SLAs targeting 99.99% availability; breaches or sudden rate hikes can disrupt operations and compress margins. Redundancy and peering lower outage risk but raise fixed costs and complexity. Vendor consolidation — three national US carriers covering over 99% of mobile subscribers in 2024 — strengthens supplier bargaining power.
Software licensing and lock-in
Proprietary analytics, WEM and security tooling drive measurable switching frictions for TTEC clients, raising migration costs and timelines.
License metric shifts (seats, interactions, AI tokens) commonly lift per-unit costs and can increase vendor spend over baseline by months of budgeted run-rates.
Open architectures and APIs can dilute lock-in but require engineering investment and 12–36 month integration timelines; long-term enterprise agreements (12–36 months) trade flexibility for price stability.
- switching-friction: proprietary tools
- license-risk: metric changes
- integration-cost: 12-36 months
- capex-impact: engineering investment
- contract: multi-year price stability
Compliance and infrastructure requirements
PCI, HIPAA, ISO and SOC certifications and secure facilities/equipment rely on vetted suppliers; by 2024 these certifications became baseline requirements for enterprise CX providers. Audit demands give certified vendors leverage in renewals, while alternate certified suppliers exist but migrations commonly take 6–18 months. Shared responsibility models shift compliance risk but often leave customers covering significant implementation costs.
- Certifications: PCI, HIPAA, ISO, SOC
- Audit leverage: stronger at renewal
- Transition time: 6–18 months
- Shared responsibility: risk shifted, costs often retained
High supplier leverage and 30–45% attrition risk contact center margins
Supplier power is high: cloud providers (AWS 32%, Azure 23%, GCP 11% in 2024) and CCaaS leaders concentrate leverage, risking margin compression via price or metric shifts. Talent scarcity (30–45% contact-center attrition) raises labor costs. Certifications and carrier consolidation (three carriers >99% US mobile reach) increase switching time (6–18 months) and renewal leverage.
| Metric | 2024 |
|---|---|
| AWS | 32% |
| Azure | 23% |
| GCP | 11% |
| Attrition | 30–45% |
| Carrier reach | >99% |
What is included in the product
Detailed Word Document
Uncovers competitive drivers, buyer/supplier power, threat of substitutes and new entrants, plus rivalry intensity and regulatory and technological disruptors affecting TTEC’s pricing, margins and market positioning; provides actionable insights for strategy, investor materials, and competitive defense.
Customizable Excel Spreadsheet
A one-sheet summary of TTEC's five forces with customizable pressure levels and an instant spider chart—clean layout ready for decks, easy to duplicate for scenarios, no macros, and swappable data for seamless integration into reports.
Customers Bargaining Power
Enterprise clients with RFP leverage
Enterprise clients wield strong RFP leverage, with TTEC reporting fiscal 2024 revenue of about $2.15 billion and a significant portion tied to large, multi-year contracts that drive concentrated revenue and client negotiating strength. Multi-region, multi-year deals often embed outcomes-based SLAs that shift performance and financial risk onto TTEC, intensifying price pressure. Referenceability and co-innovation credits are routinely traded for price concessions in major RFPs.
Ability to insource or multisource
Customers can insource or multisource contact center work—reducing vendor price power—while hybrid models lower switching risk and expand options; TTEC operates in 80+ countries with roughly 70,000 employees (2024), enabling both onshore and offshore mixes. TTEC must differentiate through proprietary IP, analytics and fast speed-to-value to justify premiums. Robust transitions and governance practices cut churn and preserve contract value.
High but manageable switching costs
Process migration, knowledge transfer, and tech re-integration make switching from TTEC costly and risky, locking clients into multi-month transitions and higher implementation spend. Standardized cloud CX stacks have lowered barriers, with Gartner reporting over 70% enterprise CX cloud adoption by 2024. Strong KPIs and CSAT (often >80% in top-tier BPOs) curb buyer appetite, though sustained poor performance can trigger rapid rebids.
Price sensitivity in cyclical budgets
Demand for TTEC services swings with macro cycles, prompting seat rationalization and rate pressure as buyers renegotiate volumes and favor automation/deflection to cut costs; Gartner 2024 found about 70% of service leaders increasing AI spend and McKinsey estimates automation can lower contact-center costs up to 30%. Tiered pricing and AI-led productivity gains (20–30% agent uplift) plus flexible staffing models help defend margins and absorb volatility.
- Seat rationalization: renegotiated volumes
- Automation push: ~30% cost savings
- Tiered pricing: margin defense
- Flexible staffing: volatility absorption
Demand for measurable ROI
Clients tie fees to measurable ROI: typical expectations are 3–10% revenue lift, 10–20% AHT reduction, and 5–10 NPS/CSAT point gains; transparent analytics and pilot programs are required to win and retain deals. Value-based pricing raises scrutiny but can expand wallet share when attribution is clear; robust attribution frameworks increase client stickiness.
- ROI targets: 3–10% revenue lift
- AHT: 10–20% reduction
- NPS/CSAT: +5–10 points
- Prereqs: analytics + pilots
- Pricing: value-based = higher scrutiny, more wallet share
RFP leverage drives outcomes SLAs; cloud CX ~70%, AI uplift 20-30%
Enterprise clients hold strong RFP leverage vs TTEC (fiscal 2024 revenue ~$2.15B), driving outcomes-based SLAs and price pressure. Multi-region delivery (80+ countries, ~70,000 employees in 2024) and switching costs retain clients, while cloud CX adoption (~70% enterprises, 2024) plus automation (AI spend ↑; ~20–30% agent uplift) compress pricing power. Value-based fees demand clear ROI (typical targets: 3–10% rev lift).
| Metric | 2024 Value |
|---|---|
| Revenue | $2.15B |
| Employees | ~70,000 |
| Countries | 80+ |
| CX cloud adoption | ~70% |
| Agent uplift (AI) | 20–30% |
Full Version Awaits
TTEC Porter's Five Forces Analysis
This preview shows the exact TTEC Porter's Five Forces Analysis you'll receive immediately after purchase—no placeholders or sample pages. The full, professionally formatted document is ready for download and use the moment you buy. You're viewing the final deliverable, complete and actionable.











