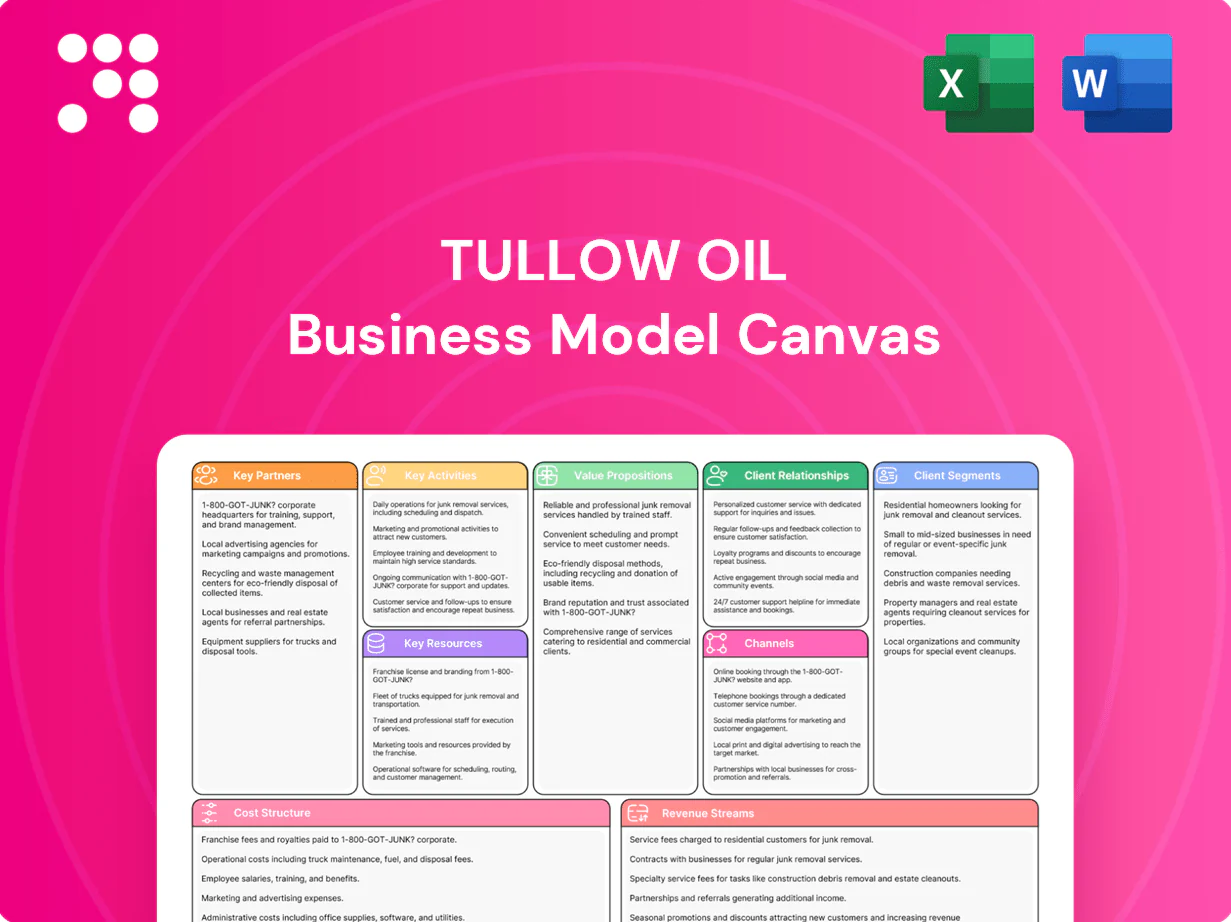
Tullow Oil Business Model Canvas

Business Model Canvas for an upstream oil producer — concise, investor-focused playbook
Unlock the strategic blueprint of Tullow Oil with a concise Business Model Canvas that maps its upstream focus, asset-led value proposition, key JV partnerships, cost structure and commodity risk strategy. Perfect for investors and strategists seeking actionable insights. Purchase the full Word/Excel Canvas for a detailed, section-by-section playbook.
Partnerships

Host governments and NOCs
Production sharing contracts and licenses for Tullow hinge on strong ties with ministries and national oil companies, with PSCs typically spanning 20–30 years to secure acreage and fiscal terms. These relationships lock in royalties, cost recovery and profit oil splits and facilitate timely approvals, local content compliance and community engagement. Stability with host governments underpins long-cycle investments with payback horizons often of 10–30 years.
Joint venture and farm-in partners
Sharing capital and subsurface risk via joint ventures is central to Tullow Oil, with JV partners bringing complementary assets, technical expertise and balance‑sheet strength that reduced net group capex exposure in 2024; Tullow set a 2024 exploration and appraisal budget of about $125m. Farm‑ins monetize acreage while advancing firm work programmes and de‑risking prospects. Robust governance frameworks align work plans, budgets and phased investments across partners.

Oilfield services and EPC contractors
Drilling, completions, seismic and construction rely on specialized vendors to deliver complex upstream activities and keep wells online. Competitive contracting with oilfield services and EPCs lowers lifting costs and boosts uptime through benchmarking and scope optimization. Performance-based contracts align safety, schedule and cost outcomes, while partnerships provide access to new technologies and local supply chains in Tullow’s West African and East African jurisdictions.

Offtakers, traders, and midstream operators
In 2024 Tullow's crude evacuation depends on pipeline, FPSO and terminal operators; reliable capacity is critical to realize produced volumes. Traders provide marketing, scheduling and price-risk solutions. Long-term offtake agreements underpin project financing and cash-flow visibility. Coordinated logistics reduces demurrage and quality differentials.
- offtake
- traders
- midstream
- logistics
Financial institutions and insurers
Project finance, reserve-based loans and hedging lines stabilize cash flows across cycles, enabling predictable debt servicing and funding of development capex and selective M&A while preserving upside. Banks and private funds provide development capital and acquisition bridges; insurers and export credit agencies underwrite operational and political risks. Robust covenants and hedges limit downside exposure without capping project upside.
- Project finance: predictable cashflows
- RBLs: reserve-backed liquidity
- Hedges: price volatility cover
- Banks/funds: capex & M&A funding
- Insurers/ECAs: political/operational risk mitigation
NOC PSCs secure 20–30yr acreage and 10–30yr paybacks
Production sharing contracts and national oil company ties secure 20–30 year acreage and fiscal terms, supporting 10–30 year investment paybacks.
JVs and farm‑ins share subsurface and capital risk; Tullow set a 2024 exploration and appraisal budget of about $125m.
Service contractors, midstream operators and lenders provide execution, evacuation and financing capacity, with insurers/ECAs mitigating political risk.
| Item | 2024 figure |
|---|---|
| Exploration budget | $125m |
| PSC length | 20–30 yrs |
What is included in the product
 Detailed Word Document
A concise Business Model Canvas for Tullow Oil mapping the 9 BMC blocks to its upstream exploration, production and asset optimization strategy, highlighting value propositions to host governments and partners, channels, cost/revenue drivers, competitive advantages, and key risks and opportunities for investors and operators.

 Customizable Excel Spreadsheet
High-level view of Tullow Oil’s business model with editable cells to quickly identify upstream value drivers, exploration risks, and cost structures. Perfect for boardrooms or teams to condense strategy into a digestible, shareable one-page snapshot for fast decision-making.
Activities

Exploration and appraisal drilling
Identify prospects through integrated geoscience and seismic interpretation across Tullow Oil’s West African portfolios, prioritizing leads with clear structural and stratigraphic traps. Execute appraisal and exploration wells to test plays and delineate discoveries, then optimize well placement to de-risk volume and flow-rate uncertainty. Integrate drilling, petrophysical and flow-test results to mature contingent resources into booked reserves for development planning.
Field development planning and execution
Engineer cost‑effective concepts for subsea, FPSO or onshore solutions using 2024 industry benchmarks: FPSO capex $700–1,500m, subsea tiebacks $50–500m and onshore facilities $100–600m. Sanction projects with clear cost, schedule and production targets (typical first‑oil 24–36 months) and gate‑based approvals tied to ROI and break‑even thresholds. Manage EPC, procurement and installation to first oil while embedding resilience via phased expansions and debottlenecking.

Production operations and maintenance
Operate assets with safety-first protocols targeting uptime above 95% and low unit costs through lean scheduling and cost control. Perform preventive maintenance and integrity management to reduce failure rates, aiming for 10-20% fewer unplanned shutdowns. Apply digital surveillance and AI analytics to optimize wells and facilities, improving recovery and efficiency. Manage water, gas and chemicals to sustain reservoir performance and limit decline rates.

Crude marketing and price risk management
Crude marketing and price risk management: Tullow blends, schedules and delivers to contracted offtakers, optimizing quality and timing to capture differentials; in 2024 Brent averaged about 86 USD/bbl, so timing and quality premiums materially affected realized prices. The company uses hedges to protect cash flow and covenant compliance and aligns sales with shipping and storage to reduce demurrage and spot premium exposure.
- Blend and delivery optimization
- Timing captures quality differentials
- Hedges protect cash flow and covenants
- Sales aligned with shipping & storage to cut costs
Stakeholder, ESG, and compliance management
Engage communities and regulators to maintain license to operate, delivering local content, safety and environmental standards while monitoring emissions, spills and biodiversity impacts; transparent reporting to investors and host nations aligns with global disclosure moves such as IFRS S1/S2 issued 2023 and increasingly adopted in 2024.
- Align disclosures with IFRS S1/S2 (issued 2023)
- Track Scope 1/2 emissions, spills, biodiversity KPIs
- Deliver local content, safety LTIs and community engagement targets
West Africa: sanction fields for 24–36 months first oil; FPSO capex $700–1,500m
Identify/appraise West Africa prospects to convert contingent resources to reserves; sanction projects with 24–36 month first oil. Design FPSO/subsea/onshore concepts (2024 FPSO capex $700–1,500m). Operate >95% uptime, cut unplanned shutdowns 10–20% via AI. Market crude and hedge to protect cashflow (Brent 2024 avg $86/bbl).
| Metric | 2024 |
|---|---|
| Brent | $86/bbl |
| FPSO capex | $700–1,500m |
Preview Before You Purchase
Business Model Canvas
The Tullow Oil Business Model Canvas shown here is the actual deliverable, not a mockup. It contains the same structured content and strategic insights you’ll receive after purchase. Upon ordering you’ll download this exact, fully editable document in Word and Excel formats.

Business Model Canvas for an upstream oil producer — concise, investor-focused playbook
Unlock the strategic blueprint of Tullow Oil with a concise Business Model Canvas that maps its upstream focus, asset-led value proposition, key JV partnerships, cost structure and commodity risk strategy. Perfect for investors and strategists seeking actionable insights. Purchase the full Word/Excel Canvas for a detailed, section-by-section playbook.
Partnerships
Host governments and NOCs
Production sharing contracts and licenses for Tullow hinge on strong ties with ministries and national oil companies, with PSCs typically spanning 20–30 years to secure acreage and fiscal terms. These relationships lock in royalties, cost recovery and profit oil splits and facilitate timely approvals, local content compliance and community engagement. Stability with host governments underpins long-cycle investments with payback horizons often of 10–30 years.
Joint venture and farm-in partners
Sharing capital and subsurface risk via joint ventures is central to Tullow Oil, with JV partners bringing complementary assets, technical expertise and balance‑sheet strength that reduced net group capex exposure in 2024; Tullow set a 2024 exploration and appraisal budget of about $125m. Farm‑ins monetize acreage while advancing firm work programmes and de‑risking prospects. Robust governance frameworks align work plans, budgets and phased investments across partners.
Oilfield services and EPC contractors
Drilling, completions, seismic and construction rely on specialized vendors to deliver complex upstream activities and keep wells online. Competitive contracting with oilfield services and EPCs lowers lifting costs and boosts uptime through benchmarking and scope optimization. Performance-based contracts align safety, schedule and cost outcomes, while partnerships provide access to new technologies and local supply chains in Tullow’s West African and East African jurisdictions.
Offtakers, traders, and midstream operators
In 2024 Tullow's crude evacuation depends on pipeline, FPSO and terminal operators; reliable capacity is critical to realize produced volumes. Traders provide marketing, scheduling and price-risk solutions. Long-term offtake agreements underpin project financing and cash-flow visibility. Coordinated logistics reduces demurrage and quality differentials.
- offtake
- traders
- midstream
- logistics
Financial institutions and insurers
Project finance, reserve-based loans and hedging lines stabilize cash flows across cycles, enabling predictable debt servicing and funding of development capex and selective M&A while preserving upside. Banks and private funds provide development capital and acquisition bridges; insurers and export credit agencies underwrite operational and political risks. Robust covenants and hedges limit downside exposure without capping project upside.
- Project finance: predictable cashflows
- RBLs: reserve-backed liquidity
- Hedges: price volatility cover
- Banks/funds: capex & M&A funding
- Insurers/ECAs: political/operational risk mitigation
NOC PSCs secure 20–30yr acreage and 10–30yr paybacks
Production sharing contracts and national oil company ties secure 20–30 year acreage and fiscal terms, supporting 10–30 year investment paybacks.
JVs and farm‑ins share subsurface and capital risk; Tullow set a 2024 exploration and appraisal budget of about $125m.
Service contractors, midstream operators and lenders provide execution, evacuation and financing capacity, with insurers/ECAs mitigating political risk.
| Item | 2024 figure |
|---|---|
| Exploration budget | $125m |
| PSC length | 20–30 yrs |
What is included in the product
Detailed Word Document
A concise Business Model Canvas for Tullow Oil mapping the 9 BMC blocks to its upstream exploration, production and asset optimization strategy, highlighting value propositions to host governments and partners, channels, cost/revenue drivers, competitive advantages, and key risks and opportunities for investors and operators.
Customizable Excel Spreadsheet
High-level view of Tullow Oil’s business model with editable cells to quickly identify upstream value drivers, exploration risks, and cost structures. Perfect for boardrooms or teams to condense strategy into a digestible, shareable one-page snapshot for fast decision-making.
Activities
Exploration and appraisal drilling
Identify prospects through integrated geoscience and seismic interpretation across Tullow Oil’s West African portfolios, prioritizing leads with clear structural and stratigraphic traps. Execute appraisal and exploration wells to test plays and delineate discoveries, then optimize well placement to de-risk volume and flow-rate uncertainty. Integrate drilling, petrophysical and flow-test results to mature contingent resources into booked reserves for development planning.
Field development planning and execution
Engineer cost‑effective concepts for subsea, FPSO or onshore solutions using 2024 industry benchmarks: FPSO capex $700–1,500m, subsea tiebacks $50–500m and onshore facilities $100–600m. Sanction projects with clear cost, schedule and production targets (typical first‑oil 24–36 months) and gate‑based approvals tied to ROI and break‑even thresholds. Manage EPC, procurement and installation to first oil while embedding resilience via phased expansions and debottlenecking.
Production operations and maintenance
Operate assets with safety-first protocols targeting uptime above 95% and low unit costs through lean scheduling and cost control. Perform preventive maintenance and integrity management to reduce failure rates, aiming for 10-20% fewer unplanned shutdowns. Apply digital surveillance and AI analytics to optimize wells and facilities, improving recovery and efficiency. Manage water, gas and chemicals to sustain reservoir performance and limit decline rates.
Crude marketing and price risk management
Crude marketing and price risk management: Tullow blends, schedules and delivers to contracted offtakers, optimizing quality and timing to capture differentials; in 2024 Brent averaged about 86 USD/bbl, so timing and quality premiums materially affected realized prices. The company uses hedges to protect cash flow and covenant compliance and aligns sales with shipping and storage to reduce demurrage and spot premium exposure.
- Blend and delivery optimization
- Timing captures quality differentials
- Hedges protect cash flow and covenants
- Sales aligned with shipping & storage to cut costs
Stakeholder, ESG, and compliance management
Engage communities and regulators to maintain license to operate, delivering local content, safety and environmental standards while monitoring emissions, spills and biodiversity impacts; transparent reporting to investors and host nations aligns with global disclosure moves such as IFRS S1/S2 issued 2023 and increasingly adopted in 2024.
- Align disclosures with IFRS S1/S2 (issued 2023)
- Track Scope 1/2 emissions, spills, biodiversity KPIs
- Deliver local content, safety LTIs and community engagement targets
West Africa: sanction fields for 24–36 months first oil; FPSO capex $700–1,500m
Identify/appraise West Africa prospects to convert contingent resources to reserves; sanction projects with 24–36 month first oil. Design FPSO/subsea/onshore concepts (2024 FPSO capex $700–1,500m). Operate >95% uptime, cut unplanned shutdowns 10–20% via AI. Market crude and hedge to protect cashflow (Brent 2024 avg $86/bbl).
| Metric | 2024 |
|---|---|
| Brent | $86/bbl |
| FPSO capex | $700–1,500m |
Preview Before You Purchase
Business Model Canvas
The Tullow Oil Business Model Canvas shown here is the actual deliverable, not a mockup. It contains the same structured content and strategic insights you’ll receive after purchase. Upon ordering you’ll download this exact, fully editable document in Word and Excel formats.
Original: $10.00
-65%$10.00
$3.50Description
Business Model Canvas for an upstream oil producer — concise, investor-focused playbook
Unlock the strategic blueprint of Tullow Oil with a concise Business Model Canvas that maps its upstream focus, asset-led value proposition, key JV partnerships, cost structure and commodity risk strategy. Perfect for investors and strategists seeking actionable insights. Purchase the full Word/Excel Canvas for a detailed, section-by-section playbook.
Partnerships
Host governments and NOCs
Production sharing contracts and licenses for Tullow hinge on strong ties with ministries and national oil companies, with PSCs typically spanning 20–30 years to secure acreage and fiscal terms. These relationships lock in royalties, cost recovery and profit oil splits and facilitate timely approvals, local content compliance and community engagement. Stability with host governments underpins long-cycle investments with payback horizons often of 10–30 years.
Joint venture and farm-in partners
Sharing capital and subsurface risk via joint ventures is central to Tullow Oil, with JV partners bringing complementary assets, technical expertise and balance‑sheet strength that reduced net group capex exposure in 2024; Tullow set a 2024 exploration and appraisal budget of about $125m. Farm‑ins monetize acreage while advancing firm work programmes and de‑risking prospects. Robust governance frameworks align work plans, budgets and phased investments across partners.
Oilfield services and EPC contractors
Drilling, completions, seismic and construction rely on specialized vendors to deliver complex upstream activities and keep wells online. Competitive contracting with oilfield services and EPCs lowers lifting costs and boosts uptime through benchmarking and scope optimization. Performance-based contracts align safety, schedule and cost outcomes, while partnerships provide access to new technologies and local supply chains in Tullow’s West African and East African jurisdictions.
Offtakers, traders, and midstream operators
In 2024 Tullow's crude evacuation depends on pipeline, FPSO and terminal operators; reliable capacity is critical to realize produced volumes. Traders provide marketing, scheduling and price-risk solutions. Long-term offtake agreements underpin project financing and cash-flow visibility. Coordinated logistics reduces demurrage and quality differentials.
- offtake
- traders
- midstream
- logistics
Financial institutions and insurers
Project finance, reserve-based loans and hedging lines stabilize cash flows across cycles, enabling predictable debt servicing and funding of development capex and selective M&A while preserving upside. Banks and private funds provide development capital and acquisition bridges; insurers and export credit agencies underwrite operational and political risks. Robust covenants and hedges limit downside exposure without capping project upside.
- Project finance: predictable cashflows
- RBLs: reserve-backed liquidity
- Hedges: price volatility cover
- Banks/funds: capex & M&A funding
- Insurers/ECAs: political/operational risk mitigation
NOC PSCs secure 20–30yr acreage and 10–30yr paybacks
Production sharing contracts and national oil company ties secure 20–30 year acreage and fiscal terms, supporting 10–30 year investment paybacks.
JVs and farm‑ins share subsurface and capital risk; Tullow set a 2024 exploration and appraisal budget of about $125m.
Service contractors, midstream operators and lenders provide execution, evacuation and financing capacity, with insurers/ECAs mitigating political risk.
| Item | 2024 figure |
|---|---|
| Exploration budget | $125m |
| PSC length | 20–30 yrs |
What is included in the product
Detailed Word Document
A concise Business Model Canvas for Tullow Oil mapping the 9 BMC blocks to its upstream exploration, production and asset optimization strategy, highlighting value propositions to host governments and partners, channels, cost/revenue drivers, competitive advantages, and key risks and opportunities for investors and operators.
Customizable Excel Spreadsheet
High-level view of Tullow Oil’s business model with editable cells to quickly identify upstream value drivers, exploration risks, and cost structures. Perfect for boardrooms or teams to condense strategy into a digestible, shareable one-page snapshot for fast decision-making.
Activities
Exploration and appraisal drilling
Identify prospects through integrated geoscience and seismic interpretation across Tullow Oil’s West African portfolios, prioritizing leads with clear structural and stratigraphic traps. Execute appraisal and exploration wells to test plays and delineate discoveries, then optimize well placement to de-risk volume and flow-rate uncertainty. Integrate drilling, petrophysical and flow-test results to mature contingent resources into booked reserves for development planning.
Field development planning and execution
Engineer cost‑effective concepts for subsea, FPSO or onshore solutions using 2024 industry benchmarks: FPSO capex $700–1,500m, subsea tiebacks $50–500m and onshore facilities $100–600m. Sanction projects with clear cost, schedule and production targets (typical first‑oil 24–36 months) and gate‑based approvals tied to ROI and break‑even thresholds. Manage EPC, procurement and installation to first oil while embedding resilience via phased expansions and debottlenecking.
Production operations and maintenance
Operate assets with safety-first protocols targeting uptime above 95% and low unit costs through lean scheduling and cost control. Perform preventive maintenance and integrity management to reduce failure rates, aiming for 10-20% fewer unplanned shutdowns. Apply digital surveillance and AI analytics to optimize wells and facilities, improving recovery and efficiency. Manage water, gas and chemicals to sustain reservoir performance and limit decline rates.
Crude marketing and price risk management
Crude marketing and price risk management: Tullow blends, schedules and delivers to contracted offtakers, optimizing quality and timing to capture differentials; in 2024 Brent averaged about 86 USD/bbl, so timing and quality premiums materially affected realized prices. The company uses hedges to protect cash flow and covenant compliance and aligns sales with shipping and storage to reduce demurrage and spot premium exposure.
- Blend and delivery optimization
- Timing captures quality differentials
- Hedges protect cash flow and covenants
- Sales aligned with shipping & storage to cut costs
Stakeholder, ESG, and compliance management
Engage communities and regulators to maintain license to operate, delivering local content, safety and environmental standards while monitoring emissions, spills and biodiversity impacts; transparent reporting to investors and host nations aligns with global disclosure moves such as IFRS S1/S2 issued 2023 and increasingly adopted in 2024.
- Align disclosures with IFRS S1/S2 (issued 2023)
- Track Scope 1/2 emissions, spills, biodiversity KPIs
- Deliver local content, safety LTIs and community engagement targets
West Africa: sanction fields for 24–36 months first oil; FPSO capex $700–1,500m
Identify/appraise West Africa prospects to convert contingent resources to reserves; sanction projects with 24–36 month first oil. Design FPSO/subsea/onshore concepts (2024 FPSO capex $700–1,500m). Operate >95% uptime, cut unplanned shutdowns 10–20% via AI. Market crude and hedge to protect cashflow (Brent 2024 avg $86/bbl).
| Metric | 2024 |
|---|---|
| Brent | $86/bbl |
| FPSO capex | $700–1,500m |
Preview Before You Purchase
Business Model Canvas
The Tullow Oil Business Model Canvas shown here is the actual deliverable, not a mockup. It contains the same structured content and strategic insights you’ll receive after purchase. Upon ordering you’ll download this exact, fully editable document in Word and Excel formats.











