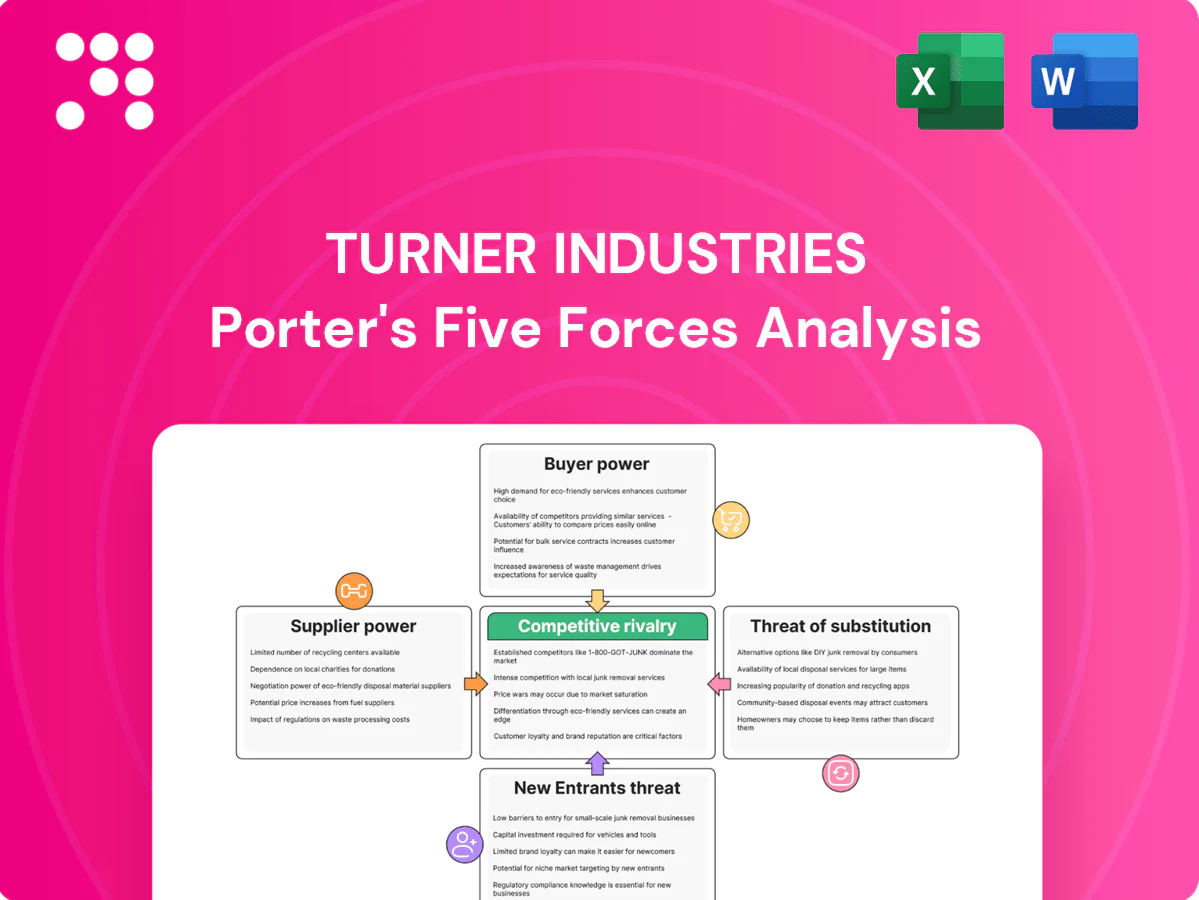
Turner Industries Porter's Five Forces Analysis

Go Beyond the Preview—Access the Full Strategic Report
Turner Industries faces varied competitive pressures—from concentrated supplier relationships and skilled labor scarcity to moderate buyer leverage and niche substitute threats—shaping its margin and growth outlook. This snapshot highlights key dynamics and strategic levers. Ready for deeper, actionable insights? Unlock the full Porter's Five Forces Analysis for force-by-force ratings, visuals, and tailored implications.
Suppliers Bargaining Power

Concentrated critical materials
Concentrated supplies of structural steel, specialty alloys and large-diameter pipe give mills and distributors outsized leverage; in 2024 China produced roughly 57% of global crude steel, tightening markets. Extended lead times and commodity volatility compress margins on fixed-price bids, so Turner uses multi-sourcing, in-house fabrication and long-term supply agreements to stabilize availability and pricing.
OEM equipment dependence
OEM ties for heavy lift cranes, welding systems and specialty tooling keep service schedules aligned with OEMs and major rental houses, raising switching costs and limiting alternatives in 2024. Preferred vendor programs and in-house fleet ownership dilute OEM leverage by enabling direct sourcing and faster turnarounds. Turner's scale secures better commercial terms and priority servicing from suppliers.

Skilled labor scarcity
Certified craft labor, welders, and turnaround specialists are episodically scarce—industry surveys in 2024 show roughly 80% of contractors reporting craft shortages and AWS estimates a 300,000–400,000 welder shortfall, boosting subcontractor and supplier bargaining power. Peak outage seasons drive 4–6%+ wage inflation and heightened availability risk. Turner’s direct-hire model, training pipelines, retention programs, regional mobility, and staggered scheduling materially reduce dependency on the spot market.

Specialty services bottlenecks
- Self-perform breadth lowers supplier bargaining leverage
- Integrated planning compresses third-party scope
- Preferred alliances lock capacity, mitigate rate spikes
- Bundling under primes increases niche supplier timing power
Logistics and energy inputs
Fuel, transport, and site logistics drive Turner Industries execution costs and timelines; U.S. average diesel retail price in 2024 was about $3.90/gal (EIA), and Gulf Coast disruptions compress margins by raising short-term supplier leverage. Forward purchasing and on-site staging reduce cost pass-throughs, while a broad Gulf footprint and yard network damp last-mile volatility.
- Diesel 2024 ≈ $3.90/gal (EIA)
- Forward buys/on-site staging mitigate spikes
- Gulf footprint/yards buffer last-mile risk
Concentrated steel and diesel pressure: China ≈57%, $3.90/gal, 300k–400k welder gap
Concentrated steel/OEM supply and diesel volatility (China ≈57% crude steel; diesel ≈$3.90/gal in 2024) raise supplier leverage; AWS estimates a 300,000–400,000 welder shortfall, and outage wage spikes lift costs. Turner’s self-perform, multi-sourcing, long-term contracts and staging reduce dependence and margin exposure.
| Metric | 2024 | Impact |
|---|---|---|
| China crude steel share | ≈57% | tight markets |
| Diesel (avg) | $3.90/gal | logistics cost pressure |
| Welder gap (AWS) | 300k–400k | labor power |
What is included in the product
 Detailed Word Document
Uncovers competitive drivers, supplier and buyer power, threats from new entrants and substitutes, and intensity of rivalry specific to Turner Industries, with strategic implications and mitigation options.

 Customizable Excel Spreadsheet
A one-sheet Porter’s Five Forces for Turner Industries—clarifies competitive pressures, supplier and buyer dynamics, and project-risk hotspots for fast strategic decisions; editable scores and an instant radar chart make scenario testing and slide-ready summaries effortless.
Customers Bargaining Power

Large, sophisticated clients
Petrochemical, refining and power clients run rigorous RFPs and scorecards—pressuring price and performance—while U.S. refinery capacity of ~18.9 million b/d in 2024 underscores high-stakes uptime demands. They require bundled services and strict SLAs; Turner offsets this with single-vendor lifecycle offerings and standardized KPIs tied to availability and safety. Scale and an industry-leading safety record secure preferred-supplier status.
High switching, yet multi-bidding
Switching contractors mid-lifecycle is costly, so buyers keep competitive tension by maintaining parallel prequalified vendors and multi-bid processes; multi-year MSAs, typically 3–5 years in 2024, reduce churn while embedding rate negotiations. Turner deepens stickiness through embedded maintenance teams and turnaround mastery, and performance data plus digital reporting reinforce renewal cases and justify premium retainers.

Outcome and safety KPIs
Buyers press outcome and safety KPIs—zero-incident targets, schedule certainty, and quality metrics—to structure value-sharing and risk-transfer clauses, with many 2024 contracts increasingly tying payment to measurable outcomes. Turner’s entrenched safety culture and track record of predictable delivery support premium pricing and reduce buyers’ ability to force pure price competition. Documented outcomes and KPI dashboards provide objective defense against commoditization.

Cyclical spend sensitivity
- 2024: increased project deferrals raised margin pressure
- Maintenance/turnarounds: steady revenue source in 2024
- Flexible staffing: key to rapid scaling during upcycles
Backward integration threat
In 2024 some owners expanded internal maintenance and alliance models to cut third-party spend, pressuring rates and scope; Turner counters by embedding jointly managed teams to emulate in-house economics and protect margins. Co-planning and shared systems align incentives and reduce disintermediation risk while preserving service revenue and contract length.
- Owners shifting to in-house/alliance models (2024 trend)
- Turner: jointly managed teams to mirror in-house cost structure
- Co-planning and shared systems lower disintermediation risk
High uptime stakes and 3-5 yr MSAs bolster pricing leverage despite 2024 deferrals
Buyers exert strong price/performance pressure via rigorous RFPs and outcome-linked SLAs, but high uptime stakes (US refinery capacity ~18.9 million b/d in 2024) and switching costs bolster Turner’s leverage. Multi-year MSAs (3–5 years in 2024), embedded teams and KPI dashboards increase stickiness and justify premiums. 2024 deferrals raised margin pressure; turnarounds remained a stable revenue anchor.
| Metric | 2024 |
|---|---|
| US refinery capacity | ~18.9 million b/d |
| Typical MSA length | 3–5 years |
| Market trend | Increased project deferrals; steady turnarounds |
Same Document Delivered
Turner Industries Porter's Five Forces Analysis
This preview is the exact Turner Industries Porter's Five Forces analysis you'll receive after purchase, containing a thorough evaluation of competitive rivalry, supplier and buyer power, threats of entry and substitution. The file shown is fully formatted and ready for immediate download with no placeholders. Purchase grants instant access to this same comprehensive, professionally written document.

Go Beyond the Preview—Access the Full Strategic Report
Turner Industries faces varied competitive pressures—from concentrated supplier relationships and skilled labor scarcity to moderate buyer leverage and niche substitute threats—shaping its margin and growth outlook. This snapshot highlights key dynamics and strategic levers. Ready for deeper, actionable insights? Unlock the full Porter's Five Forces Analysis for force-by-force ratings, visuals, and tailored implications.
Suppliers Bargaining Power
Concentrated critical materials
Concentrated supplies of structural steel, specialty alloys and large-diameter pipe give mills and distributors outsized leverage; in 2024 China produced roughly 57% of global crude steel, tightening markets. Extended lead times and commodity volatility compress margins on fixed-price bids, so Turner uses multi-sourcing, in-house fabrication and long-term supply agreements to stabilize availability and pricing.
OEM equipment dependence
OEM ties for heavy lift cranes, welding systems and specialty tooling keep service schedules aligned with OEMs and major rental houses, raising switching costs and limiting alternatives in 2024. Preferred vendor programs and in-house fleet ownership dilute OEM leverage by enabling direct sourcing and faster turnarounds. Turner's scale secures better commercial terms and priority servicing from suppliers.
Skilled labor scarcity
Certified craft labor, welders, and turnaround specialists are episodically scarce—industry surveys in 2024 show roughly 80% of contractors reporting craft shortages and AWS estimates a 300,000–400,000 welder shortfall, boosting subcontractor and supplier bargaining power. Peak outage seasons drive 4–6%+ wage inflation and heightened availability risk. Turner’s direct-hire model, training pipelines, retention programs, regional mobility, and staggered scheduling materially reduce dependency on the spot market.
Specialty services bottlenecks
- Self-perform breadth lowers supplier bargaining leverage
- Integrated planning compresses third-party scope
- Preferred alliances lock capacity, mitigate rate spikes
- Bundling under primes increases niche supplier timing power
Logistics and energy inputs
Fuel, transport, and site logistics drive Turner Industries execution costs and timelines; U.S. average diesel retail price in 2024 was about $3.90/gal (EIA), and Gulf Coast disruptions compress margins by raising short-term supplier leverage. Forward purchasing and on-site staging reduce cost pass-throughs, while a broad Gulf footprint and yard network damp last-mile volatility.
- Diesel 2024 ≈ $3.90/gal (EIA)
- Forward buys/on-site staging mitigate spikes
- Gulf footprint/yards buffer last-mile risk
Concentrated steel and diesel pressure: China ≈57%, $3.90/gal, 300k–400k welder gap
Concentrated steel/OEM supply and diesel volatility (China ≈57% crude steel; diesel ≈$3.90/gal in 2024) raise supplier leverage; AWS estimates a 300,000–400,000 welder shortfall, and outage wage spikes lift costs. Turner’s self-perform, multi-sourcing, long-term contracts and staging reduce dependence and margin exposure.
| Metric | 2024 | Impact |
|---|---|---|
| China crude steel share | ≈57% | tight markets |
| Diesel (avg) | $3.90/gal | logistics cost pressure |
| Welder gap (AWS) | 300k–400k | labor power |
What is included in the product
Detailed Word Document
Uncovers competitive drivers, supplier and buyer power, threats from new entrants and substitutes, and intensity of rivalry specific to Turner Industries, with strategic implications and mitigation options.
Customizable Excel Spreadsheet
A one-sheet Porter’s Five Forces for Turner Industries—clarifies competitive pressures, supplier and buyer dynamics, and project-risk hotspots for fast strategic decisions; editable scores and an instant radar chart make scenario testing and slide-ready summaries effortless.
Customers Bargaining Power
Large, sophisticated clients
Petrochemical, refining and power clients run rigorous RFPs and scorecards—pressuring price and performance—while U.S. refinery capacity of ~18.9 million b/d in 2024 underscores high-stakes uptime demands. They require bundled services and strict SLAs; Turner offsets this with single-vendor lifecycle offerings and standardized KPIs tied to availability and safety. Scale and an industry-leading safety record secure preferred-supplier status.
High switching, yet multi-bidding
Switching contractors mid-lifecycle is costly, so buyers keep competitive tension by maintaining parallel prequalified vendors and multi-bid processes; multi-year MSAs, typically 3–5 years in 2024, reduce churn while embedding rate negotiations. Turner deepens stickiness through embedded maintenance teams and turnaround mastery, and performance data plus digital reporting reinforce renewal cases and justify premium retainers.
Outcome and safety KPIs
Buyers press outcome and safety KPIs—zero-incident targets, schedule certainty, and quality metrics—to structure value-sharing and risk-transfer clauses, with many 2024 contracts increasingly tying payment to measurable outcomes. Turner’s entrenched safety culture and track record of predictable delivery support premium pricing and reduce buyers’ ability to force pure price competition. Documented outcomes and KPI dashboards provide objective defense against commoditization.
Cyclical spend sensitivity
- 2024: increased project deferrals raised margin pressure
- Maintenance/turnarounds: steady revenue source in 2024
- Flexible staffing: key to rapid scaling during upcycles
Backward integration threat
In 2024 some owners expanded internal maintenance and alliance models to cut third-party spend, pressuring rates and scope; Turner counters by embedding jointly managed teams to emulate in-house economics and protect margins. Co-planning and shared systems align incentives and reduce disintermediation risk while preserving service revenue and contract length.
- Owners shifting to in-house/alliance models (2024 trend)
- Turner: jointly managed teams to mirror in-house cost structure
- Co-planning and shared systems lower disintermediation risk
High uptime stakes and 3-5 yr MSAs bolster pricing leverage despite 2024 deferrals
Buyers exert strong price/performance pressure via rigorous RFPs and outcome-linked SLAs, but high uptime stakes (US refinery capacity ~18.9 million b/d in 2024) and switching costs bolster Turner’s leverage. Multi-year MSAs (3–5 years in 2024), embedded teams and KPI dashboards increase stickiness and justify premiums. 2024 deferrals raised margin pressure; turnarounds remained a stable revenue anchor.
| Metric | 2024 |
|---|---|
| US refinery capacity | ~18.9 million b/d |
| Typical MSA length | 3–5 years |
| Market trend | Increased project deferrals; steady turnarounds |
Same Document Delivered
Turner Industries Porter's Five Forces Analysis
This preview is the exact Turner Industries Porter's Five Forces analysis you'll receive after purchase, containing a thorough evaluation of competitive rivalry, supplier and buyer power, threats of entry and substitution. The file shown is fully formatted and ready for immediate download with no placeholders. Purchase grants instant access to this same comprehensive, professionally written document.
Description
Go Beyond the Preview—Access the Full Strategic Report
Turner Industries faces varied competitive pressures—from concentrated supplier relationships and skilled labor scarcity to moderate buyer leverage and niche substitute threats—shaping its margin and growth outlook. This snapshot highlights key dynamics and strategic levers. Ready for deeper, actionable insights? Unlock the full Porter's Five Forces Analysis for force-by-force ratings, visuals, and tailored implications.
Suppliers Bargaining Power
Concentrated critical materials
Concentrated supplies of structural steel, specialty alloys and large-diameter pipe give mills and distributors outsized leverage; in 2024 China produced roughly 57% of global crude steel, tightening markets. Extended lead times and commodity volatility compress margins on fixed-price bids, so Turner uses multi-sourcing, in-house fabrication and long-term supply agreements to stabilize availability and pricing.
OEM equipment dependence
OEM ties for heavy lift cranes, welding systems and specialty tooling keep service schedules aligned with OEMs and major rental houses, raising switching costs and limiting alternatives in 2024. Preferred vendor programs and in-house fleet ownership dilute OEM leverage by enabling direct sourcing and faster turnarounds. Turner's scale secures better commercial terms and priority servicing from suppliers.
Skilled labor scarcity
Certified craft labor, welders, and turnaround specialists are episodically scarce—industry surveys in 2024 show roughly 80% of contractors reporting craft shortages and AWS estimates a 300,000–400,000 welder shortfall, boosting subcontractor and supplier bargaining power. Peak outage seasons drive 4–6%+ wage inflation and heightened availability risk. Turner’s direct-hire model, training pipelines, retention programs, regional mobility, and staggered scheduling materially reduce dependency on the spot market.
Specialty services bottlenecks
- Self-perform breadth lowers supplier bargaining leverage
- Integrated planning compresses third-party scope
- Preferred alliances lock capacity, mitigate rate spikes
- Bundling under primes increases niche supplier timing power
Logistics and energy inputs
Fuel, transport, and site logistics drive Turner Industries execution costs and timelines; U.S. average diesel retail price in 2024 was about $3.90/gal (EIA), and Gulf Coast disruptions compress margins by raising short-term supplier leverage. Forward purchasing and on-site staging reduce cost pass-throughs, while a broad Gulf footprint and yard network damp last-mile volatility.
- Diesel 2024 ≈ $3.90/gal (EIA)
- Forward buys/on-site staging mitigate spikes
- Gulf footprint/yards buffer last-mile risk
Concentrated steel and diesel pressure: China ≈57%, $3.90/gal, 300k–400k welder gap
Concentrated steel/OEM supply and diesel volatility (China ≈57% crude steel; diesel ≈$3.90/gal in 2024) raise supplier leverage; AWS estimates a 300,000–400,000 welder shortfall, and outage wage spikes lift costs. Turner’s self-perform, multi-sourcing, long-term contracts and staging reduce dependence and margin exposure.
| Metric | 2024 | Impact |
|---|---|---|
| China crude steel share | ≈57% | tight markets |
| Diesel (avg) | $3.90/gal | logistics cost pressure |
| Welder gap (AWS) | 300k–400k | labor power |
What is included in the product
Detailed Word Document
Uncovers competitive drivers, supplier and buyer power, threats from new entrants and substitutes, and intensity of rivalry specific to Turner Industries, with strategic implications and mitigation options.
Customizable Excel Spreadsheet
A one-sheet Porter’s Five Forces for Turner Industries—clarifies competitive pressures, supplier and buyer dynamics, and project-risk hotspots for fast strategic decisions; editable scores and an instant radar chart make scenario testing and slide-ready summaries effortless.
Customers Bargaining Power
Large, sophisticated clients
Petrochemical, refining and power clients run rigorous RFPs and scorecards—pressuring price and performance—while U.S. refinery capacity of ~18.9 million b/d in 2024 underscores high-stakes uptime demands. They require bundled services and strict SLAs; Turner offsets this with single-vendor lifecycle offerings and standardized KPIs tied to availability and safety. Scale and an industry-leading safety record secure preferred-supplier status.
High switching, yet multi-bidding
Switching contractors mid-lifecycle is costly, so buyers keep competitive tension by maintaining parallel prequalified vendors and multi-bid processes; multi-year MSAs, typically 3–5 years in 2024, reduce churn while embedding rate negotiations. Turner deepens stickiness through embedded maintenance teams and turnaround mastery, and performance data plus digital reporting reinforce renewal cases and justify premium retainers.
Outcome and safety KPIs
Buyers press outcome and safety KPIs—zero-incident targets, schedule certainty, and quality metrics—to structure value-sharing and risk-transfer clauses, with many 2024 contracts increasingly tying payment to measurable outcomes. Turner’s entrenched safety culture and track record of predictable delivery support premium pricing and reduce buyers’ ability to force pure price competition. Documented outcomes and KPI dashboards provide objective defense against commoditization.
Cyclical spend sensitivity
- 2024: increased project deferrals raised margin pressure
- Maintenance/turnarounds: steady revenue source in 2024
- Flexible staffing: key to rapid scaling during upcycles
Backward integration threat
In 2024 some owners expanded internal maintenance and alliance models to cut third-party spend, pressuring rates and scope; Turner counters by embedding jointly managed teams to emulate in-house economics and protect margins. Co-planning and shared systems align incentives and reduce disintermediation risk while preserving service revenue and contract length.
- Owners shifting to in-house/alliance models (2024 trend)
- Turner: jointly managed teams to mirror in-house cost structure
- Co-planning and shared systems lower disintermediation risk
High uptime stakes and 3-5 yr MSAs bolster pricing leverage despite 2024 deferrals
Buyers exert strong price/performance pressure via rigorous RFPs and outcome-linked SLAs, but high uptime stakes (US refinery capacity ~18.9 million b/d in 2024) and switching costs bolster Turner’s leverage. Multi-year MSAs (3–5 years in 2024), embedded teams and KPI dashboards increase stickiness and justify premiums. 2024 deferrals raised margin pressure; turnarounds remained a stable revenue anchor.
| Metric | 2024 |
|---|---|
| US refinery capacity | ~18.9 million b/d |
| Typical MSA length | 3–5 years |
| Market trend | Increased project deferrals; steady turnarounds |
Same Document Delivered
Turner Industries Porter's Five Forces Analysis
This preview is the exact Turner Industries Porter's Five Forces analysis you'll receive after purchase, containing a thorough evaluation of competitive rivalry, supplier and buyer power, threats of entry and substitution. The file shown is fully formatted and ready for immediate download with no placeholders. Purchase grants instant access to this same comprehensive, professionally written document.











