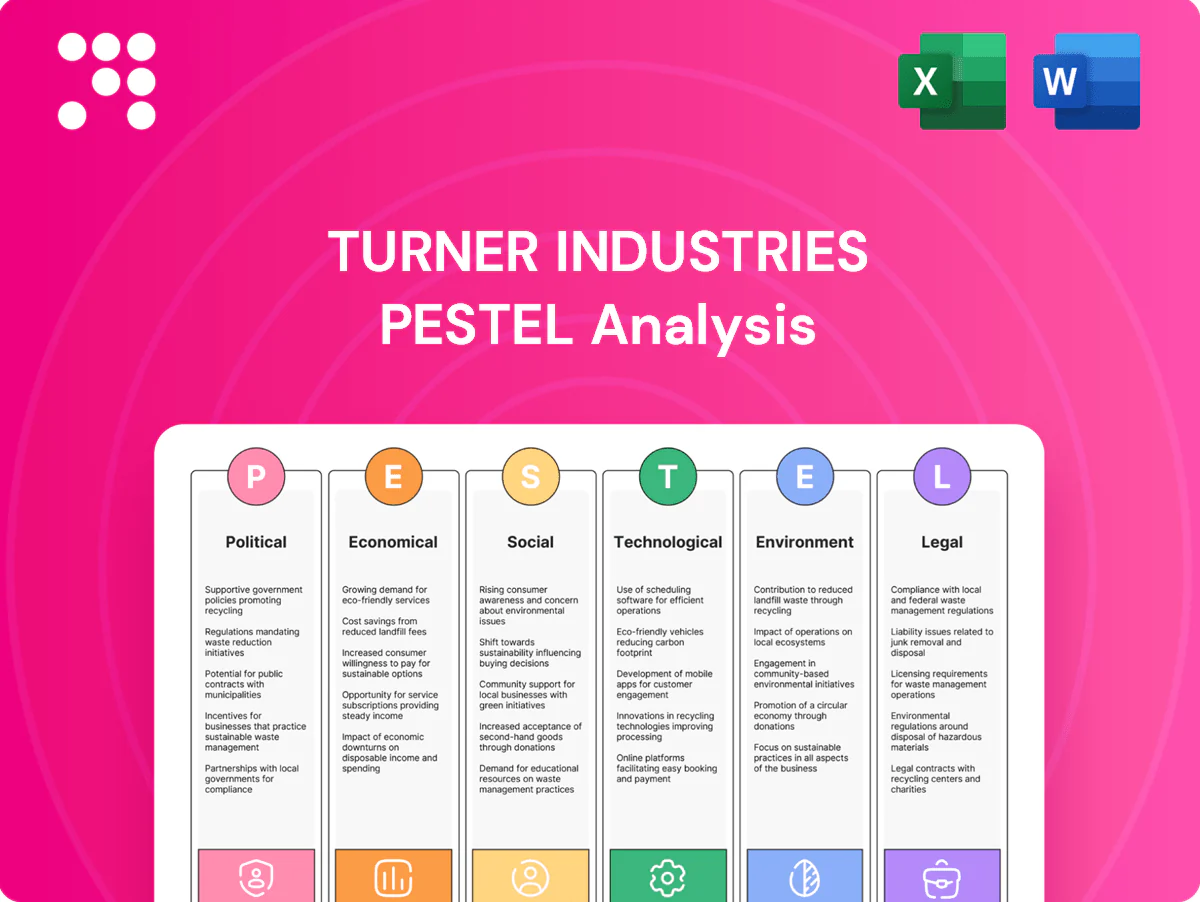
Turner Industries PESTLE Analysis

Your Competitive Advantage Starts with This Report
Gain an edge with our targeted PESTLE analysis of Turner Industries—uncover how political regulation, economic cycles, social trends, technological advances, legal requirements and environmental pressures shape strategy and risk. This concise, expert report is formatted for immediate use in investment memos, boardrooms, and strategy plans. Buy the full analysis now for actionable insights and editable deliverables.
Political factors

Energy policy and incentives
Shifts in federal and state energy policy redirect capital across petrochemical, LNG, power and low‑carbon projects, amplified by the Inflation Reduction Act's roughly 369 billion dollars in energy and climate incentives. Industrial decarbonization incentives and DOE multi‑billion programs are pulling forward maintenance and retrofit demand at fabricators like Turner. Policy stability lowers bid risk and improves backlog visibility; volatility forces scenario planning and diversified end‑market exposure as U.S. LNG exports topped 12 Bcf/d by 2024.
Permitting and infrastructure priorities
Permitting timelines for large industrial sites directly shift project starts and resource allocation: CEQ found median NEPA EIS reviews were about 4.5 years (CEQ 2019), while CEQ finalized streamlined NEPA rules in 2023 to accelerate approvals. The Bipartisan Infrastructure Law commits $1.2 trillion (including $550B new) which can crowd in private upgrades near hubs. Delays raise overhead burn and inventory carrying costs, typically 20–30% annually.

Trade and tariff exposure
Tariffs on steel and aluminum (Section 232: 25% on steel, 10% on aluminum) and Section 301 duties (up to 25% on many China-origin goods) inflate project costs and threaten quote validity; antidumping/countervailing duties further hit specialty alloys. Import restrictions shift sourcing for pipe, valves and fittings toward alternate suppliers or higher-cost domestic options. Rapid policy changes drive the need for escalator clauses and material/FX hedging. Local content rules such as Buy American and IRA-linked domestic incentives increase demand for domestic fabrication capacity.

Labor and workforce politics
Policy on skilled immigration (H-1B cap 85,000) and apprenticeship pipelines directly affect craft availability for Turner; union membership in the US was 10.1% in 2023, influencing labor rules and bargaining power.
Prevailing wage/Davis-Bacon rules apply to federally supported construction contracts over $2,000, raising labor cost baselines for turnarounds.
Federal workforce-development funding tied to the 2021 Infrastructure Investment and Jobs Act ($1.2 trillion) and state programs can ease shortages, while strikes or abrupt policy shifts can delay schedules.
- Skilled immigration: H-1B cap 85,000
- Union rate: 10.1% (2023)
- Davis-Bacon threshold: $2,000
- Infrastructure Act: $1.2T
Geopolitical stability and supply chains
Global tensions in 2024 have constrained specialty-metals and critical-equipment lead times, with firms reporting longer procurement cycles into Q1 2025. Port congestion and sanctions increasingly complicate logistics for mega-projects, making political risk management a clear differentiator in execution reliability. Multi-sourcing and regionalized supply chains reduce exposure and speed recovery from disruptions.
- Geopolitical constraints: 2024 pressures on lead times
- Logistics risk: ports & sanctions impact mega-projects
- Execution edge: political risk management
- Mitigation: multi-sourcing & regionalization
IRA $369B and BIL drive decarbonization; tariffs 25%
Federal incentives (IRA ~$369B) and BIL ($1.2T) shift capital to decarbonization and infrastructure, improving backlog visibility while permitting/NEPA timelines (median ~4.5 years; 2023 NEPA rule) and tariffs (steel 25%) raise schedule and cost risk. Labor constraints (union rate 10.1% 2023; H-1B cap 85,000) and 2024 supply-chain/geopolitical pressures (US LNG >12 Bcf/d 2024) force multi-sourcing.
| Metric | Value |
|---|---|
| IRA | $369B |
| BIL | $1.2T |
| Steel tariff | 25% |
| Union rate (2023) | 10.1% |
| H-1B cap | 85,000 |
| US LNG (2024) | >12 Bcf/d |
What is included in the product
 Detailed Word Document
Explores how external macro-environmental factors uniquely affect Turner Industries across six dimensions—Political, Economic, Social, Technological, Environmental, and Legal—backed by current data and trends to identify threats and opportunities. Designed for executives, consultants, and entrepreneurs, it delivers detailed sub-points, forward-looking insights, and clean formatting ready for business plans or pitch decks.

 Customizable Excel Spreadsheet
A concise, visually segmented PESTLE summary for Turner Industries that removes research clutter, is editable for local context, and easily dropped into presentations for fast team alignment.
Economic factors

Cyclicality of industrial capex
Client spending in chemicals, refining and power closely tracks global GDP and commodity cycles; global GDP grew about 3.1% in 2024 (IMF). Downturns shift project mix toward maintenance and reliability work rather than new-build capital projects. A diversified backlog across end-markets smooths revenue volatility. Flexible staffing models and subcontracting preserve margins through cyclical troughs.
Commodity and energy price swings
Oil (Brent averaged about $86/bbl in 2024) and gas (Henry Hub ~ $3/MMBtu in 2024) plus NGL swings directly drive feedstock economics and timing of plant expansions; price spikes raise maintenance intensity but often defer greenfield projects. Cost-plus and indexed contracts, coupled with strategic procurement timing and inventory buffers, protect bid integrity and margins against short-term volatility.

Interest rates and financing conditions
Higher rates (Federal funds target 5.25–5.50% in June 2025; 10-year Treasury ~4.2%) raise hurdle rates and can delay discretionary projects. Clients with leveraged balance sheets often phase scopes or renegotiate timelines to reduce near-term cash needs. Strong cash management is critical for long-duration turnarounds, while early payment terms and adequate bonding capacity preserve Turner Industries competitiveness.

Inflation and materials costs
- Steel +8% (2024)
- Escalation clauses: deployed
- Strategic buys: reduced volatility
- Productivity offset wages
- Accurate forecasting = disciplined bids
Labor market tightness
Competition for welders, pipefitters and electricians has driven regional wage inflation (industry average 6–8% YoY in 2023–24) and higher retention costs for Turner Industries, while targeted apprenticeship and cross‑craft training pipelines have raised utilization and reduced overtime. Travel and per diem swings (fleet and lodging costs pushing some Gulf Coast per diems toward $200–225/day in 2024) change project break‑evens by region. Turner’s strong safety reputation (industry‑leading TRIR ranges near 0.3–0.5) supports recruiting in tight labor markets.
- Wage inflation: 6–8% (2023–24)
- Per diem pressure: $200–225/day (Gulf Coast, 2024)
- Training impact: apprenticeship/cross‑crafts raise utilization
- Safety: TRIR ~0.3–0.5 aids hiring
IRA $369B and BIL drive decarbonization; tariffs 25%
Turner’s project mix and margins track global GDP (3.1% in 2024) and energy cycles (Brent ~$86/bbl, Henry Hub ~$3/MMBtu in 2024); downturns shift work to maintenance. Higher rates (Fed 5.25–5.50% Jun 2025; 10y ~4.2%) and steel +8% (2024) pressure bids. Wage inflation 6–8% and per diems $200–225 (Gulf Coast) raise labor costs; safety (TRIR 0.3–0.5) aids recruitment.
| Metric | Value |
|---|---|
| Global GDP (2024) | 3.1% |
| Brent (2024) | $86/bbl |
| Fed funds (Jun 2025) | 5.25–5.50% |
| Steel cost (2024) | +8% |
| Wage inflation | 6–8% |
| Per diem (Gulf Coast) | $200–225 |
| TRIR | 0.3–0.5 |
Same Document Delivered
Turner Industries PESTLE Analysis
The preview shown here is the exact Turner Industries PESTLE Analysis document you’ll receive after purchase—fully formatted and ready to use. It outlines Political, Economic, Social, Technological, Legal, and Environmental factors specific to Turner Industries with clear headings and actionable insights. No placeholders or teasers—this is the final, downloadable file you’ll get instantly after checkout.

Your Competitive Advantage Starts with This Report
Gain an edge with our targeted PESTLE analysis of Turner Industries—uncover how political regulation, economic cycles, social trends, technological advances, legal requirements and environmental pressures shape strategy and risk. This concise, expert report is formatted for immediate use in investment memos, boardrooms, and strategy plans. Buy the full analysis now for actionable insights and editable deliverables.
Political factors
Energy policy and incentives
Shifts in federal and state energy policy redirect capital across petrochemical, LNG, power and low‑carbon projects, amplified by the Inflation Reduction Act's roughly 369 billion dollars in energy and climate incentives. Industrial decarbonization incentives and DOE multi‑billion programs are pulling forward maintenance and retrofit demand at fabricators like Turner. Policy stability lowers bid risk and improves backlog visibility; volatility forces scenario planning and diversified end‑market exposure as U.S. LNG exports topped 12 Bcf/d by 2024.
Permitting and infrastructure priorities
Permitting timelines for large industrial sites directly shift project starts and resource allocation: CEQ found median NEPA EIS reviews were about 4.5 years (CEQ 2019), while CEQ finalized streamlined NEPA rules in 2023 to accelerate approvals. The Bipartisan Infrastructure Law commits $1.2 trillion (including $550B new) which can crowd in private upgrades near hubs. Delays raise overhead burn and inventory carrying costs, typically 20–30% annually.
Trade and tariff exposure
Tariffs on steel and aluminum (Section 232: 25% on steel, 10% on aluminum) and Section 301 duties (up to 25% on many China-origin goods) inflate project costs and threaten quote validity; antidumping/countervailing duties further hit specialty alloys. Import restrictions shift sourcing for pipe, valves and fittings toward alternate suppliers or higher-cost domestic options. Rapid policy changes drive the need for escalator clauses and material/FX hedging. Local content rules such as Buy American and IRA-linked domestic incentives increase demand for domestic fabrication capacity.
Labor and workforce politics
Policy on skilled immigration (H-1B cap 85,000) and apprenticeship pipelines directly affect craft availability for Turner; union membership in the US was 10.1% in 2023, influencing labor rules and bargaining power.
Prevailing wage/Davis-Bacon rules apply to federally supported construction contracts over $2,000, raising labor cost baselines for turnarounds.
Federal workforce-development funding tied to the 2021 Infrastructure Investment and Jobs Act ($1.2 trillion) and state programs can ease shortages, while strikes or abrupt policy shifts can delay schedules.
- Skilled immigration: H-1B cap 85,000
- Union rate: 10.1% (2023)
- Davis-Bacon threshold: $2,000
- Infrastructure Act: $1.2T
Geopolitical stability and supply chains
Global tensions in 2024 have constrained specialty-metals and critical-equipment lead times, with firms reporting longer procurement cycles into Q1 2025. Port congestion and sanctions increasingly complicate logistics for mega-projects, making political risk management a clear differentiator in execution reliability. Multi-sourcing and regionalized supply chains reduce exposure and speed recovery from disruptions.
- Geopolitical constraints: 2024 pressures on lead times
- Logistics risk: ports & sanctions impact mega-projects
- Execution edge: political risk management
- Mitigation: multi-sourcing & regionalization
IRA $369B and BIL drive decarbonization; tariffs 25%
Federal incentives (IRA ~$369B) and BIL ($1.2T) shift capital to decarbonization and infrastructure, improving backlog visibility while permitting/NEPA timelines (median ~4.5 years; 2023 NEPA rule) and tariffs (steel 25%) raise schedule and cost risk. Labor constraints (union rate 10.1% 2023; H-1B cap 85,000) and 2024 supply-chain/geopolitical pressures (US LNG >12 Bcf/d 2024) force multi-sourcing.
| Metric | Value |
|---|---|
| IRA | $369B |
| BIL | $1.2T |
| Steel tariff | 25% |
| Union rate (2023) | 10.1% |
| H-1B cap | 85,000 |
| US LNG (2024) | >12 Bcf/d |
What is included in the product
Detailed Word Document
Explores how external macro-environmental factors uniquely affect Turner Industries across six dimensions—Political, Economic, Social, Technological, Environmental, and Legal—backed by current data and trends to identify threats and opportunities. Designed for executives, consultants, and entrepreneurs, it delivers detailed sub-points, forward-looking insights, and clean formatting ready for business plans or pitch decks.
Customizable Excel Spreadsheet
A concise, visually segmented PESTLE summary for Turner Industries that removes research clutter, is editable for local context, and easily dropped into presentations for fast team alignment.
Economic factors
Cyclicality of industrial capex
Client spending in chemicals, refining and power closely tracks global GDP and commodity cycles; global GDP grew about 3.1% in 2024 (IMF). Downturns shift project mix toward maintenance and reliability work rather than new-build capital projects. A diversified backlog across end-markets smooths revenue volatility. Flexible staffing models and subcontracting preserve margins through cyclical troughs.
Commodity and energy price swings
Oil (Brent averaged about $86/bbl in 2024) and gas (Henry Hub ~ $3/MMBtu in 2024) plus NGL swings directly drive feedstock economics and timing of plant expansions; price spikes raise maintenance intensity but often defer greenfield projects. Cost-plus and indexed contracts, coupled with strategic procurement timing and inventory buffers, protect bid integrity and margins against short-term volatility.
Interest rates and financing conditions
Higher rates (Federal funds target 5.25–5.50% in June 2025; 10-year Treasury ~4.2%) raise hurdle rates and can delay discretionary projects. Clients with leveraged balance sheets often phase scopes or renegotiate timelines to reduce near-term cash needs. Strong cash management is critical for long-duration turnarounds, while early payment terms and adequate bonding capacity preserve Turner Industries competitiveness.
Inflation and materials costs
- Steel +8% (2024)
- Escalation clauses: deployed
- Strategic buys: reduced volatility
- Productivity offset wages
- Accurate forecasting = disciplined bids
Labor market tightness
Competition for welders, pipefitters and electricians has driven regional wage inflation (industry average 6–8% YoY in 2023–24) and higher retention costs for Turner Industries, while targeted apprenticeship and cross‑craft training pipelines have raised utilization and reduced overtime. Travel and per diem swings (fleet and lodging costs pushing some Gulf Coast per diems toward $200–225/day in 2024) change project break‑evens by region. Turner’s strong safety reputation (industry‑leading TRIR ranges near 0.3–0.5) supports recruiting in tight labor markets.
- Wage inflation: 6–8% (2023–24)
- Per diem pressure: $200–225/day (Gulf Coast, 2024)
- Training impact: apprenticeship/cross‑crafts raise utilization
- Safety: TRIR ~0.3–0.5 aids hiring
IRA $369B and BIL drive decarbonization; tariffs 25%
Turner’s project mix and margins track global GDP (3.1% in 2024) and energy cycles (Brent ~$86/bbl, Henry Hub ~$3/MMBtu in 2024); downturns shift work to maintenance. Higher rates (Fed 5.25–5.50% Jun 2025; 10y ~4.2%) and steel +8% (2024) pressure bids. Wage inflation 6–8% and per diems $200–225 (Gulf Coast) raise labor costs; safety (TRIR 0.3–0.5) aids recruitment.
| Metric | Value |
|---|---|
| Global GDP (2024) | 3.1% |
| Brent (2024) | $86/bbl |
| Fed funds (Jun 2025) | 5.25–5.50% |
| Steel cost (2024) | +8% |
| Wage inflation | 6–8% |
| Per diem (Gulf Coast) | $200–225 |
| TRIR | 0.3–0.5 |
Same Document Delivered
Turner Industries PESTLE Analysis
The preview shown here is the exact Turner Industries PESTLE Analysis document you’ll receive after purchase—fully formatted and ready to use. It outlines Political, Economic, Social, Technological, Legal, and Environmental factors specific to Turner Industries with clear headings and actionable insights. No placeholders or teasers—this is the final, downloadable file you’ll get instantly after checkout.
Original: $10.00
-65%$10.00
$3.50Description
Your Competitive Advantage Starts with This Report
Gain an edge with our targeted PESTLE analysis of Turner Industries—uncover how political regulation, economic cycles, social trends, technological advances, legal requirements and environmental pressures shape strategy and risk. This concise, expert report is formatted for immediate use in investment memos, boardrooms, and strategy plans. Buy the full analysis now for actionable insights and editable deliverables.
Political factors
Energy policy and incentives
Shifts in federal and state energy policy redirect capital across petrochemical, LNG, power and low‑carbon projects, amplified by the Inflation Reduction Act's roughly 369 billion dollars in energy and climate incentives. Industrial decarbonization incentives and DOE multi‑billion programs are pulling forward maintenance and retrofit demand at fabricators like Turner. Policy stability lowers bid risk and improves backlog visibility; volatility forces scenario planning and diversified end‑market exposure as U.S. LNG exports topped 12 Bcf/d by 2024.
Permitting and infrastructure priorities
Permitting timelines for large industrial sites directly shift project starts and resource allocation: CEQ found median NEPA EIS reviews were about 4.5 years (CEQ 2019), while CEQ finalized streamlined NEPA rules in 2023 to accelerate approvals. The Bipartisan Infrastructure Law commits $1.2 trillion (including $550B new) which can crowd in private upgrades near hubs. Delays raise overhead burn and inventory carrying costs, typically 20–30% annually.
Trade and tariff exposure
Tariffs on steel and aluminum (Section 232: 25% on steel, 10% on aluminum) and Section 301 duties (up to 25% on many China-origin goods) inflate project costs and threaten quote validity; antidumping/countervailing duties further hit specialty alloys. Import restrictions shift sourcing for pipe, valves and fittings toward alternate suppliers or higher-cost domestic options. Rapid policy changes drive the need for escalator clauses and material/FX hedging. Local content rules such as Buy American and IRA-linked domestic incentives increase demand for domestic fabrication capacity.
Labor and workforce politics
Policy on skilled immigration (H-1B cap 85,000) and apprenticeship pipelines directly affect craft availability for Turner; union membership in the US was 10.1% in 2023, influencing labor rules and bargaining power.
Prevailing wage/Davis-Bacon rules apply to federally supported construction contracts over $2,000, raising labor cost baselines for turnarounds.
Federal workforce-development funding tied to the 2021 Infrastructure Investment and Jobs Act ($1.2 trillion) and state programs can ease shortages, while strikes or abrupt policy shifts can delay schedules.
- Skilled immigration: H-1B cap 85,000
- Union rate: 10.1% (2023)
- Davis-Bacon threshold: $2,000
- Infrastructure Act: $1.2T
Geopolitical stability and supply chains
Global tensions in 2024 have constrained specialty-metals and critical-equipment lead times, with firms reporting longer procurement cycles into Q1 2025. Port congestion and sanctions increasingly complicate logistics for mega-projects, making political risk management a clear differentiator in execution reliability. Multi-sourcing and regionalized supply chains reduce exposure and speed recovery from disruptions.
- Geopolitical constraints: 2024 pressures on lead times
- Logistics risk: ports & sanctions impact mega-projects
- Execution edge: political risk management
- Mitigation: multi-sourcing & regionalization
IRA $369B and BIL drive decarbonization; tariffs 25%
Federal incentives (IRA ~$369B) and BIL ($1.2T) shift capital to decarbonization and infrastructure, improving backlog visibility while permitting/NEPA timelines (median ~4.5 years; 2023 NEPA rule) and tariffs (steel 25%) raise schedule and cost risk. Labor constraints (union rate 10.1% 2023; H-1B cap 85,000) and 2024 supply-chain/geopolitical pressures (US LNG >12 Bcf/d 2024) force multi-sourcing.
| Metric | Value |
|---|---|
| IRA | $369B |
| BIL | $1.2T |
| Steel tariff | 25% |
| Union rate (2023) | 10.1% |
| H-1B cap | 85,000 |
| US LNG (2024) | >12 Bcf/d |
What is included in the product
Detailed Word Document
Explores how external macro-environmental factors uniquely affect Turner Industries across six dimensions—Political, Economic, Social, Technological, Environmental, and Legal—backed by current data and trends to identify threats and opportunities. Designed for executives, consultants, and entrepreneurs, it delivers detailed sub-points, forward-looking insights, and clean formatting ready for business plans or pitch decks.
Customizable Excel Spreadsheet
A concise, visually segmented PESTLE summary for Turner Industries that removes research clutter, is editable for local context, and easily dropped into presentations for fast team alignment.
Economic factors
Cyclicality of industrial capex
Client spending in chemicals, refining and power closely tracks global GDP and commodity cycles; global GDP grew about 3.1% in 2024 (IMF). Downturns shift project mix toward maintenance and reliability work rather than new-build capital projects. A diversified backlog across end-markets smooths revenue volatility. Flexible staffing models and subcontracting preserve margins through cyclical troughs.
Commodity and energy price swings
Oil (Brent averaged about $86/bbl in 2024) and gas (Henry Hub ~ $3/MMBtu in 2024) plus NGL swings directly drive feedstock economics and timing of plant expansions; price spikes raise maintenance intensity but often defer greenfield projects. Cost-plus and indexed contracts, coupled with strategic procurement timing and inventory buffers, protect bid integrity and margins against short-term volatility.
Interest rates and financing conditions
Higher rates (Federal funds target 5.25–5.50% in June 2025; 10-year Treasury ~4.2%) raise hurdle rates and can delay discretionary projects. Clients with leveraged balance sheets often phase scopes or renegotiate timelines to reduce near-term cash needs. Strong cash management is critical for long-duration turnarounds, while early payment terms and adequate bonding capacity preserve Turner Industries competitiveness.
Inflation and materials costs
- Steel +8% (2024)
- Escalation clauses: deployed
- Strategic buys: reduced volatility
- Productivity offset wages
- Accurate forecasting = disciplined bids
Labor market tightness
Competition for welders, pipefitters and electricians has driven regional wage inflation (industry average 6–8% YoY in 2023–24) and higher retention costs for Turner Industries, while targeted apprenticeship and cross‑craft training pipelines have raised utilization and reduced overtime. Travel and per diem swings (fleet and lodging costs pushing some Gulf Coast per diems toward $200–225/day in 2024) change project break‑evens by region. Turner’s strong safety reputation (industry‑leading TRIR ranges near 0.3–0.5) supports recruiting in tight labor markets.
- Wage inflation: 6–8% (2023–24)
- Per diem pressure: $200–225/day (Gulf Coast, 2024)
- Training impact: apprenticeship/cross‑crafts raise utilization
- Safety: TRIR ~0.3–0.5 aids hiring
IRA $369B and BIL drive decarbonization; tariffs 25%
Turner’s project mix and margins track global GDP (3.1% in 2024) and energy cycles (Brent ~$86/bbl, Henry Hub ~$3/MMBtu in 2024); downturns shift work to maintenance. Higher rates (Fed 5.25–5.50% Jun 2025; 10y ~4.2%) and steel +8% (2024) pressure bids. Wage inflation 6–8% and per diems $200–225 (Gulf Coast) raise labor costs; safety (TRIR 0.3–0.5) aids recruitment.
| Metric | Value |
|---|---|
| Global GDP (2024) | 3.1% |
| Brent (2024) | $86/bbl |
| Fed funds (Jun 2025) | 5.25–5.50% |
| Steel cost (2024) | +8% |
| Wage inflation | 6–8% |
| Per diem (Gulf Coast) | $200–225 |
| TRIR | 0.3–0.5 |
Same Document Delivered
Turner Industries PESTLE Analysis
The preview shown here is the exact Turner Industries PESTLE Analysis document you’ll receive after purchase—fully formatted and ready to use. It outlines Political, Economic, Social, Technological, Legal, and Environmental factors specific to Turner Industries with clear headings and actionable insights. No placeholders or teasers—this is the final, downloadable file you’ll get instantly after checkout.











