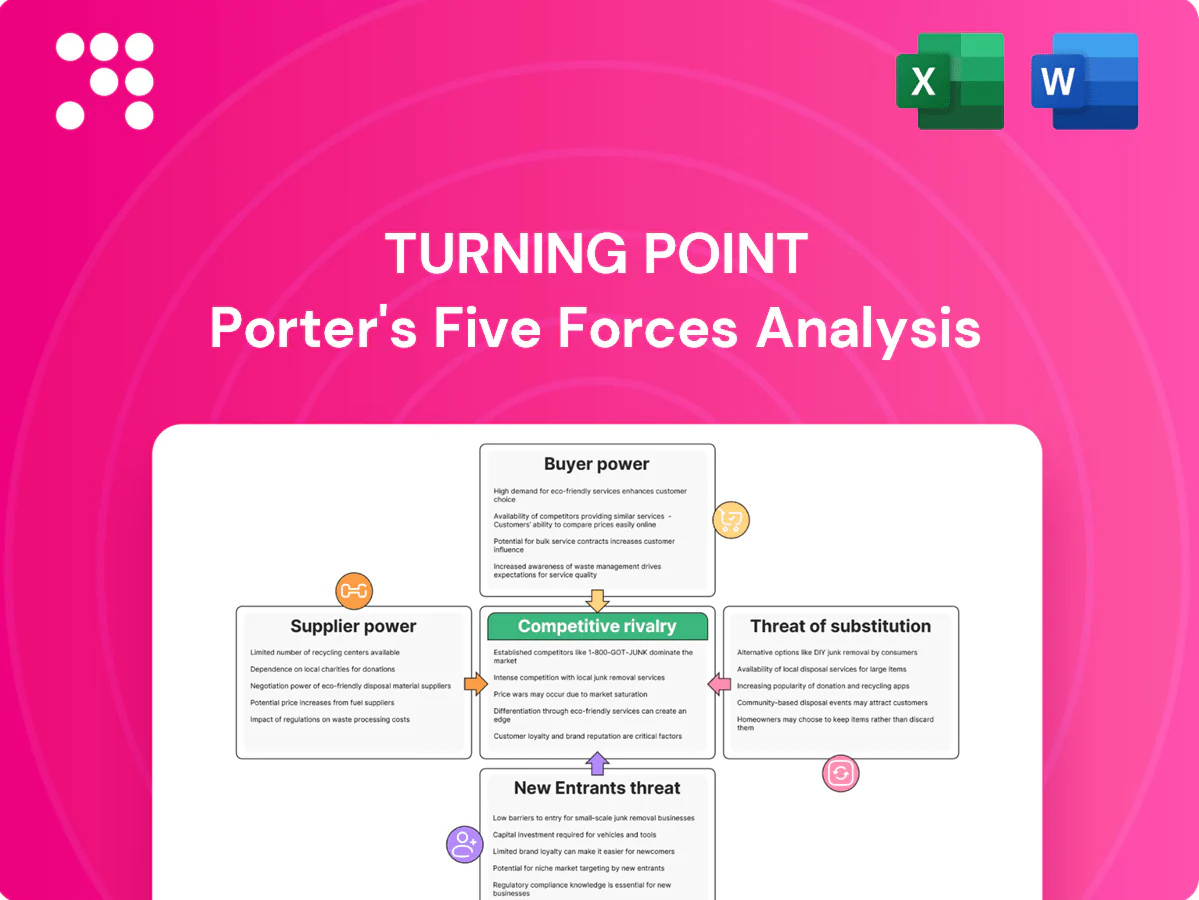
Turning Point Porter's Five Forces Analysis

Elevate Your Analysis with the Complete Porter's Five Forces Analysis
This brief snapshot only scratches the surface of Turning Point’s competitive landscape—supplier leverage, buyer power, and substitute threats all have nuanced impacts. Unlock the full Porter's Five Forces Analysis to explore force-by-force ratings, visuals, and strategic implications. Gain the actionable insights you need to inform investment or strategic decisions.
Suppliers Bargaining Power

Concentrated critical inputs
Active ingredients like nicotine and hemp-derived cannabinoids come from a narrow, compliant supplier base; the global CBD market was estimated at about 6.7 billion USD in 2024, highlighting concentrated demand. Strict testing, purity and traceability requirements further shrink qualified suppliers, letting them push tighter terms. TPB mitigates with multi-sourcing and standards harmonization, but switching costs and supplier leverage persist.
Hardware OEM dependence
Vaping hardware and accessories remain heavily dependent on specialized Asian OEMs, with industry estimates in 2024 indicating over 80% of devices sourced from China/Taiwan. Tooling, firmware and QA create stickiness and 8–12 week lead times, raising supply risk. Currency moves and tariffs have driven double-digit swings in landed costs across 2022–24. Approved-vendor lists and dual tooling reduce but do not eliminate supplier leverage.

Regulatory-grade packaging
Regulatory-grade packaging (compliance labeling, child-resistant formats, serialized packaging) narrows vendor options due to mandates like the EU Falsified Medicines Directive (2019) and the US DSCSA full serialization effective Nov 27, 2023, raising supplier leverage; failures trigger legal and recall risks. Long validation cycles (commonly 12–24 months) boost switching costs, and volume commitments secure price breaks at the expense of flexibility.

Logistics and distribution capacity
Temperature-controlled, hazmat and adult-signature mandates narrow carrier and 3PL options, especially during seasonal surges and regulatory hotspots that tighten capacity and let carriers apply surcharges that squeeze margins. Turning Point counters by forward-deploying inventory and using multi-DC networks to reduce reliance on premium lanes and expedite fees, improving fill rates and margin protection.
- Constraints: specialized handling reduces carrier pool
- Capacity risk: seasonal/regulatory spikes traffic pressure
- Margin impact: carrier surcharges shift cost to shippers
- TPB mitigation: forward inventory + multi-DC resilience
Commodity and FX exposure
Commodity inputs such as paper, leaf, sweeteners and metals create input-price volatility that suppliers often pass through; in 2024 global pulp and paper spot indices showed notable swings, while FX moves amplified imported-component costs. Hedging programs and should-cost models reduced earnings volatility but did not eliminate pass-through risk. Contract clauses using index-based pricing and floor/ceiling triggers moderated disputes and preserved margins.
- Input mix: paper, leaf, sweeteners, metals
- FX impact: amplifies imported cost volatility
- Mitigants: hedging, should-cost models
- Contracts: index-based pricing reduces disputes
Supply squeeze: $6.7B, 80% devices from China/TW
Supplier power is high: CBD raw-materials market ~$6.7B in 2024 and few compliant producers raise price/term leverage. Over 80% of devices sourced from China/Taiwan with 8–12 week lead times and tooling stickiness. Compliance packaging/serialization (DSCSA Nov 27, 2023) and 12–24 month validation increase switching costs. Carriers/3PLs impose seasonal surcharges; input-price swings (pulp, metals) pass through despite hedging.
| Metric | 2024 value | Impact |
|---|---|---|
| Global CBD market | $6.7B | Supplier leverage |
| Device sourcing | >80% China/Taiwan | Lead-time risk |
| Packaging validation | 12–24 mo | Switching cost |
| Lead times | 8–12 weeks | Inventory burden |
What is included in the product
 Detailed Word Document
Tailored Porter's Five Forces analysis for Turning Point that uncovers key competitive drivers, supplier and buyer power, entry barriers, substitutes and disruptive threats; includes strategic commentary and editable Word output for investor or internal use.

 Customizable Excel Spreadsheet
A single-sheet Turning Point Porter's Five Forces tool that translates complex competitive dynamics into actionable priorities—customizable pressure sliders, spider-chart visualization, and plug-and-play Excel integration for rapid decision-making and board-ready slides.
Customers Bargaining Power

Consolidated retail channels
Large c-store chains, wholesalers and big-box retailers exert outsized leverage—Walmart alone posted $611.3B revenue in FY2024—allowing aggressive price and placement demands and slotting fees commonly ranging $10,000–$250,000 per SKU. US CPG trade promotion spend exceeds $90B annually, highlighting retailers' demand for promotional funding and delist leverage that erodes margins. TPB counters with point-of-sale velocity data, measurable brand equity and category captaincy to defend shelf presence.
Vape shops and e-comm optionality
Specialty vape retailers and online platforms can re-source SKUs rapidly, and with global e-commerce at roughly 21% of retail sales in 2024, online optionality amplifies buyer leverage. Low switching costs for accessories heighten price sensitivity, while reviews and ratings—consulted by over 90% of shoppers—can redirect traffic quickly. Differentiated SKUs and MAP policies help contain discount spirals and protect margins.

Private label and gray market
Retailers’ private labels in papers and accessories pushed penetration to about 12–15% in key markets by 2024, materially increasing buyer leverage; gray imports, often 10–25% cheaper, further anchor negotiations; buyers cite these alternatives to extract better terms; authentication tech pilots cut diversion/dilution by up to 30% and stricter channel controls have reduced gray flows by ~40% in pilot programs.

Demand volatility and promo cycles
Demand volatility from 2024 flavor bans, tax changes and rapid trend shifts forces buyers to insist on flexible inventory and liberal returns, pushing deeper promo calendars to clear risk and shifting working-capital burdens onto suppliers; Turning Point Brands leverages analytics-driven promo ROI to defend commercial terms and optimize inventory turns.
- Buyers demand flexible inventory and returns
- Deeper promo calendars to mitigate regulatory/trend risk
- Working-capital burden transfers to suppliers
- TPB uses analytics-driven promo ROI to defend terms
Information asymmetry narrowing
Retail buyers' leverage squeezes supplier margins, e-commerce and trade spend amplify pressure
Buyers wield strong leverage—large retailers (Walmart $611.3B FY2024) force price, placement and slotting fees, and US CPG trade promotions top ~$90B, compressing supplier margins ~100–300 bp. Online optionality (e‑commerce ~21% of retail sales 2024) and syndicated POS (~70–75% coverage) amplify negotiation power. TPB defends via POS velocity, promo-ROI analytics, MAPs and authentication pilots.
| Metric | 2024 Value |
|---|---|
| Walmart revenue | $611.3B |
| CPG trade spend | ~$90B |
| E‑commerce share | ~21% |
| Syndicated POS | 70–75% |
| Margin squeeze | 100–300 bp |
Preview Before You Purchase
Turning Point Porter's Five Forces Analysis
This preview shows the exact Turning Point Porter’s Five Forces Analysis you’ll receive immediately after purchase—no placeholders or samples. The file is fully formatted, professionally written, and ready for use in strategic planning or investment review. Purchase grants instant access to this identical document.

Elevate Your Analysis with the Complete Porter's Five Forces Analysis
This brief snapshot only scratches the surface of Turning Point’s competitive landscape—supplier leverage, buyer power, and substitute threats all have nuanced impacts. Unlock the full Porter's Five Forces Analysis to explore force-by-force ratings, visuals, and strategic implications. Gain the actionable insights you need to inform investment or strategic decisions.
Suppliers Bargaining Power
Concentrated critical inputs
Active ingredients like nicotine and hemp-derived cannabinoids come from a narrow, compliant supplier base; the global CBD market was estimated at about 6.7 billion USD in 2024, highlighting concentrated demand. Strict testing, purity and traceability requirements further shrink qualified suppliers, letting them push tighter terms. TPB mitigates with multi-sourcing and standards harmonization, but switching costs and supplier leverage persist.
Hardware OEM dependence
Vaping hardware and accessories remain heavily dependent on specialized Asian OEMs, with industry estimates in 2024 indicating over 80% of devices sourced from China/Taiwan. Tooling, firmware and QA create stickiness and 8–12 week lead times, raising supply risk. Currency moves and tariffs have driven double-digit swings in landed costs across 2022–24. Approved-vendor lists and dual tooling reduce but do not eliminate supplier leverage.
Regulatory-grade packaging
Regulatory-grade packaging (compliance labeling, child-resistant formats, serialized packaging) narrows vendor options due to mandates like the EU Falsified Medicines Directive (2019) and the US DSCSA full serialization effective Nov 27, 2023, raising supplier leverage; failures trigger legal and recall risks. Long validation cycles (commonly 12–24 months) boost switching costs, and volume commitments secure price breaks at the expense of flexibility.
Logistics and distribution capacity
Temperature-controlled, hazmat and adult-signature mandates narrow carrier and 3PL options, especially during seasonal surges and regulatory hotspots that tighten capacity and let carriers apply surcharges that squeeze margins. Turning Point counters by forward-deploying inventory and using multi-DC networks to reduce reliance on premium lanes and expedite fees, improving fill rates and margin protection.
- Constraints: specialized handling reduces carrier pool
- Capacity risk: seasonal/regulatory spikes traffic pressure
- Margin impact: carrier surcharges shift cost to shippers
- TPB mitigation: forward inventory + multi-DC resilience
Commodity and FX exposure
Commodity inputs such as paper, leaf, sweeteners and metals create input-price volatility that suppliers often pass through; in 2024 global pulp and paper spot indices showed notable swings, while FX moves amplified imported-component costs. Hedging programs and should-cost models reduced earnings volatility but did not eliminate pass-through risk. Contract clauses using index-based pricing and floor/ceiling triggers moderated disputes and preserved margins.
- Input mix: paper, leaf, sweeteners, metals
- FX impact: amplifies imported cost volatility
- Mitigants: hedging, should-cost models
- Contracts: index-based pricing reduces disputes
Supply squeeze: $6.7B, 80% devices from China/TW
Supplier power is high: CBD raw-materials market ~$6.7B in 2024 and few compliant producers raise price/term leverage. Over 80% of devices sourced from China/Taiwan with 8–12 week lead times and tooling stickiness. Compliance packaging/serialization (DSCSA Nov 27, 2023) and 12–24 month validation increase switching costs. Carriers/3PLs impose seasonal surcharges; input-price swings (pulp, metals) pass through despite hedging.
| Metric | 2024 value | Impact |
|---|---|---|
| Global CBD market | $6.7B | Supplier leverage |
| Device sourcing | >80% China/Taiwan | Lead-time risk |
| Packaging validation | 12–24 mo | Switching cost |
| Lead times | 8–12 weeks | Inventory burden |
What is included in the product
Detailed Word Document
Tailored Porter's Five Forces analysis for Turning Point that uncovers key competitive drivers, supplier and buyer power, entry barriers, substitutes and disruptive threats; includes strategic commentary and editable Word output for investor or internal use.
Customizable Excel Spreadsheet
A single-sheet Turning Point Porter's Five Forces tool that translates complex competitive dynamics into actionable priorities—customizable pressure sliders, spider-chart visualization, and plug-and-play Excel integration for rapid decision-making and board-ready slides.
Customers Bargaining Power
Consolidated retail channels
Large c-store chains, wholesalers and big-box retailers exert outsized leverage—Walmart alone posted $611.3B revenue in FY2024—allowing aggressive price and placement demands and slotting fees commonly ranging $10,000–$250,000 per SKU. US CPG trade promotion spend exceeds $90B annually, highlighting retailers' demand for promotional funding and delist leverage that erodes margins. TPB counters with point-of-sale velocity data, measurable brand equity and category captaincy to defend shelf presence.
Vape shops and e-comm optionality
Specialty vape retailers and online platforms can re-source SKUs rapidly, and with global e-commerce at roughly 21% of retail sales in 2024, online optionality amplifies buyer leverage. Low switching costs for accessories heighten price sensitivity, while reviews and ratings—consulted by over 90% of shoppers—can redirect traffic quickly. Differentiated SKUs and MAP policies help contain discount spirals and protect margins.
Private label and gray market
Retailers’ private labels in papers and accessories pushed penetration to about 12–15% in key markets by 2024, materially increasing buyer leverage; gray imports, often 10–25% cheaper, further anchor negotiations; buyers cite these alternatives to extract better terms; authentication tech pilots cut diversion/dilution by up to 30% and stricter channel controls have reduced gray flows by ~40% in pilot programs.
Demand volatility and promo cycles
Demand volatility from 2024 flavor bans, tax changes and rapid trend shifts forces buyers to insist on flexible inventory and liberal returns, pushing deeper promo calendars to clear risk and shifting working-capital burdens onto suppliers; Turning Point Brands leverages analytics-driven promo ROI to defend commercial terms and optimize inventory turns.
- Buyers demand flexible inventory and returns
- Deeper promo calendars to mitigate regulatory/trend risk
- Working-capital burden transfers to suppliers
- TPB uses analytics-driven promo ROI to defend terms
Information asymmetry narrowing
Retail buyers' leverage squeezes supplier margins, e-commerce and trade spend amplify pressure
Buyers wield strong leverage—large retailers (Walmart $611.3B FY2024) force price, placement and slotting fees, and US CPG trade promotions top ~$90B, compressing supplier margins ~100–300 bp. Online optionality (e‑commerce ~21% of retail sales 2024) and syndicated POS (~70–75% coverage) amplify negotiation power. TPB defends via POS velocity, promo-ROI analytics, MAPs and authentication pilots.
| Metric | 2024 Value |
|---|---|
| Walmart revenue | $611.3B |
| CPG trade spend | ~$90B |
| E‑commerce share | ~21% |
| Syndicated POS | 70–75% |
| Margin squeeze | 100–300 bp |
Preview Before You Purchase
Turning Point Porter's Five Forces Analysis
This preview shows the exact Turning Point Porter’s Five Forces Analysis you’ll receive immediately after purchase—no placeholders or samples. The file is fully formatted, professionally written, and ready for use in strategic planning or investment review. Purchase grants instant access to this identical document.
Original: $10.00
-65%$10.00
$3.50Description
Elevate Your Analysis with the Complete Porter's Five Forces Analysis
This brief snapshot only scratches the surface of Turning Point’s competitive landscape—supplier leverage, buyer power, and substitute threats all have nuanced impacts. Unlock the full Porter's Five Forces Analysis to explore force-by-force ratings, visuals, and strategic implications. Gain the actionable insights you need to inform investment or strategic decisions.
Suppliers Bargaining Power
Concentrated critical inputs
Active ingredients like nicotine and hemp-derived cannabinoids come from a narrow, compliant supplier base; the global CBD market was estimated at about 6.7 billion USD in 2024, highlighting concentrated demand. Strict testing, purity and traceability requirements further shrink qualified suppliers, letting them push tighter terms. TPB mitigates with multi-sourcing and standards harmonization, but switching costs and supplier leverage persist.
Hardware OEM dependence
Vaping hardware and accessories remain heavily dependent on specialized Asian OEMs, with industry estimates in 2024 indicating over 80% of devices sourced from China/Taiwan. Tooling, firmware and QA create stickiness and 8–12 week lead times, raising supply risk. Currency moves and tariffs have driven double-digit swings in landed costs across 2022–24. Approved-vendor lists and dual tooling reduce but do not eliminate supplier leverage.
Regulatory-grade packaging
Regulatory-grade packaging (compliance labeling, child-resistant formats, serialized packaging) narrows vendor options due to mandates like the EU Falsified Medicines Directive (2019) and the US DSCSA full serialization effective Nov 27, 2023, raising supplier leverage; failures trigger legal and recall risks. Long validation cycles (commonly 12–24 months) boost switching costs, and volume commitments secure price breaks at the expense of flexibility.
Logistics and distribution capacity
Temperature-controlled, hazmat and adult-signature mandates narrow carrier and 3PL options, especially during seasonal surges and regulatory hotspots that tighten capacity and let carriers apply surcharges that squeeze margins. Turning Point counters by forward-deploying inventory and using multi-DC networks to reduce reliance on premium lanes and expedite fees, improving fill rates and margin protection.
- Constraints: specialized handling reduces carrier pool
- Capacity risk: seasonal/regulatory spikes traffic pressure
- Margin impact: carrier surcharges shift cost to shippers
- TPB mitigation: forward inventory + multi-DC resilience
Commodity and FX exposure
Commodity inputs such as paper, leaf, sweeteners and metals create input-price volatility that suppliers often pass through; in 2024 global pulp and paper spot indices showed notable swings, while FX moves amplified imported-component costs. Hedging programs and should-cost models reduced earnings volatility but did not eliminate pass-through risk. Contract clauses using index-based pricing and floor/ceiling triggers moderated disputes and preserved margins.
- Input mix: paper, leaf, sweeteners, metals
- FX impact: amplifies imported cost volatility
- Mitigants: hedging, should-cost models
- Contracts: index-based pricing reduces disputes
Supply squeeze: $6.7B, 80% devices from China/TW
Supplier power is high: CBD raw-materials market ~$6.7B in 2024 and few compliant producers raise price/term leverage. Over 80% of devices sourced from China/Taiwan with 8–12 week lead times and tooling stickiness. Compliance packaging/serialization (DSCSA Nov 27, 2023) and 12–24 month validation increase switching costs. Carriers/3PLs impose seasonal surcharges; input-price swings (pulp, metals) pass through despite hedging.
| Metric | 2024 value | Impact |
|---|---|---|
| Global CBD market | $6.7B | Supplier leverage |
| Device sourcing | >80% China/Taiwan | Lead-time risk |
| Packaging validation | 12–24 mo | Switching cost |
| Lead times | 8–12 weeks | Inventory burden |
What is included in the product
Detailed Word Document
Tailored Porter's Five Forces analysis for Turning Point that uncovers key competitive drivers, supplier and buyer power, entry barriers, substitutes and disruptive threats; includes strategic commentary and editable Word output for investor or internal use.
Customizable Excel Spreadsheet
A single-sheet Turning Point Porter's Five Forces tool that translates complex competitive dynamics into actionable priorities—customizable pressure sliders, spider-chart visualization, and plug-and-play Excel integration for rapid decision-making and board-ready slides.
Customers Bargaining Power
Consolidated retail channels
Large c-store chains, wholesalers and big-box retailers exert outsized leverage—Walmart alone posted $611.3B revenue in FY2024—allowing aggressive price and placement demands and slotting fees commonly ranging $10,000–$250,000 per SKU. US CPG trade promotion spend exceeds $90B annually, highlighting retailers' demand for promotional funding and delist leverage that erodes margins. TPB counters with point-of-sale velocity data, measurable brand equity and category captaincy to defend shelf presence.
Vape shops and e-comm optionality
Specialty vape retailers and online platforms can re-source SKUs rapidly, and with global e-commerce at roughly 21% of retail sales in 2024, online optionality amplifies buyer leverage. Low switching costs for accessories heighten price sensitivity, while reviews and ratings—consulted by over 90% of shoppers—can redirect traffic quickly. Differentiated SKUs and MAP policies help contain discount spirals and protect margins.
Private label and gray market
Retailers’ private labels in papers and accessories pushed penetration to about 12–15% in key markets by 2024, materially increasing buyer leverage; gray imports, often 10–25% cheaper, further anchor negotiations; buyers cite these alternatives to extract better terms; authentication tech pilots cut diversion/dilution by up to 30% and stricter channel controls have reduced gray flows by ~40% in pilot programs.
Demand volatility and promo cycles
Demand volatility from 2024 flavor bans, tax changes and rapid trend shifts forces buyers to insist on flexible inventory and liberal returns, pushing deeper promo calendars to clear risk and shifting working-capital burdens onto suppliers; Turning Point Brands leverages analytics-driven promo ROI to defend commercial terms and optimize inventory turns.
- Buyers demand flexible inventory and returns
- Deeper promo calendars to mitigate regulatory/trend risk
- Working-capital burden transfers to suppliers
- TPB uses analytics-driven promo ROI to defend terms
Information asymmetry narrowing
Retail buyers' leverage squeezes supplier margins, e-commerce and trade spend amplify pressure
Buyers wield strong leverage—large retailers (Walmart $611.3B FY2024) force price, placement and slotting fees, and US CPG trade promotions top ~$90B, compressing supplier margins ~100–300 bp. Online optionality (e‑commerce ~21% of retail sales 2024) and syndicated POS (~70–75% coverage) amplify negotiation power. TPB defends via POS velocity, promo-ROI analytics, MAPs and authentication pilots.
| Metric | 2024 Value |
|---|---|
| Walmart revenue | $611.3B |
| CPG trade spend | ~$90B |
| E‑commerce share | ~21% |
| Syndicated POS | 70–75% |
| Margin squeeze | 100–300 bp |
Preview Before You Purchase
Turning Point Porter's Five Forces Analysis
This preview shows the exact Turning Point Porter’s Five Forces Analysis you’ll receive immediately after purchase—no placeholders or samples. The file is fully formatted, professionally written, and ready for use in strategic planning or investment review. Purchase grants instant access to this identical document.











