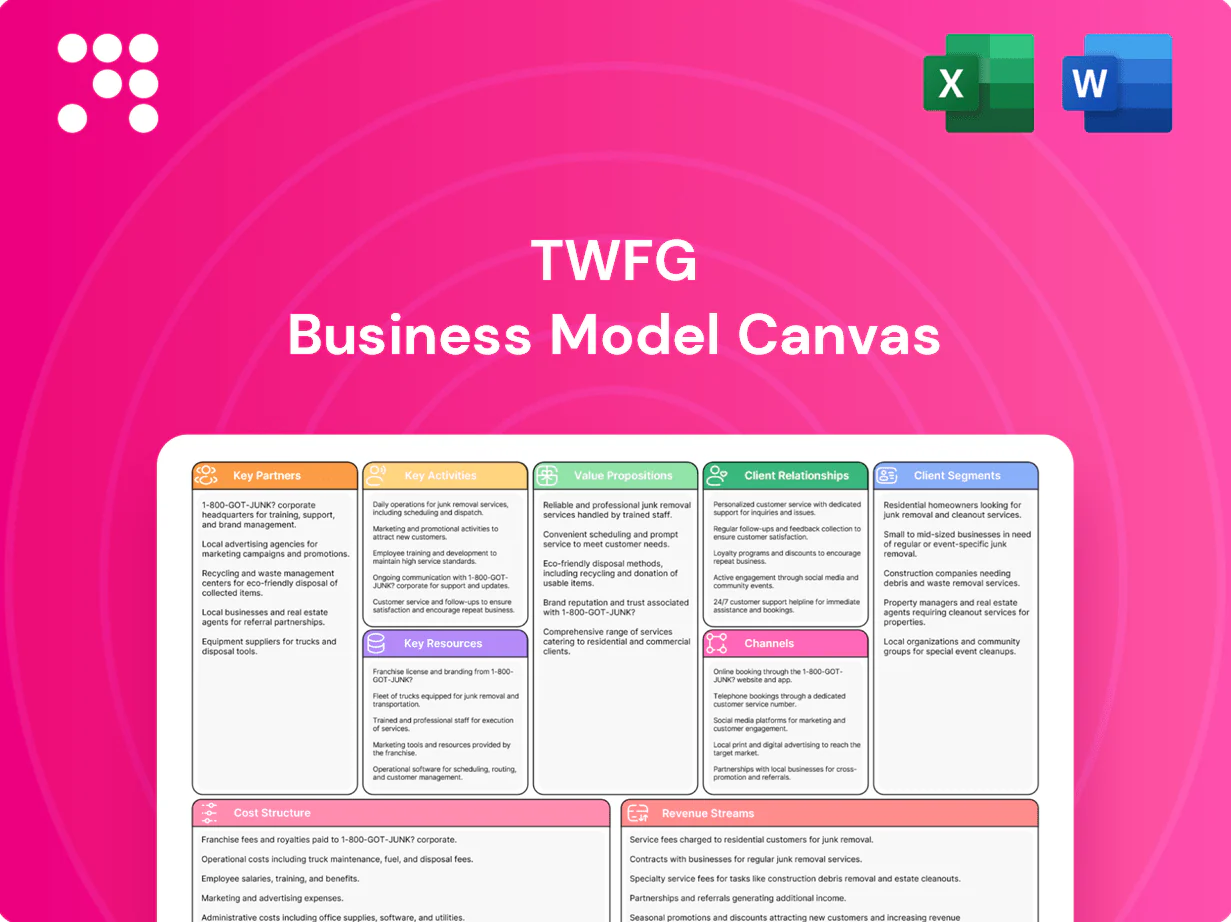
TWFG Business Model Canvas

Unlock the Strategic Business Model Canvas: Actionable Blueprint for Scaling & Opportunity
Unlock the full strategic blueprint behind TWFG’s Business Model Canvas — a concise, actionable map of value propositions, channels, key partners, cost structure and revenue streams. Perfect for investors, entrepreneurs, and advisors, this downloadable Word/Excel file reveals how TWFG scales and where opportunities lie. Purchase the complete canvas to benchmark, strategize, and accelerate results.
Partnerships

Multi-line insurance carriers
Core relationships with 500+ national and regional carriers give TWFG broad product access and competitive pricing across personal, commercial and specialty lines. Carrier partnerships provide underwriting capacity, appetite diversity and drive product innovation, with co-marketing and training programs aligning distribution and carrier strategy. Favorable commission schedules plus contingents (performance-based bonuses often in the low double digits) depend on volume and mix.
Independent agents and agencies
TWFG’s appointed producer network distributes products locally, with independent agents providing prospecting, market insights and tailored advisory; in 2024 independent agents drove roughly 65% of U.S. commercial-line distribution, while TWFG supplies market access, digital tools and back-office support; mutual growth depends on steady lead flow, service quality and retention rates that drive revenue per agent.

Technology and comparative rater vendors
Technology and comparative rater vendors power quoting, submissions, and policy servicing, enabling faster turnaround and consistency across TWFG channels. Integrations with AMS/CRM, raters, and e-signature platforms cut friction and can reduce processing time by up to 50%, improving quote-to-bind rates. Data analytics partners sharpen pricing insights and cross-sell targeting, while cybersecurity and compliance vendors guard sensitive PII against rising breach risks in 2024.

Claims administrators and TPAs
Claims administrators and TPAs improve response time and client outcomes; 2024 industry data show TPAs can cut claim cycle time by about 30% and loss severity by ~15%. Coordinated FNOL and escalation processes build trust with policyholders through faster settlements and clear communications. Integrated loss control and risk engineering services reduce frequency and severity while feedback loops inform carrier placement and renewal strategy.
- Faster FNOL & escalation
- Loss control reduces severity
- Feedback informs carrier placement & renewals
Marketing, finance, and legal partners
Agencies partner with marketing firms to expand brand reach and drive lead generation, with 2024 data showing about 68% of insurance buyers beginning their purchase journey online. Banking and premium finance partners smooth cash flow and improve client affordability through structured payment programs. Legal, compliance, and training partners manage multi-state regulatory risk and upskill producers on products and ethics.
- Marketing: digital-first lead gen (2024 demand surge)
- Finance: premium finance programs improve conversion
- Legal: multi-state compliance coverage
- Training: ongoing producer certification
500+ carriers and agents drive ~65% commercial share; ops cut 30–50%
TWFG leverages 500+ carrier relationships for broad product access and favorable commissions; contingent bonuses often in low double digits. Independent agents drove ~65% of U.S. commercial-line distribution in 2024, supported by TWFG’s AMS, lead flow and retention focus. Tech, TPAs and data partners cut processing/claim times ~30–50% and enable targeted cross-sell and compliance.
| Partnership | Role | 2024 Metric |
|---|---|---|
| Carriers | Capacity & pricing | 500+ partners |
| Agents | Distribution | ~65% commercial share |
| Tech/TPA | Ops & claims | 30–50% time reduction |
| Marketing/Finance | Leads & affordability | 68% buyers start online |
What is included in the product
 Detailed Word Document
A comprehensive, pre-written Business Model Canvas for TWFG covering customer segments, channels, value propositions, revenue streams, key activities, partners, resources, cost structure and customer relationships with actionable narratives. Ideal for presentations and investor discussions, it includes competitive advantages and SWOT-linked insights to support strategic decisions and validation.

 Customizable Excel Spreadsheet
One-page, editable TWFG Business Model Canvas pinpoints customer and operational pain points quickly, letting teams map root causes and test solutions without reformatting. Shareable and concise, it speeds alignment and decision-making for faster issue resolution.
Activities

Producer recruiting and enablement
Attract, onboard, and train independent agents to expand TWFG distribution by tapping into a US pool of about 315,000 licensed insurance agents (BLS 2023). Provide toolkits, market access, and sales playbooks plus licensing support for all 50 states. Maintain performance dashboards and coaching to monitor productivity and compliance readiness.
Market placement and underwriting support
Match risks to carriers with the right appetite and rates, package submissions, negotiate terms, and bind coverage while leveraging comparative raters and underwriter relationships to streamline placements; independent agency retention averaged about 85% in 2024, guiding focus on renewal optimization. Optimize placement to improve coverage quality and policyholder retention, targeting higher-margin, long-term books.

Client advisory and policy servicing
Deliver tailored needs assessments and coverage design across personal, commercial, and life lines, targeting gaps and cost savings during annual reviews; industry surveys in 2024 showed over 60% of clients expect proactive risk reviews. Handle endorsements, certificates, and renewals promptly, aiming for 48-hour turnaround on routine requests. Coordinate claims advocacy when issues arise to protect retention and recovery.

Data analytics and cross-selling
Use portfolio analytics to surface upsell and cross-sell opportunities by segmenting clients by risk profile and life stage, raising targeted penetration rates; in 2024 TWFG programs aim to lift cross-sell conversion by 10-15%. Continuously monitor loss ratios, retention (industry avg ~82% in 2024) and producer performance to prioritize interventions and reprice risk. Feed these insights into carrier and channel strategies to improve combined ratio and ROE.
- Segment clients: risk, life stage
- KPIs: loss ratio, retention, producer ROI
- Targets: +10-15% cross-sell (2024 plan)
- Action: inform carrier/channel repricing & incentives
Compliance and risk management
Maintain state-by-state regulatory adherence and robust E&O controls, continuously aligning TWFG processes with evolving carrier rules and statutes. Secure data and manage permissions across CRM, policy admin, and communication systems to limit breach and compliance exposure. Audit documentation and communications regularly and update procedures as regulations and carrier rules evolve.
- Regulatory mapping by jurisdiction
- Access control and encryption
- Audit trails and policy updates
Scale agent distribution: 315,000 pool, 85% retention, 10–15% cross-sell
Recruit, onboard, train and coach from a US pool of ~315,000 licensed agents (BLS 2023) to expand distribution; maintain dashboards for productivity and compliance. Place and bind risks via carrier relationships, targeting 85% independent-agency retention (2024) and 48-hour routine-turnaround. Use portfolio analytics to lift cross-sell 10–15% (2024) and monitor loss ratios/retention for repricing.
| Metric | 2023/24 | Target |
|---|---|---|
| Licensed agents (BLS) | 315,000 (2023) | - |
| Agency retention | 85% (2024) | ≥85% |
| Cross-sell lift | - | 10–15% (2024) |
| Turnaround | 48 hrs goal | 48 hrs |
Preview Before You Purchase
Business Model Canvas
The TWFG Business Model Canvas you see here is the exact document delivered after purchase, not a mockup. When you buy, you’ll receive this same fully formatted, editable file ready for presentation and use. No placeholders, no hidden content—what you preview is what you own.

Unlock the Strategic Business Model Canvas: Actionable Blueprint for Scaling & Opportunity
Unlock the full strategic blueprint behind TWFG’s Business Model Canvas — a concise, actionable map of value propositions, channels, key partners, cost structure and revenue streams. Perfect for investors, entrepreneurs, and advisors, this downloadable Word/Excel file reveals how TWFG scales and where opportunities lie. Purchase the complete canvas to benchmark, strategize, and accelerate results.
Partnerships
Multi-line insurance carriers
Core relationships with 500+ national and regional carriers give TWFG broad product access and competitive pricing across personal, commercial and specialty lines. Carrier partnerships provide underwriting capacity, appetite diversity and drive product innovation, with co-marketing and training programs aligning distribution and carrier strategy. Favorable commission schedules plus contingents (performance-based bonuses often in the low double digits) depend on volume and mix.
Independent agents and agencies
TWFG’s appointed producer network distributes products locally, with independent agents providing prospecting, market insights and tailored advisory; in 2024 independent agents drove roughly 65% of U.S. commercial-line distribution, while TWFG supplies market access, digital tools and back-office support; mutual growth depends on steady lead flow, service quality and retention rates that drive revenue per agent.
Technology and comparative rater vendors
Technology and comparative rater vendors power quoting, submissions, and policy servicing, enabling faster turnaround and consistency across TWFG channels. Integrations with AMS/CRM, raters, and e-signature platforms cut friction and can reduce processing time by up to 50%, improving quote-to-bind rates. Data analytics partners sharpen pricing insights and cross-sell targeting, while cybersecurity and compliance vendors guard sensitive PII against rising breach risks in 2024.
Claims administrators and TPAs
Claims administrators and TPAs improve response time and client outcomes; 2024 industry data show TPAs can cut claim cycle time by about 30% and loss severity by ~15%. Coordinated FNOL and escalation processes build trust with policyholders through faster settlements and clear communications. Integrated loss control and risk engineering services reduce frequency and severity while feedback loops inform carrier placement and renewal strategy.
- Faster FNOL & escalation
- Loss control reduces severity
- Feedback informs carrier placement & renewals
Marketing, finance, and legal partners
Agencies partner with marketing firms to expand brand reach and drive lead generation, with 2024 data showing about 68% of insurance buyers beginning their purchase journey online. Banking and premium finance partners smooth cash flow and improve client affordability through structured payment programs. Legal, compliance, and training partners manage multi-state regulatory risk and upskill producers on products and ethics.
- Marketing: digital-first lead gen (2024 demand surge)
- Finance: premium finance programs improve conversion
- Legal: multi-state compliance coverage
- Training: ongoing producer certification
500+ carriers and agents drive ~65% commercial share; ops cut 30–50%
TWFG leverages 500+ carrier relationships for broad product access and favorable commissions; contingent bonuses often in low double digits. Independent agents drove ~65% of U.S. commercial-line distribution in 2024, supported by TWFG’s AMS, lead flow and retention focus. Tech, TPAs and data partners cut processing/claim times ~30–50% and enable targeted cross-sell and compliance.
| Partnership | Role | 2024 Metric |
|---|---|---|
| Carriers | Capacity & pricing | 500+ partners |
| Agents | Distribution | ~65% commercial share |
| Tech/TPA | Ops & claims | 30–50% time reduction |
| Marketing/Finance | Leads & affordability | 68% buyers start online |
What is included in the product
Detailed Word Document
A comprehensive, pre-written Business Model Canvas for TWFG covering customer segments, channels, value propositions, revenue streams, key activities, partners, resources, cost structure and customer relationships with actionable narratives. Ideal for presentations and investor discussions, it includes competitive advantages and SWOT-linked insights to support strategic decisions and validation.
Customizable Excel Spreadsheet
One-page, editable TWFG Business Model Canvas pinpoints customer and operational pain points quickly, letting teams map root causes and test solutions without reformatting. Shareable and concise, it speeds alignment and decision-making for faster issue resolution.
Activities
Producer recruiting and enablement
Attract, onboard, and train independent agents to expand TWFG distribution by tapping into a US pool of about 315,000 licensed insurance agents (BLS 2023). Provide toolkits, market access, and sales playbooks plus licensing support for all 50 states. Maintain performance dashboards and coaching to monitor productivity and compliance readiness.
Market placement and underwriting support
Match risks to carriers with the right appetite and rates, package submissions, negotiate terms, and bind coverage while leveraging comparative raters and underwriter relationships to streamline placements; independent agency retention averaged about 85% in 2024, guiding focus on renewal optimization. Optimize placement to improve coverage quality and policyholder retention, targeting higher-margin, long-term books.
Client advisory and policy servicing
Deliver tailored needs assessments and coverage design across personal, commercial, and life lines, targeting gaps and cost savings during annual reviews; industry surveys in 2024 showed over 60% of clients expect proactive risk reviews. Handle endorsements, certificates, and renewals promptly, aiming for 48-hour turnaround on routine requests. Coordinate claims advocacy when issues arise to protect retention and recovery.
Data analytics and cross-selling
Use portfolio analytics to surface upsell and cross-sell opportunities by segmenting clients by risk profile and life stage, raising targeted penetration rates; in 2024 TWFG programs aim to lift cross-sell conversion by 10-15%. Continuously monitor loss ratios, retention (industry avg ~82% in 2024) and producer performance to prioritize interventions and reprice risk. Feed these insights into carrier and channel strategies to improve combined ratio and ROE.
- Segment clients: risk, life stage
- KPIs: loss ratio, retention, producer ROI
- Targets: +10-15% cross-sell (2024 plan)
- Action: inform carrier/channel repricing & incentives
Compliance and risk management
Maintain state-by-state regulatory adherence and robust E&O controls, continuously aligning TWFG processes with evolving carrier rules and statutes. Secure data and manage permissions across CRM, policy admin, and communication systems to limit breach and compliance exposure. Audit documentation and communications regularly and update procedures as regulations and carrier rules evolve.
- Regulatory mapping by jurisdiction
- Access control and encryption
- Audit trails and policy updates
Scale agent distribution: 315,000 pool, 85% retention, 10–15% cross-sell
Recruit, onboard, train and coach from a US pool of ~315,000 licensed agents (BLS 2023) to expand distribution; maintain dashboards for productivity and compliance. Place and bind risks via carrier relationships, targeting 85% independent-agency retention (2024) and 48-hour routine-turnaround. Use portfolio analytics to lift cross-sell 10–15% (2024) and monitor loss ratios/retention for repricing.
| Metric | 2023/24 | Target |
|---|---|---|
| Licensed agents (BLS) | 315,000 (2023) | - |
| Agency retention | 85% (2024) | ≥85% |
| Cross-sell lift | - | 10–15% (2024) |
| Turnaround | 48 hrs goal | 48 hrs |
Preview Before You Purchase
Business Model Canvas
The TWFG Business Model Canvas you see here is the exact document delivered after purchase, not a mockup. When you buy, you’ll receive this same fully formatted, editable file ready for presentation and use. No placeholders, no hidden content—what you preview is what you own.
Original: $10.00
-65%$10.00
$3.50Description
Unlock the Strategic Business Model Canvas: Actionable Blueprint for Scaling & Opportunity
Unlock the full strategic blueprint behind TWFG’s Business Model Canvas — a concise, actionable map of value propositions, channels, key partners, cost structure and revenue streams. Perfect for investors, entrepreneurs, and advisors, this downloadable Word/Excel file reveals how TWFG scales and where opportunities lie. Purchase the complete canvas to benchmark, strategize, and accelerate results.
Partnerships
Multi-line insurance carriers
Core relationships with 500+ national and regional carriers give TWFG broad product access and competitive pricing across personal, commercial and specialty lines. Carrier partnerships provide underwriting capacity, appetite diversity and drive product innovation, with co-marketing and training programs aligning distribution and carrier strategy. Favorable commission schedules plus contingents (performance-based bonuses often in the low double digits) depend on volume and mix.
Independent agents and agencies
TWFG’s appointed producer network distributes products locally, with independent agents providing prospecting, market insights and tailored advisory; in 2024 independent agents drove roughly 65% of U.S. commercial-line distribution, while TWFG supplies market access, digital tools and back-office support; mutual growth depends on steady lead flow, service quality and retention rates that drive revenue per agent.
Technology and comparative rater vendors
Technology and comparative rater vendors power quoting, submissions, and policy servicing, enabling faster turnaround and consistency across TWFG channels. Integrations with AMS/CRM, raters, and e-signature platforms cut friction and can reduce processing time by up to 50%, improving quote-to-bind rates. Data analytics partners sharpen pricing insights and cross-sell targeting, while cybersecurity and compliance vendors guard sensitive PII against rising breach risks in 2024.
Claims administrators and TPAs
Claims administrators and TPAs improve response time and client outcomes; 2024 industry data show TPAs can cut claim cycle time by about 30% and loss severity by ~15%. Coordinated FNOL and escalation processes build trust with policyholders through faster settlements and clear communications. Integrated loss control and risk engineering services reduce frequency and severity while feedback loops inform carrier placement and renewal strategy.
- Faster FNOL & escalation
- Loss control reduces severity
- Feedback informs carrier placement & renewals
Marketing, finance, and legal partners
Agencies partner with marketing firms to expand brand reach and drive lead generation, with 2024 data showing about 68% of insurance buyers beginning their purchase journey online. Banking and premium finance partners smooth cash flow and improve client affordability through structured payment programs. Legal, compliance, and training partners manage multi-state regulatory risk and upskill producers on products and ethics.
- Marketing: digital-first lead gen (2024 demand surge)
- Finance: premium finance programs improve conversion
- Legal: multi-state compliance coverage
- Training: ongoing producer certification
500+ carriers and agents drive ~65% commercial share; ops cut 30–50%
TWFG leverages 500+ carrier relationships for broad product access and favorable commissions; contingent bonuses often in low double digits. Independent agents drove ~65% of U.S. commercial-line distribution in 2024, supported by TWFG’s AMS, lead flow and retention focus. Tech, TPAs and data partners cut processing/claim times ~30–50% and enable targeted cross-sell and compliance.
| Partnership | Role | 2024 Metric |
|---|---|---|
| Carriers | Capacity & pricing | 500+ partners |
| Agents | Distribution | ~65% commercial share |
| Tech/TPA | Ops & claims | 30–50% time reduction |
| Marketing/Finance | Leads & affordability | 68% buyers start online |
What is included in the product
Detailed Word Document
A comprehensive, pre-written Business Model Canvas for TWFG covering customer segments, channels, value propositions, revenue streams, key activities, partners, resources, cost structure and customer relationships with actionable narratives. Ideal for presentations and investor discussions, it includes competitive advantages and SWOT-linked insights to support strategic decisions and validation.
Customizable Excel Spreadsheet
One-page, editable TWFG Business Model Canvas pinpoints customer and operational pain points quickly, letting teams map root causes and test solutions without reformatting. Shareable and concise, it speeds alignment and decision-making for faster issue resolution.
Activities
Producer recruiting and enablement
Attract, onboard, and train independent agents to expand TWFG distribution by tapping into a US pool of about 315,000 licensed insurance agents (BLS 2023). Provide toolkits, market access, and sales playbooks plus licensing support for all 50 states. Maintain performance dashboards and coaching to monitor productivity and compliance readiness.
Market placement and underwriting support
Match risks to carriers with the right appetite and rates, package submissions, negotiate terms, and bind coverage while leveraging comparative raters and underwriter relationships to streamline placements; independent agency retention averaged about 85% in 2024, guiding focus on renewal optimization. Optimize placement to improve coverage quality and policyholder retention, targeting higher-margin, long-term books.
Client advisory and policy servicing
Deliver tailored needs assessments and coverage design across personal, commercial, and life lines, targeting gaps and cost savings during annual reviews; industry surveys in 2024 showed over 60% of clients expect proactive risk reviews. Handle endorsements, certificates, and renewals promptly, aiming for 48-hour turnaround on routine requests. Coordinate claims advocacy when issues arise to protect retention and recovery.
Data analytics and cross-selling
Use portfolio analytics to surface upsell and cross-sell opportunities by segmenting clients by risk profile and life stage, raising targeted penetration rates; in 2024 TWFG programs aim to lift cross-sell conversion by 10-15%. Continuously monitor loss ratios, retention (industry avg ~82% in 2024) and producer performance to prioritize interventions and reprice risk. Feed these insights into carrier and channel strategies to improve combined ratio and ROE.
- Segment clients: risk, life stage
- KPIs: loss ratio, retention, producer ROI
- Targets: +10-15% cross-sell (2024 plan)
- Action: inform carrier/channel repricing & incentives
Compliance and risk management
Maintain state-by-state regulatory adherence and robust E&O controls, continuously aligning TWFG processes with evolving carrier rules and statutes. Secure data and manage permissions across CRM, policy admin, and communication systems to limit breach and compliance exposure. Audit documentation and communications regularly and update procedures as regulations and carrier rules evolve.
- Regulatory mapping by jurisdiction
- Access control and encryption
- Audit trails and policy updates
Scale agent distribution: 315,000 pool, 85% retention, 10–15% cross-sell
Recruit, onboard, train and coach from a US pool of ~315,000 licensed agents (BLS 2023) to expand distribution; maintain dashboards for productivity and compliance. Place and bind risks via carrier relationships, targeting 85% independent-agency retention (2024) and 48-hour routine-turnaround. Use portfolio analytics to lift cross-sell 10–15% (2024) and monitor loss ratios/retention for repricing.
| Metric | 2023/24 | Target |
|---|---|---|
| Licensed agents (BLS) | 315,000 (2023) | - |
| Agency retention | 85% (2024) | ≥85% |
| Cross-sell lift | - | 10–15% (2024) |
| Turnaround | 48 hrs goal | 48 hrs |
Preview Before You Purchase
Business Model Canvas
The TWFG Business Model Canvas you see here is the exact document delivered after purchase, not a mockup. When you buy, you’ll receive this same fully formatted, editable file ready for presentation and use. No placeholders, no hidden content—what you preview is what you own.











