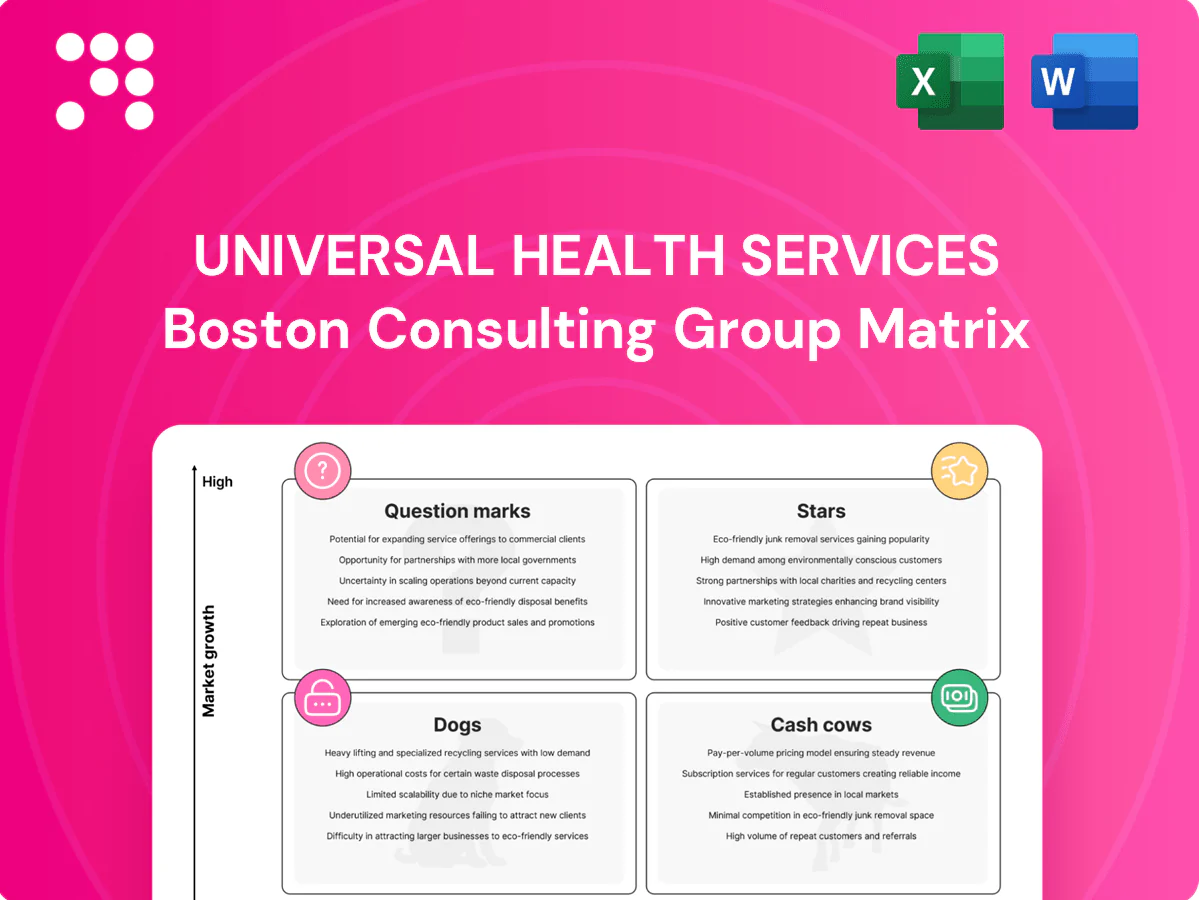
Universal Health Services Boston Consulting Group Matrix

Download Your Competitive Advantage
Universal Health Services' BCG Matrix preview shows where major service lines and facilities sit in the market — which are pulling in cash, which need investment, and which might be dragging performance down. Want the full picture with quadrant-by-quadrant placement, precise data, and actionable recommendations tailored to healthcare dynamics? Purchase the complete BCG Matrix for a Word report + Excel summary and get a ready-to-use strategic playbook to allocate capital, optimize portfolios, and move faster than competitors.
Stars

Leading behavioral health network
UHSs behavioral health network sits in the Stars quadrant with double-digit demand growth and a dominant share across 300+ facilities and roughly 22,000 licensed behavioral beds as of 2024. These inpatient psych units lead volumes and referrals, generating a material portion of UHSs ~12.5 billion revenue run-rate while still needing capital for staffing, digital intake platforms and ~1,000 new beds. They produce strong cash flow but reinvest heavily to defend leadership and convert growth into durable margin.
Regional acute care flagships
Regional acute care flagships anchor UHS with top market share in fast-growing metros; flagship service lines—cardiac, orthopedics, women’s/children’s—can scale rapidly but demand marketing, physician alignment and tech upgrades. Cash-in equals cash-out as operating capex and working capital rise; 2024 saw UHS-level flagship investments often in the $50–200 million range to lock share before market maturation.

Freestanding emergency departments in growth corridors
Freestanding emergency departments in UHS growth corridors show high visit growth, with local markets posting double-digit increases (12–18% year-over-year in many dense ZIP clusters) where UHS has presence density. Strong local brand recognition lifts volumes, yet sites require continuous outreach and active care-navigation to sustain throughput. Capital intensity remains elevated, with buildouts and equipment driving upfront costs often exceeding $10–15 million per site. Back them while growth stays steep and ROI timelines compress to 3–6 years.

Behavioral health specialty programs
Behavioral health specialty programs (adolescent, dual-diagnosis, trauma) are Stars for UHS: strong payer acceptance and persistent waitlists, with the U.S. behavioral health market estimated at about 220 billion USD in 2024 and youth mental-health demand up markedly since 2019; clinical staffing and outcomes tracking require ongoing spend, so scale now and standardize later to convert these into cash cows as markets normalize.
- High demand: persistent waitlists, strong payer mix
- Market size: ~220 billion USD (2024)
- Cost drivers: clinician hiring, EMR/outcomes analytics
- Strategy: scale footprint now, standardize protocols to drive margin later
Integrated psych–medical care pathways
Integrated psych–medical care pathways are Stars for Universal Health Services: co-located or tightly coordinated behavioral and medical services are winning referrals and payer contracts, with adoption rising to about 60% of U.S. primary care practices by 2024 (NCQA/industry surveys), though operational optimization lags—needs better data, care navigation, and payer alignment; worth investing to cement category leadership.
- Market position: rapid revenue growth potential
- Operational gaps: data, navigation, payer alignment
- Adoption 2024: ~60% primary care integration
- Strategic move: invest to lock referrals/contracts
Behavioral care boom: 300+ sites, ~22k beds, double-digit growth, big capex needs
UHS Stars: behavioral health, acute flagships, FSEDs and specialty psych programs drive double-digit growth and a material share of UHSs ~12.5B 2024 revenue run-rate, with behavioral network >300 facilities/~22,000 beds and US behavioral market ≈220B (2024). High cash flow but heavy reinvestment—capex needs: flagships $50–200M, FSEDs $10–15M, ~1,000 new beds planned.
| Segment | 2024 metric | Growth | Key capex |
|---|---|---|---|
| Behavioral health | 300+ sites, ~22,000 beds | double-digit | staffing, intake, ~1,000 beds |
| Flagships | part of ~$12.5B run-rate | high in metros | $50–200M |
| FSEDs | 12–18% local visits | double-digit | $10–15M/site |
What is included in the product
 Detailed Word Document
Concise BCG Matrix review of Universal Health Services highlighting Stars, Cash Cows, Question Marks, Dogs and strategic investment moves.

 Customizable Excel Spreadsheet
One-page UHS BCG Matrix highlighting units by quadrant, easing strategic decisions and resource pain points.
Cash Cows

Mature acute service lines
Mature acute service lines—general medicine, routine surgical, and med–surg beds—deliver steady volumes across UHS’s ~400 facilities in 2024, sustaining high local share and attractive margins. Low market growth drives modest promotion; emphasis is on throughput and reducing length-of-stay to protect revenue per bed. Management prioritizes efficiency and cost discipline to milk cash flows through incremental margin gains from operational improvements.
Established behavioral inpatient beds
Established behavioral inpatient beds represent stable units for Universal Health Services with consistently strong census and proven referral patterns, requiring minimal marketing while benefitting from refined operating playbooks. Geographic expansion is limited, so focus is on operations tuning—staffing, throughput, and payer mix—to sustain margins. These beds act as reliable cash generators that fund new strategic investments and higher-growth initiatives.

Payer contracting scale advantages
Payer contracting scale—backed by UHS’s network of approximately 350 facilities as of 2024—secures better negotiated rates and steadier cash flow versus smaller rivals. This is not a fast-growth lever but a durable moat that supports margin stability. UHS must maintain payer relationships and quality metrics to preserve leverage. Surplus cash from scale-funded operations can be redeployed to support high-potential Question Marks.

Diagnostic and outpatient ancillaries
Diagnostic and outpatient ancillaries (imaging, lab, therapy) around UHS major campuses show predictable demand and dense volume, supporting mid‑teens EBITDA margins (15–25%) in 2024 and steady cash generation. Margins benefit from scheduling efficiency and high throughput; typical outpatient imaging volumes rose ~4–6% year‑over‑year in 2024. Low capex (ancillary capex often <5% of system spend) yields steady returns; ongoing focus is optimizing utilization and turnaround times.
- Predictable demand: imaging, lab, therapy concentrated by campus
- Margins: mid‑teens EBITDA (15–25%) in 2024
- Volume growth: outpatient imaging +4–6% YoY (2024)
- Capex: low ancillary spend, <5% of system capex
- Priority: utilization and turnaround optimization
Revenue cycle and centralized procurement
Revenue cycle and centralized procurement are UHS cash cows: back-office scale reliably prints savings, supporting a stable contribution even as organic growth is flat; 2024 adjusted operating cash flow was about $1.1 billion, funding capex and M&A quietly. Continuous automation and denial management aim to compress days receivable and cut cost-to-collect, preserving margin and free cash.
- Back-office scale: consistent savings
- Growth: flat, contribution steady
- Ops 2024 cash flow: ~$1.1B
- Focus: automate, reduce denials
- Role: cash funds strategic priorities
Med-surg, behavioral & ancillaries fuel ~400, ≈$1.1B cash
Mature acute med–surg lines, behavioral inpatient beds, ancillaries and centralized revenue-cycle/procurement are UHS cash cows in 2024, yielding steady volumes across ~400 facilities, mid‑teens EBITDA (15–25%), outpatient imaging +4–6% YoY, low ancillary capex <5% of system spend, and system adjusted operating cash flow ≈$1.1B that funds growth.
| Metric | 2024 |
|---|---|
| Facilities | ~400 |
| EBITDA (ancillaries) | 15–25% |
| Imaging YoY | +4–6% |
| Ancillary capex | <5% of system |
| Adj. operating cash flow | ≈$1.1B |
Full Transparency, Always
Universal Health Services BCG Matrix
The file you're previewing here is the exact Universal Health Services BCG Matrix you'll receive after purchase—no watermarks, no placeholders, just the finished, fully formatted report. It’s crafted for clarity and decision-making, with market-backed positioning and clean visuals ready for presentations or internal planning. Buy once and download immediately; the document is editable, printable, and ready to share with stakeholders. No surprises—what you see is what you get.

Download Your Competitive Advantage
Universal Health Services' BCG Matrix preview shows where major service lines and facilities sit in the market — which are pulling in cash, which need investment, and which might be dragging performance down. Want the full picture with quadrant-by-quadrant placement, precise data, and actionable recommendations tailored to healthcare dynamics? Purchase the complete BCG Matrix for a Word report + Excel summary and get a ready-to-use strategic playbook to allocate capital, optimize portfolios, and move faster than competitors.
Stars
Leading behavioral health network
UHSs behavioral health network sits in the Stars quadrant with double-digit demand growth and a dominant share across 300+ facilities and roughly 22,000 licensed behavioral beds as of 2024. These inpatient psych units lead volumes and referrals, generating a material portion of UHSs ~12.5 billion revenue run-rate while still needing capital for staffing, digital intake platforms and ~1,000 new beds. They produce strong cash flow but reinvest heavily to defend leadership and convert growth into durable margin.
Regional acute care flagships
Regional acute care flagships anchor UHS with top market share in fast-growing metros; flagship service lines—cardiac, orthopedics, women’s/children’s—can scale rapidly but demand marketing, physician alignment and tech upgrades. Cash-in equals cash-out as operating capex and working capital rise; 2024 saw UHS-level flagship investments often in the $50–200 million range to lock share before market maturation.
Freestanding emergency departments in growth corridors
Freestanding emergency departments in UHS growth corridors show high visit growth, with local markets posting double-digit increases (12–18% year-over-year in many dense ZIP clusters) where UHS has presence density. Strong local brand recognition lifts volumes, yet sites require continuous outreach and active care-navigation to sustain throughput. Capital intensity remains elevated, with buildouts and equipment driving upfront costs often exceeding $10–15 million per site. Back them while growth stays steep and ROI timelines compress to 3–6 years.
Behavioral health specialty programs
Behavioral health specialty programs (adolescent, dual-diagnosis, trauma) are Stars for UHS: strong payer acceptance and persistent waitlists, with the U.S. behavioral health market estimated at about 220 billion USD in 2024 and youth mental-health demand up markedly since 2019; clinical staffing and outcomes tracking require ongoing spend, so scale now and standardize later to convert these into cash cows as markets normalize.
- High demand: persistent waitlists, strong payer mix
- Market size: ~220 billion USD (2024)
- Cost drivers: clinician hiring, EMR/outcomes analytics
- Strategy: scale footprint now, standardize protocols to drive margin later
Integrated psych–medical care pathways
Integrated psych–medical care pathways are Stars for Universal Health Services: co-located or tightly coordinated behavioral and medical services are winning referrals and payer contracts, with adoption rising to about 60% of U.S. primary care practices by 2024 (NCQA/industry surveys), though operational optimization lags—needs better data, care navigation, and payer alignment; worth investing to cement category leadership.
- Market position: rapid revenue growth potential
- Operational gaps: data, navigation, payer alignment
- Adoption 2024: ~60% primary care integration
- Strategic move: invest to lock referrals/contracts
Behavioral care boom: 300+ sites, ~22k beds, double-digit growth, big capex needs
UHS Stars: behavioral health, acute flagships, FSEDs and specialty psych programs drive double-digit growth and a material share of UHSs ~12.5B 2024 revenue run-rate, with behavioral network >300 facilities/~22,000 beds and US behavioral market ≈220B (2024). High cash flow but heavy reinvestment—capex needs: flagships $50–200M, FSEDs $10–15M, ~1,000 new beds planned.
| Segment | 2024 metric | Growth | Key capex |
|---|---|---|---|
| Behavioral health | 300+ sites, ~22,000 beds | double-digit | staffing, intake, ~1,000 beds |
| Flagships | part of ~$12.5B run-rate | high in metros | $50–200M |
| FSEDs | 12–18% local visits | double-digit | $10–15M/site |
What is included in the product
Detailed Word Document
Concise BCG Matrix review of Universal Health Services highlighting Stars, Cash Cows, Question Marks, Dogs and strategic investment moves.
Customizable Excel Spreadsheet
One-page UHS BCG Matrix highlighting units by quadrant, easing strategic decisions and resource pain points.
Cash Cows
Mature acute service lines
Mature acute service lines—general medicine, routine surgical, and med–surg beds—deliver steady volumes across UHS’s ~400 facilities in 2024, sustaining high local share and attractive margins. Low market growth drives modest promotion; emphasis is on throughput and reducing length-of-stay to protect revenue per bed. Management prioritizes efficiency and cost discipline to milk cash flows through incremental margin gains from operational improvements.
Established behavioral inpatient beds
Established behavioral inpatient beds represent stable units for Universal Health Services with consistently strong census and proven referral patterns, requiring minimal marketing while benefitting from refined operating playbooks. Geographic expansion is limited, so focus is on operations tuning—staffing, throughput, and payer mix—to sustain margins. These beds act as reliable cash generators that fund new strategic investments and higher-growth initiatives.
Payer contracting scale advantages
Payer contracting scale—backed by UHS’s network of approximately 350 facilities as of 2024—secures better negotiated rates and steadier cash flow versus smaller rivals. This is not a fast-growth lever but a durable moat that supports margin stability. UHS must maintain payer relationships and quality metrics to preserve leverage. Surplus cash from scale-funded operations can be redeployed to support high-potential Question Marks.
Diagnostic and outpatient ancillaries
Diagnostic and outpatient ancillaries (imaging, lab, therapy) around UHS major campuses show predictable demand and dense volume, supporting mid‑teens EBITDA margins (15–25%) in 2024 and steady cash generation. Margins benefit from scheduling efficiency and high throughput; typical outpatient imaging volumes rose ~4–6% year‑over‑year in 2024. Low capex (ancillary capex often <5% of system spend) yields steady returns; ongoing focus is optimizing utilization and turnaround times.
- Predictable demand: imaging, lab, therapy concentrated by campus
- Margins: mid‑teens EBITDA (15–25%) in 2024
- Volume growth: outpatient imaging +4–6% YoY (2024)
- Capex: low ancillary spend, <5% of system capex
- Priority: utilization and turnaround optimization
Revenue cycle and centralized procurement
Revenue cycle and centralized procurement are UHS cash cows: back-office scale reliably prints savings, supporting a stable contribution even as organic growth is flat; 2024 adjusted operating cash flow was about $1.1 billion, funding capex and M&A quietly. Continuous automation and denial management aim to compress days receivable and cut cost-to-collect, preserving margin and free cash.
- Back-office scale: consistent savings
- Growth: flat, contribution steady
- Ops 2024 cash flow: ~$1.1B
- Focus: automate, reduce denials
- Role: cash funds strategic priorities
Med-surg, behavioral & ancillaries fuel ~400, ≈$1.1B cash
Mature acute med–surg lines, behavioral inpatient beds, ancillaries and centralized revenue-cycle/procurement are UHS cash cows in 2024, yielding steady volumes across ~400 facilities, mid‑teens EBITDA (15–25%), outpatient imaging +4–6% YoY, low ancillary capex <5% of system spend, and system adjusted operating cash flow ≈$1.1B that funds growth.
| Metric | 2024 |
|---|---|
| Facilities | ~400 |
| EBITDA (ancillaries) | 15–25% |
| Imaging YoY | +4–6% |
| Ancillary capex | <5% of system |
| Adj. operating cash flow | ≈$1.1B |
Full Transparency, Always
Universal Health Services BCG Matrix
The file you're previewing here is the exact Universal Health Services BCG Matrix you'll receive after purchase—no watermarks, no placeholders, just the finished, fully formatted report. It’s crafted for clarity and decision-making, with market-backed positioning and clean visuals ready for presentations or internal planning. Buy once and download immediately; the document is editable, printable, and ready to share with stakeholders. No surprises—what you see is what you get.
Description
Download Your Competitive Advantage
Universal Health Services' BCG Matrix preview shows where major service lines and facilities sit in the market — which are pulling in cash, which need investment, and which might be dragging performance down. Want the full picture with quadrant-by-quadrant placement, precise data, and actionable recommendations tailored to healthcare dynamics? Purchase the complete BCG Matrix for a Word report + Excel summary and get a ready-to-use strategic playbook to allocate capital, optimize portfolios, and move faster than competitors.
Stars
Leading behavioral health network
UHSs behavioral health network sits in the Stars quadrant with double-digit demand growth and a dominant share across 300+ facilities and roughly 22,000 licensed behavioral beds as of 2024. These inpatient psych units lead volumes and referrals, generating a material portion of UHSs ~12.5 billion revenue run-rate while still needing capital for staffing, digital intake platforms and ~1,000 new beds. They produce strong cash flow but reinvest heavily to defend leadership and convert growth into durable margin.
Regional acute care flagships
Regional acute care flagships anchor UHS with top market share in fast-growing metros; flagship service lines—cardiac, orthopedics, women’s/children’s—can scale rapidly but demand marketing, physician alignment and tech upgrades. Cash-in equals cash-out as operating capex and working capital rise; 2024 saw UHS-level flagship investments often in the $50–200 million range to lock share before market maturation.
Freestanding emergency departments in growth corridors
Freestanding emergency departments in UHS growth corridors show high visit growth, with local markets posting double-digit increases (12–18% year-over-year in many dense ZIP clusters) where UHS has presence density. Strong local brand recognition lifts volumes, yet sites require continuous outreach and active care-navigation to sustain throughput. Capital intensity remains elevated, with buildouts and equipment driving upfront costs often exceeding $10–15 million per site. Back them while growth stays steep and ROI timelines compress to 3–6 years.
Behavioral health specialty programs
Behavioral health specialty programs (adolescent, dual-diagnosis, trauma) are Stars for UHS: strong payer acceptance and persistent waitlists, with the U.S. behavioral health market estimated at about 220 billion USD in 2024 and youth mental-health demand up markedly since 2019; clinical staffing and outcomes tracking require ongoing spend, so scale now and standardize later to convert these into cash cows as markets normalize.
- High demand: persistent waitlists, strong payer mix
- Market size: ~220 billion USD (2024)
- Cost drivers: clinician hiring, EMR/outcomes analytics
- Strategy: scale footprint now, standardize protocols to drive margin later
Integrated psych–medical care pathways
Integrated psych–medical care pathways are Stars for Universal Health Services: co-located or tightly coordinated behavioral and medical services are winning referrals and payer contracts, with adoption rising to about 60% of U.S. primary care practices by 2024 (NCQA/industry surveys), though operational optimization lags—needs better data, care navigation, and payer alignment; worth investing to cement category leadership.
- Market position: rapid revenue growth potential
- Operational gaps: data, navigation, payer alignment
- Adoption 2024: ~60% primary care integration
- Strategic move: invest to lock referrals/contracts
Behavioral care boom: 300+ sites, ~22k beds, double-digit growth, big capex needs
UHS Stars: behavioral health, acute flagships, FSEDs and specialty psych programs drive double-digit growth and a material share of UHSs ~12.5B 2024 revenue run-rate, with behavioral network >300 facilities/~22,000 beds and US behavioral market ≈220B (2024). High cash flow but heavy reinvestment—capex needs: flagships $50–200M, FSEDs $10–15M, ~1,000 new beds planned.
| Segment | 2024 metric | Growth | Key capex |
|---|---|---|---|
| Behavioral health | 300+ sites, ~22,000 beds | double-digit | staffing, intake, ~1,000 beds |
| Flagships | part of ~$12.5B run-rate | high in metros | $50–200M |
| FSEDs | 12–18% local visits | double-digit | $10–15M/site |
What is included in the product
Detailed Word Document
Concise BCG Matrix review of Universal Health Services highlighting Stars, Cash Cows, Question Marks, Dogs and strategic investment moves.
Customizable Excel Spreadsheet
One-page UHS BCG Matrix highlighting units by quadrant, easing strategic decisions and resource pain points.
Cash Cows
Mature acute service lines
Mature acute service lines—general medicine, routine surgical, and med–surg beds—deliver steady volumes across UHS’s ~400 facilities in 2024, sustaining high local share and attractive margins. Low market growth drives modest promotion; emphasis is on throughput and reducing length-of-stay to protect revenue per bed. Management prioritizes efficiency and cost discipline to milk cash flows through incremental margin gains from operational improvements.
Established behavioral inpatient beds
Established behavioral inpatient beds represent stable units for Universal Health Services with consistently strong census and proven referral patterns, requiring minimal marketing while benefitting from refined operating playbooks. Geographic expansion is limited, so focus is on operations tuning—staffing, throughput, and payer mix—to sustain margins. These beds act as reliable cash generators that fund new strategic investments and higher-growth initiatives.
Payer contracting scale advantages
Payer contracting scale—backed by UHS’s network of approximately 350 facilities as of 2024—secures better negotiated rates and steadier cash flow versus smaller rivals. This is not a fast-growth lever but a durable moat that supports margin stability. UHS must maintain payer relationships and quality metrics to preserve leverage. Surplus cash from scale-funded operations can be redeployed to support high-potential Question Marks.
Diagnostic and outpatient ancillaries
Diagnostic and outpatient ancillaries (imaging, lab, therapy) around UHS major campuses show predictable demand and dense volume, supporting mid‑teens EBITDA margins (15–25%) in 2024 and steady cash generation. Margins benefit from scheduling efficiency and high throughput; typical outpatient imaging volumes rose ~4–6% year‑over‑year in 2024. Low capex (ancillary capex often <5% of system spend) yields steady returns; ongoing focus is optimizing utilization and turnaround times.
- Predictable demand: imaging, lab, therapy concentrated by campus
- Margins: mid‑teens EBITDA (15–25%) in 2024
- Volume growth: outpatient imaging +4–6% YoY (2024)
- Capex: low ancillary spend, <5% of system capex
- Priority: utilization and turnaround optimization
Revenue cycle and centralized procurement
Revenue cycle and centralized procurement are UHS cash cows: back-office scale reliably prints savings, supporting a stable contribution even as organic growth is flat; 2024 adjusted operating cash flow was about $1.1 billion, funding capex and M&A quietly. Continuous automation and denial management aim to compress days receivable and cut cost-to-collect, preserving margin and free cash.
- Back-office scale: consistent savings
- Growth: flat, contribution steady
- Ops 2024 cash flow: ~$1.1B
- Focus: automate, reduce denials
- Role: cash funds strategic priorities
Med-surg, behavioral & ancillaries fuel ~400, ≈$1.1B cash
Mature acute med–surg lines, behavioral inpatient beds, ancillaries and centralized revenue-cycle/procurement are UHS cash cows in 2024, yielding steady volumes across ~400 facilities, mid‑teens EBITDA (15–25%), outpatient imaging +4–6% YoY, low ancillary capex <5% of system spend, and system adjusted operating cash flow ≈$1.1B that funds growth.
| Metric | 2024 |
|---|---|
| Facilities | ~400 |
| EBITDA (ancillaries) | 15–25% |
| Imaging YoY | +4–6% |
| Ancillary capex | <5% of system |
| Adj. operating cash flow | ≈$1.1B |
Full Transparency, Always
Universal Health Services BCG Matrix
The file you're previewing here is the exact Universal Health Services BCG Matrix you'll receive after purchase—no watermarks, no placeholders, just the finished, fully formatted report. It’s crafted for clarity and decision-making, with market-backed positioning and clean visuals ready for presentations or internal planning. Buy once and download immediately; the document is editable, printable, and ready to share with stakeholders. No surprises—what you see is what you get.











