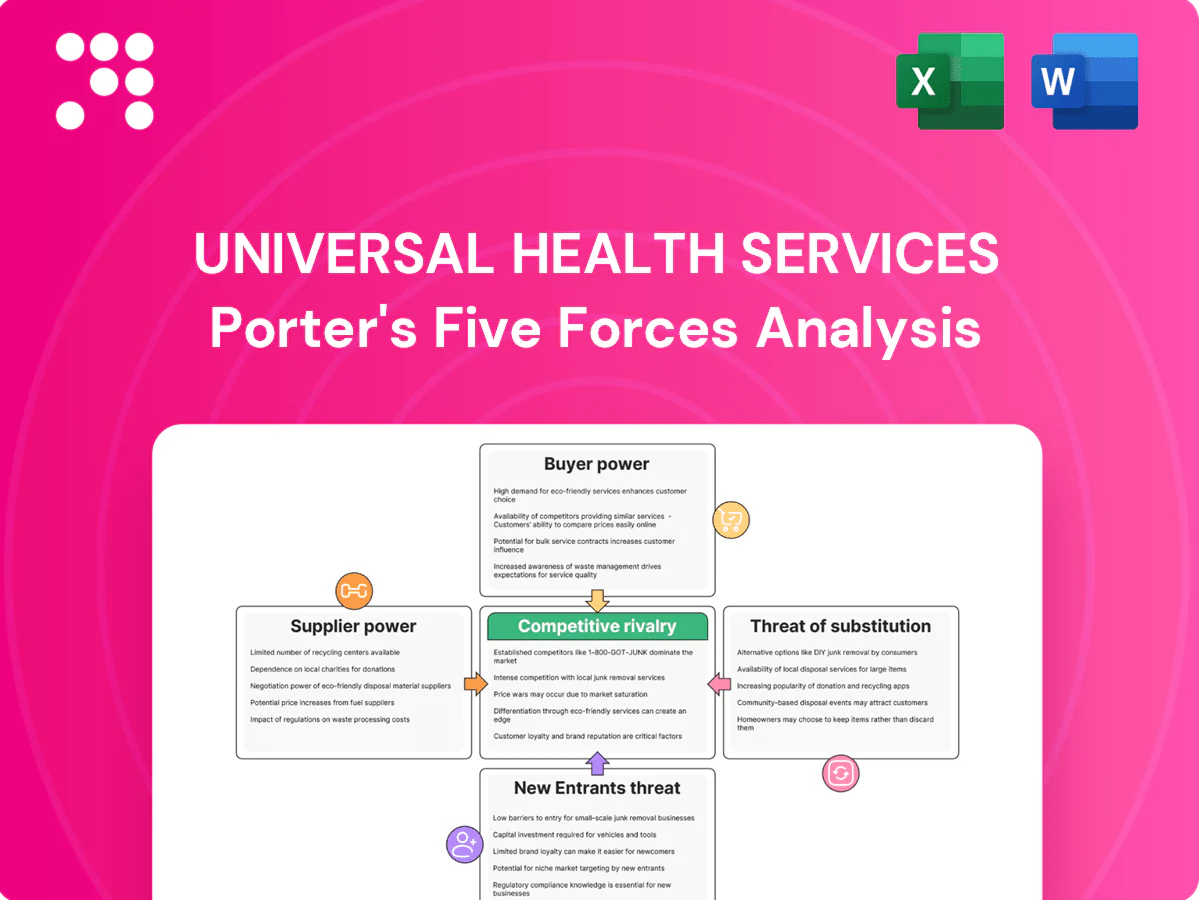
Universal Health Services Porter's Five Forces Analysis

Elevate Your Analysis with the Complete Porter's Five Forces Analysis
Universal Health Services faces intense payer negotiation, regulatory scrutiny, and scale-driven advantages that shape profitability and growth; competitive threats include consolidation and alternative care models. This snapshot highlights key pressures and strategic levers. Unlock the full Porter's Five Forces Analysis for force-by-force ratings, visuals, and actionable insights to inform investment or strategic decisions.
Suppliers Bargaining Power

Specialized drug & device vendors concentrated
High-end implants, branded psych meds, and imaging equipment come from a few dominant manufacturers—top three orthopedic implant firms hold roughly 60% of the US implant market while GE, Siemens Healthineers and Philips account for about 70% of global imaging systems, boosting supplier leverage. Limited therapeutic substitutes and switching costs increase dependence. Hospital GPO participation exceeds 90%, yet specialty items often sit outside GPO scope. UHS must balance standardization with clinical efficacy demands.
Clinician scarcity raises wage pressure
Nurse, psychiatrist, and therapist shortages boost labor costs and supplier leverage; AAMC projects a 54,100–139,000 physician shortfall by 2033 while BLS reports 2023 median RN pay of $77,600 and NSI found nurse turnover at 20.7% in 2023. Reliance on staffing agencies and travelers raises spot-rate premiums during surges, so retention and training investments are essential as local labor tightness directly compresses margins.

IT, EHR, and cybersecurity vendors lock-in
EHR platforms are highly sticky—96% of US hospitals use certified EHRs (ONC 2023) and Epic plus Cerner together account for roughly half the acute-care market—making contract switches risky, costly, and operationally disruptive. Vendors commonly impose annual price escalators and module fees; UHS counters with multi-year agreements and interoperability initiatives to limit supplier leverage.

Facility services and utilities are localized
Facility services like linen, food and utilities are often sourced regionally for Universal Health Services, creating few local alternatives; 2024 BLS data showed U.S. food-at-home CPI up ~3.4% y/y and EIA reported retail electricity price rises near 4% year-over-year, magnifying supplier leverage. Outages or vendor disputes can halt operations quickly; dual-sourcing and strict SLAs cut risk but raise coordination and contracting costs.
- Limited regional suppliers increase dependency
- 2024 food CPI ~3.4% and electricity ~4% boost supplier power
- Outages/vendor disputes = rapid operational risk
- Dual-sourcing + SLAs reduce exposure but add costs
GPOs moderate, but don’t eliminate power
GPO participation drives standard terms and reported median savings of about 12% across hospitals in 2024, with roughly 95% of U.S. hospitals using GPO contracts. Specialty and physician-preferred items—≈35% of supply spend—dilute GPO leverage. Vendors increasingly offset discounts via fees and rebate complexity, while UHS uses its scale to secure carve-outs and benchmark pricing.
- 95% hospital GPO participation (2024)
- ~12% median GPO savings (2024)
- Specialty items ≈35% of spend
- Vendors use fees/rebates to recoup discounts
Supplier concentration and sticky EHRs raise supplier power amid labor gaps
Supplier concentration (implants top3 ~60%; imaging ~70%) and sticky tech (Epic/Cerner ~50%) increase supplier power. Labor shortages (AAMC 54k–139k physician gap; RN median pay $77.6k; turnover 20.7%) and regional vendors add leverage. GPOs (~95% participation; ~12% median savings) are offset by ~35% specialty spend.
| Metric | Value |
|---|---|
| Implants (top3) | ~60% |
| Imaging vendors | ~70% |
| GPO participation | ~95% |
| Specialty spend | ~35% |
What is included in the product
 Detailed Word Document
Tailored Porter’s Five Forces analysis for Universal Health Services that uncovers key drivers of competitive rivalry, supplier and buyer power, threat of new entrants and substitutes, and identifies disruptive forces and regulatory risks shaping profitability and market position.

 Customizable Excel Spreadsheet
A concise one-sheet Porter's Five Forces for Universal Health Services—instantly visualize competitive pressures with a radar chart, customize inputs for regulatory or reimbursement scenarios, and drop directly into pitch decks or dashboards without complex code.
Customers Bargaining Power

Large payers exert rate leverage
National insurers and managed care organizations push aggressive rate negotiations and utilization controls, leveraging narrow networks and steerage to redirect volumes. Top four payers account for roughly 60% of the commercial market, tilting contract terms despite UHS’s regional footprint. Growing value-based arrangements—about 40% of Medicare payments tied to alternative models—shift pricing toward performance and add downside risk to UHS revenue.
Government payers set prices
Medicare and Medicaid often account for over 50% of volumes in behavioral health markets, giving government payers strong price-setting power. Administered rates limit pricing flexibility and cap margin expansion for operators. Policy changes can produce immediate revenue shifts when reimbursement rules or coverage determinations change. Tight cost control and coding accuracy become crucial levers to protect revenue and compliance.

Employers and PBMs influence benefits
Self-funded employers—covering about 67% of workers in employer plans—shape networks, prior authorizations and site-of-care redirection, shifting admissions to lower-cost settings. PBM formularies, dominated by the three largest PBMs that manage roughly 78% of claims, direct behavioral and acute drug choices. Price-transparency tools increase comparison shopping for shoppable services. UHS must prove quality and total-cost value to retain network inclusion.

Patients have rising transparency & options
Patients increasingly use price transparency rules (CMS rules and the No Surprises Act remain active in 2024) and digital navigation tools, raising sensitivity to out-of-pocket costs; retail clinics and urgent care provide lower-cost, convenient alternatives for low-acuity care; reputation, outcomes and clear financial assistance policies strongly shape choice in competitive metros.
- price transparency: CMS rules + No Surprises Act (2024)
- alternatives: retail clinics / urgent care cheaper for low-acuity
- drivers: reputation, outcomes, financial assistance access
Referral sources steer volumes
Physicians, payers and community agencies remain primary sources steering behavioral and acute admissions, and as of 2024 UHS operates over 400 facilities across its network to capture that flow. Integrated provider networks and employed clinicians help reduce leakage to competitors, while telehealth platforms are increasingly shaping referral pathways. UHS continues to invest in access, payer partnerships and throughput to remain top-of-mind for referral sources.
- Physicians/payers/community agencies: primary referral drivers
- Integrated networks/employed clinicians: lower leakage
- Telehealth: growing referral control
- UHS scale: 400+ facilities (2024); investment in access/throughput
Payers (~60%) and PBMs (78%) dominate pricing
National payers (top 4 ~60% commercial) and government programs (Medicare/Medicaid >50% behavioral volumes) exert strong price leverage; value-based models (~40% Medicare tied to alternatives) increase downside risk. Self-funded employers (≈67% of workers) and PBMs (3 largest ≈78% claims) steer networks and drug choices. Patients and retail alternatives raise price sensitivity; UHS scale (400+ facilities) mitigates leakage.
| Metric | 2024 |
|---|---|
| Top-4 payers share | ~60% |
| Medicare alt models | ~40% |
| Behavioral payers gov't share | >50% |
| Self-funded employees | ~67% |
| Top-3 PBM claims | ~78% |
| UHS facilities | 400+ |
Preview Before You Purchase
Universal Health Services Porter's Five Forces Analysis
This Porter’s Five Forces analysis of Universal Health Services provides a comprehensive evaluation of competitive rivalry, threat of new entrants, bargaining power of suppliers and buyers, and substitution risks, with actionable insights for strategic decision-making. The preview shown is the exact document you'll receive immediately after purchase—fully formatted and ready for download. No placeholders, no samples, just the complete analysis file.

Elevate Your Analysis with the Complete Porter's Five Forces Analysis
Universal Health Services faces intense payer negotiation, regulatory scrutiny, and scale-driven advantages that shape profitability and growth; competitive threats include consolidation and alternative care models. This snapshot highlights key pressures and strategic levers. Unlock the full Porter's Five Forces Analysis for force-by-force ratings, visuals, and actionable insights to inform investment or strategic decisions.
Suppliers Bargaining Power
Specialized drug & device vendors concentrated
High-end implants, branded psych meds, and imaging equipment come from a few dominant manufacturers—top three orthopedic implant firms hold roughly 60% of the US implant market while GE, Siemens Healthineers and Philips account for about 70% of global imaging systems, boosting supplier leverage. Limited therapeutic substitutes and switching costs increase dependence. Hospital GPO participation exceeds 90%, yet specialty items often sit outside GPO scope. UHS must balance standardization with clinical efficacy demands.
Clinician scarcity raises wage pressure
Nurse, psychiatrist, and therapist shortages boost labor costs and supplier leverage; AAMC projects a 54,100–139,000 physician shortfall by 2033 while BLS reports 2023 median RN pay of $77,600 and NSI found nurse turnover at 20.7% in 2023. Reliance on staffing agencies and travelers raises spot-rate premiums during surges, so retention and training investments are essential as local labor tightness directly compresses margins.
IT, EHR, and cybersecurity vendors lock-in
EHR platforms are highly sticky—96% of US hospitals use certified EHRs (ONC 2023) and Epic plus Cerner together account for roughly half the acute-care market—making contract switches risky, costly, and operationally disruptive. Vendors commonly impose annual price escalators and module fees; UHS counters with multi-year agreements and interoperability initiatives to limit supplier leverage.
Facility services and utilities are localized
Facility services like linen, food and utilities are often sourced regionally for Universal Health Services, creating few local alternatives; 2024 BLS data showed U.S. food-at-home CPI up ~3.4% y/y and EIA reported retail electricity price rises near 4% year-over-year, magnifying supplier leverage. Outages or vendor disputes can halt operations quickly; dual-sourcing and strict SLAs cut risk but raise coordination and contracting costs.
- Limited regional suppliers increase dependency
- 2024 food CPI ~3.4% and electricity ~4% boost supplier power
- Outages/vendor disputes = rapid operational risk
- Dual-sourcing + SLAs reduce exposure but add costs
GPOs moderate, but don’t eliminate power
GPO participation drives standard terms and reported median savings of about 12% across hospitals in 2024, with roughly 95% of U.S. hospitals using GPO contracts. Specialty and physician-preferred items—≈35% of supply spend—dilute GPO leverage. Vendors increasingly offset discounts via fees and rebate complexity, while UHS uses its scale to secure carve-outs and benchmark pricing.
- 95% hospital GPO participation (2024)
- ~12% median GPO savings (2024)
- Specialty items ≈35% of spend
- Vendors use fees/rebates to recoup discounts
Supplier concentration and sticky EHRs raise supplier power amid labor gaps
Supplier concentration (implants top3 ~60%; imaging ~70%) and sticky tech (Epic/Cerner ~50%) increase supplier power. Labor shortages (AAMC 54k–139k physician gap; RN median pay $77.6k; turnover 20.7%) and regional vendors add leverage. GPOs (~95% participation; ~12% median savings) are offset by ~35% specialty spend.
| Metric | Value |
|---|---|
| Implants (top3) | ~60% |
| Imaging vendors | ~70% |
| GPO participation | ~95% |
| Specialty spend | ~35% |
What is included in the product
Detailed Word Document
Tailored Porter’s Five Forces analysis for Universal Health Services that uncovers key drivers of competitive rivalry, supplier and buyer power, threat of new entrants and substitutes, and identifies disruptive forces and regulatory risks shaping profitability and market position.
Customizable Excel Spreadsheet
A concise one-sheet Porter's Five Forces for Universal Health Services—instantly visualize competitive pressures with a radar chart, customize inputs for regulatory or reimbursement scenarios, and drop directly into pitch decks or dashboards without complex code.
Customers Bargaining Power
Large payers exert rate leverage
National insurers and managed care organizations push aggressive rate negotiations and utilization controls, leveraging narrow networks and steerage to redirect volumes. Top four payers account for roughly 60% of the commercial market, tilting contract terms despite UHS’s regional footprint. Growing value-based arrangements—about 40% of Medicare payments tied to alternative models—shift pricing toward performance and add downside risk to UHS revenue.
Government payers set prices
Medicare and Medicaid often account for over 50% of volumes in behavioral health markets, giving government payers strong price-setting power. Administered rates limit pricing flexibility and cap margin expansion for operators. Policy changes can produce immediate revenue shifts when reimbursement rules or coverage determinations change. Tight cost control and coding accuracy become crucial levers to protect revenue and compliance.
Employers and PBMs influence benefits
Self-funded employers—covering about 67% of workers in employer plans—shape networks, prior authorizations and site-of-care redirection, shifting admissions to lower-cost settings. PBM formularies, dominated by the three largest PBMs that manage roughly 78% of claims, direct behavioral and acute drug choices. Price-transparency tools increase comparison shopping for shoppable services. UHS must prove quality and total-cost value to retain network inclusion.
Patients have rising transparency & options
Patients increasingly use price transparency rules (CMS rules and the No Surprises Act remain active in 2024) and digital navigation tools, raising sensitivity to out-of-pocket costs; retail clinics and urgent care provide lower-cost, convenient alternatives for low-acuity care; reputation, outcomes and clear financial assistance policies strongly shape choice in competitive metros.
- price transparency: CMS rules + No Surprises Act (2024)
- alternatives: retail clinics / urgent care cheaper for low-acuity
- drivers: reputation, outcomes, financial assistance access
Referral sources steer volumes
Physicians, payers and community agencies remain primary sources steering behavioral and acute admissions, and as of 2024 UHS operates over 400 facilities across its network to capture that flow. Integrated provider networks and employed clinicians help reduce leakage to competitors, while telehealth platforms are increasingly shaping referral pathways. UHS continues to invest in access, payer partnerships and throughput to remain top-of-mind for referral sources.
- Physicians/payers/community agencies: primary referral drivers
- Integrated networks/employed clinicians: lower leakage
- Telehealth: growing referral control
- UHS scale: 400+ facilities (2024); investment in access/throughput
Payers (~60%) and PBMs (78%) dominate pricing
National payers (top 4 ~60% commercial) and government programs (Medicare/Medicaid >50% behavioral volumes) exert strong price leverage; value-based models (~40% Medicare tied to alternatives) increase downside risk. Self-funded employers (≈67% of workers) and PBMs (3 largest ≈78% claims) steer networks and drug choices. Patients and retail alternatives raise price sensitivity; UHS scale (400+ facilities) mitigates leakage.
| Metric | 2024 |
|---|---|
| Top-4 payers share | ~60% |
| Medicare alt models | ~40% |
| Behavioral payers gov't share | >50% |
| Self-funded employees | ~67% |
| Top-3 PBM claims | ~78% |
| UHS facilities | 400+ |
Preview Before You Purchase
Universal Health Services Porter's Five Forces Analysis
This Porter’s Five Forces analysis of Universal Health Services provides a comprehensive evaluation of competitive rivalry, threat of new entrants, bargaining power of suppliers and buyers, and substitution risks, with actionable insights for strategic decision-making. The preview shown is the exact document you'll receive immediately after purchase—fully formatted and ready for download. No placeholders, no samples, just the complete analysis file.
Description
Elevate Your Analysis with the Complete Porter's Five Forces Analysis
Universal Health Services faces intense payer negotiation, regulatory scrutiny, and scale-driven advantages that shape profitability and growth; competitive threats include consolidation and alternative care models. This snapshot highlights key pressures and strategic levers. Unlock the full Porter's Five Forces Analysis for force-by-force ratings, visuals, and actionable insights to inform investment or strategic decisions.
Suppliers Bargaining Power
Specialized drug & device vendors concentrated
High-end implants, branded psych meds, and imaging equipment come from a few dominant manufacturers—top three orthopedic implant firms hold roughly 60% of the US implant market while GE, Siemens Healthineers and Philips account for about 70% of global imaging systems, boosting supplier leverage. Limited therapeutic substitutes and switching costs increase dependence. Hospital GPO participation exceeds 90%, yet specialty items often sit outside GPO scope. UHS must balance standardization with clinical efficacy demands.
Clinician scarcity raises wage pressure
Nurse, psychiatrist, and therapist shortages boost labor costs and supplier leverage; AAMC projects a 54,100–139,000 physician shortfall by 2033 while BLS reports 2023 median RN pay of $77,600 and NSI found nurse turnover at 20.7% in 2023. Reliance on staffing agencies and travelers raises spot-rate premiums during surges, so retention and training investments are essential as local labor tightness directly compresses margins.
IT, EHR, and cybersecurity vendors lock-in
EHR platforms are highly sticky—96% of US hospitals use certified EHRs (ONC 2023) and Epic plus Cerner together account for roughly half the acute-care market—making contract switches risky, costly, and operationally disruptive. Vendors commonly impose annual price escalators and module fees; UHS counters with multi-year agreements and interoperability initiatives to limit supplier leverage.
Facility services and utilities are localized
Facility services like linen, food and utilities are often sourced regionally for Universal Health Services, creating few local alternatives; 2024 BLS data showed U.S. food-at-home CPI up ~3.4% y/y and EIA reported retail electricity price rises near 4% year-over-year, magnifying supplier leverage. Outages or vendor disputes can halt operations quickly; dual-sourcing and strict SLAs cut risk but raise coordination and contracting costs.
- Limited regional suppliers increase dependency
- 2024 food CPI ~3.4% and electricity ~4% boost supplier power
- Outages/vendor disputes = rapid operational risk
- Dual-sourcing + SLAs reduce exposure but add costs
GPOs moderate, but don’t eliminate power
GPO participation drives standard terms and reported median savings of about 12% across hospitals in 2024, with roughly 95% of U.S. hospitals using GPO contracts. Specialty and physician-preferred items—≈35% of supply spend—dilute GPO leverage. Vendors increasingly offset discounts via fees and rebate complexity, while UHS uses its scale to secure carve-outs and benchmark pricing.
- 95% hospital GPO participation (2024)
- ~12% median GPO savings (2024)
- Specialty items ≈35% of spend
- Vendors use fees/rebates to recoup discounts
Supplier concentration and sticky EHRs raise supplier power amid labor gaps
Supplier concentration (implants top3 ~60%; imaging ~70%) and sticky tech (Epic/Cerner ~50%) increase supplier power. Labor shortages (AAMC 54k–139k physician gap; RN median pay $77.6k; turnover 20.7%) and regional vendors add leverage. GPOs (~95% participation; ~12% median savings) are offset by ~35% specialty spend.
| Metric | Value |
|---|---|
| Implants (top3) | ~60% |
| Imaging vendors | ~70% |
| GPO participation | ~95% |
| Specialty spend | ~35% |
What is included in the product
Detailed Word Document
Tailored Porter’s Five Forces analysis for Universal Health Services that uncovers key drivers of competitive rivalry, supplier and buyer power, threat of new entrants and substitutes, and identifies disruptive forces and regulatory risks shaping profitability and market position.
Customizable Excel Spreadsheet
A concise one-sheet Porter's Five Forces for Universal Health Services—instantly visualize competitive pressures with a radar chart, customize inputs for regulatory or reimbursement scenarios, and drop directly into pitch decks or dashboards without complex code.
Customers Bargaining Power
Large payers exert rate leverage
National insurers and managed care organizations push aggressive rate negotiations and utilization controls, leveraging narrow networks and steerage to redirect volumes. Top four payers account for roughly 60% of the commercial market, tilting contract terms despite UHS’s regional footprint. Growing value-based arrangements—about 40% of Medicare payments tied to alternative models—shift pricing toward performance and add downside risk to UHS revenue.
Government payers set prices
Medicare and Medicaid often account for over 50% of volumes in behavioral health markets, giving government payers strong price-setting power. Administered rates limit pricing flexibility and cap margin expansion for operators. Policy changes can produce immediate revenue shifts when reimbursement rules or coverage determinations change. Tight cost control and coding accuracy become crucial levers to protect revenue and compliance.
Employers and PBMs influence benefits
Self-funded employers—covering about 67% of workers in employer plans—shape networks, prior authorizations and site-of-care redirection, shifting admissions to lower-cost settings. PBM formularies, dominated by the three largest PBMs that manage roughly 78% of claims, direct behavioral and acute drug choices. Price-transparency tools increase comparison shopping for shoppable services. UHS must prove quality and total-cost value to retain network inclusion.
Patients have rising transparency & options
Patients increasingly use price transparency rules (CMS rules and the No Surprises Act remain active in 2024) and digital navigation tools, raising sensitivity to out-of-pocket costs; retail clinics and urgent care provide lower-cost, convenient alternatives for low-acuity care; reputation, outcomes and clear financial assistance policies strongly shape choice in competitive metros.
- price transparency: CMS rules + No Surprises Act (2024)
- alternatives: retail clinics / urgent care cheaper for low-acuity
- drivers: reputation, outcomes, financial assistance access
Referral sources steer volumes
Physicians, payers and community agencies remain primary sources steering behavioral and acute admissions, and as of 2024 UHS operates over 400 facilities across its network to capture that flow. Integrated provider networks and employed clinicians help reduce leakage to competitors, while telehealth platforms are increasingly shaping referral pathways. UHS continues to invest in access, payer partnerships and throughput to remain top-of-mind for referral sources.
- Physicians/payers/community agencies: primary referral drivers
- Integrated networks/employed clinicians: lower leakage
- Telehealth: growing referral control
- UHS scale: 400+ facilities (2024); investment in access/throughput
Payers (~60%) and PBMs (78%) dominate pricing
National payers (top 4 ~60% commercial) and government programs (Medicare/Medicaid >50% behavioral volumes) exert strong price leverage; value-based models (~40% Medicare tied to alternatives) increase downside risk. Self-funded employers (≈67% of workers) and PBMs (3 largest ≈78% claims) steer networks and drug choices. Patients and retail alternatives raise price sensitivity; UHS scale (400+ facilities) mitigates leakage.
| Metric | 2024 |
|---|---|
| Top-4 payers share | ~60% |
| Medicare alt models | ~40% |
| Behavioral payers gov't share | >50% |
| Self-funded employees | ~67% |
| Top-3 PBM claims | ~78% |
| UHS facilities | 400+ |
Preview Before You Purchase
Universal Health Services Porter's Five Forces Analysis
This Porter’s Five Forces analysis of Universal Health Services provides a comprehensive evaluation of competitive rivalry, threat of new entrants, bargaining power of suppliers and buyers, and substitution risks, with actionable insights for strategic decision-making. The preview shown is the exact document you'll receive immediately after purchase—fully formatted and ready for download. No placeholders, no samples, just the complete analysis file.











