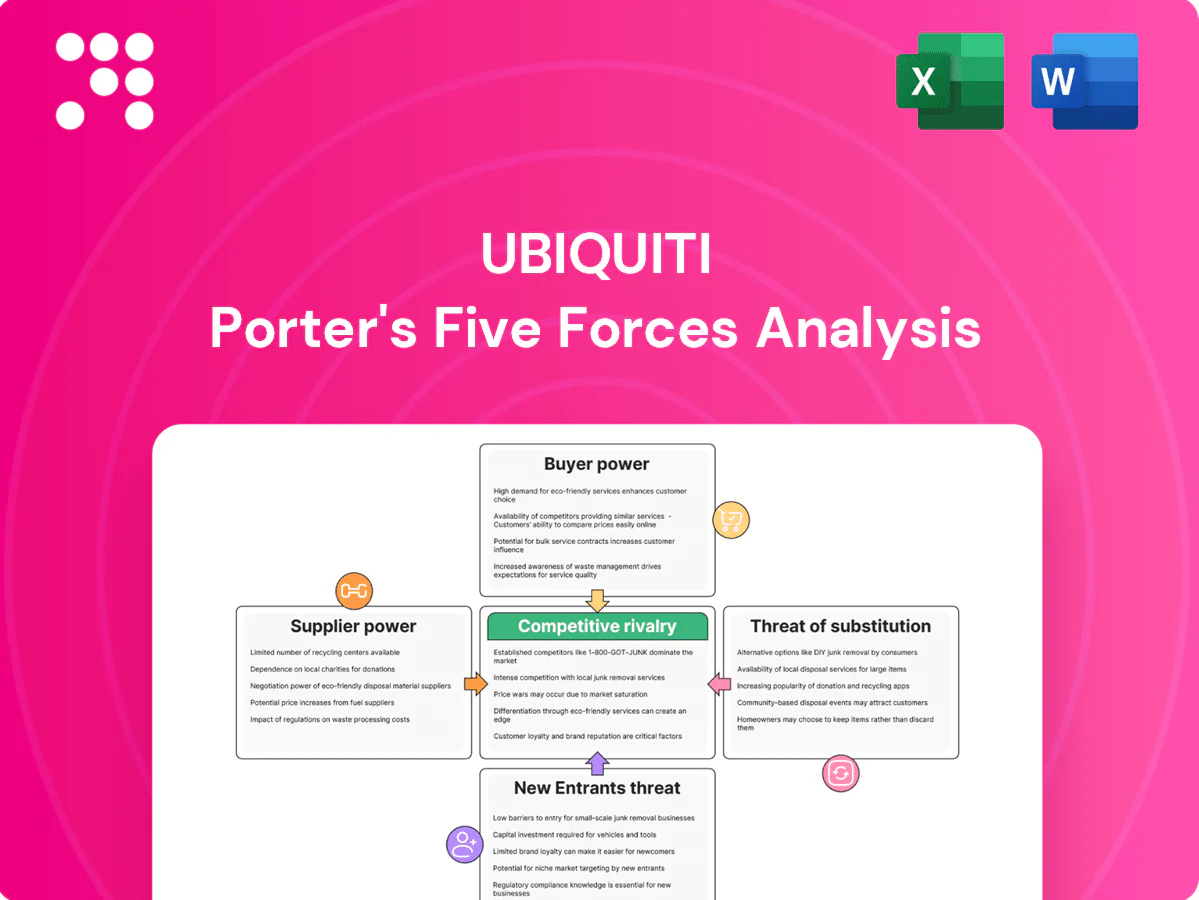
Ubiquiti Porter's Five Forces Analysis

Don't Miss the Bigger Picture
Ubiquiti faces intense competition from established network vendors and nimble cloud-native challengers, while supplier and buyer power remain moderate due to specialized components and strong channel partners. Threats from substitutes and new entrants are rising with SaaS-driven networking. This preview is just the beginning. The full analysis provides a complete strategic snapshot with force-by-force ratings, visuals, and business implications tailored to Ubiquiti.
Suppliers Bargaining Power

Concentrated chip suppliers
Wi‑Fi SoCs, RF front‑ends and camera sensors come from a narrow set of suppliers—Qualcomm, Broadcom, MediaTek and Sony—leaving Ubiquiti exposed to supplier leverage; Sony held roughly 50% of the CMOS image‑sensor market in 2024. Limited alternatives raise switching costs and lead times of 12–24 weeks, so supply disruptions or design changes can ripple across Ubiquiti’s portfolio. Long‑term planning and multi‑sourcing reduce but do not remove concentration risk.
ODM/OEM manufacturing reliance
Ubiquiti relies on contract manufacturers, and per its 2024 SEC filings capacity allocation and yields materially affect COGS and delivery timelines; EMS partners gain pricing and scheduling leverage during high-utilization cycles. Design-for-manufacture lowers switching costs, but tooling and line changeovers create friction. Geographic diversification reduces single-site risk while increasing coordination complexity and logistics spend.

Specialized components scarcity
In 2024 PoE controller, high-gain antenna and enterprise NAND/DRAM shortages pushed lead times to 20+ weeks for niche SKUs, giving suppliers leverage to demand firmer MOQ and price premia; when boutique parts constrain builds vendors often extract better terms. Spot-buying produced double-digit premium volatility and margin pressure, while interchangeable designs and second-source specs reduced supplier power.

Logistics and compliance gating
Logistics and compliance act as quasi-suppliers for Ubiquiti: global shipping disruptions and US Section 301 tariffs remaining at up to 25% on many Chinese electronics amplify supplier leverage, while FCC/CE lab certification typically takes 4–12 weeks, elongating go-to-market timelines. Capacity crunches, regulatory updates, or customs delays shift bargaining power away from buyers and increase launch dependence on carriers and labs; early testing and bonded inventory reduce this exposure.
- Tariffs: up to 25%
- FCC/CE test time: 4–12 weeks
- Mitigation: early testing
- Mitigation: bonded inventory
Currency and input price pass-through
Suppliers for Ubiquiti price in USD or local currencies, shifting FX risk upstream; with US CPI ~3.4% in 2024 vendors more readily pass through higher material and labor costs. Ubiquiti’s ability to reprice is constrained by competitive positioning and channel sensitivity, so supplier leverage persists. Hedging and cost-down engineering have partially mitigated margin pressure.
- FX exposure: USD/local pricing
- Inflation pass-through: materials & labor
- Repricing limited by competition
- Mitigants: hedging, engineering cost-downs
Supplier concentration in chips and sensors fuels lead-time premiums and tariff pass-thru
Supplier concentration (Wi‑Fi SoCs, RF front‑ends, sensors) gives vendors leverage; Sony held ~50% of CMOS sensors in 2024 and lead times typically 12–24 weeks. EMS capacity and niche SKU shortages pushed some lead times to 20+ weeks in 2024, enabling price premiums; tariffs remain up to 25% and US CPI ~3.4% raised pass‑through risk.
| Metric | 2024 |
|---|---|
| Sony CMOS share | ~50% |
| Typical lead time | 12–24 weeks |
| Niche SKU lead time | 20+ weeks |
| Tariffs | up to 25% |
| US CPI | ~3.4% |
What is included in the product
 Detailed Word Document
Examines competitive rivalry, supplier and buyer power, threats of substitutes and new entrants facing Ubiquiti, highlighting its strengths in product differentiation, cost-efficient distribution, and ecosystem lock-in while noting risks from commoditized hardware, component suppliers, and emerging software rivals.

 Customizable Excel Spreadsheet
Clear, one-sheet Porter's Five Forces for Ubiquiti that maps supplier, buyer, rivalry, substitutes and entry threats—perfect for fast strategic decisions; pressure levels are customizable so you can model regulatory shifts, new entrants or component shortages instantly.
Customers Bargaining Power

Price-sensitive SMB and WISP base
Core SMB and WISP customers aggressively compare total cost of ownership against incumbents and low-cost rivals, driving selection decisions in 2024. High online price transparency magnifies their bargaining power and shortens purchase cycles. Volume and transition-period discount expectations are common, forcing Ubiquiti to offer tiered pricing. Continued value engineering is essential to defend margins amid competitive price pressure.
Moderate switching costs via ecosystem
UniFi/UISP controllers, device adoption and site configurations create meaningful stickiness, with Ubiquiti generating over $1 billion in annual revenue in 2024 that reflects broad ecosystem use. Open standards like Ethernet and Wi‑Fi limit full lock‑in versus proprietary stacks. Data migration and retraining remain real frictions for customers. Bundled firmware and service upgrades raise ecosystem utility and can reduce churn.

Channel and MSP influence
Distributors and MSPs aggregate demand for Ubiquiti and negotiate terms, leveraging a managed services market valued around $300B in 2024 to extract preferred-pricing tiers and rebates. Preferred tiers and rebate programs materially shape end-customer choices by lowering effective prices. MSP standardization on a single stack can swing multi-site deals, while Ubiquiti’s need to preserve partner margins tempers buyer power at the edge.

RFP-driven enterprise deals
- RFPs often >$100k
- Margin compression ~100–300 bps
- Certifications (SOC2/ISO) increase selection odds
- Reference architectures boost enterprise wins
Alternatives readily available
TCO pressure; stickiness drove $1.08B; rebates cut margins 100–300 bps
Buyers exert strong price pressure via TCO comparisons and online transparency, forcing tiered pricing and value engineering. UniFi/UISP stickiness helped drive ~ $1.08B revenue in 2024 but open standards and many substitutes keep switching costs moderate. MSPs/distributors and enterprise RFPs (> $100k) extract rebates and compress margins ~100–300 bps.
| Metric | 2024 value |
|---|---|
| Revenue | $1.08B |
| Managed services market | $300B |
| Typical RFPs | >$100k |
| Margin compression | 100–300 bps |
Full Version Awaits
Ubiquiti Porter's Five Forces Analysis
This preview shows the exact document you'll receive immediately after purchase—no surprises, no placeholders. The Ubiquiti Porter's Five Forces Analysis examines competitive rivalry, supplier and buyer power, threat of substitutes, and entry barriers, providing data-driven insights and strategic implications. It's fully formatted, actionable, and ready for immediate download and use.

Don't Miss the Bigger Picture
Ubiquiti faces intense competition from established network vendors and nimble cloud-native challengers, while supplier and buyer power remain moderate due to specialized components and strong channel partners. Threats from substitutes and new entrants are rising with SaaS-driven networking. This preview is just the beginning. The full analysis provides a complete strategic snapshot with force-by-force ratings, visuals, and business implications tailored to Ubiquiti.
Suppliers Bargaining Power
Concentrated chip suppliers
Wi‑Fi SoCs, RF front‑ends and camera sensors come from a narrow set of suppliers—Qualcomm, Broadcom, MediaTek and Sony—leaving Ubiquiti exposed to supplier leverage; Sony held roughly 50% of the CMOS image‑sensor market in 2024. Limited alternatives raise switching costs and lead times of 12–24 weeks, so supply disruptions or design changes can ripple across Ubiquiti’s portfolio. Long‑term planning and multi‑sourcing reduce but do not remove concentration risk.
ODM/OEM manufacturing reliance
Ubiquiti relies on contract manufacturers, and per its 2024 SEC filings capacity allocation and yields materially affect COGS and delivery timelines; EMS partners gain pricing and scheduling leverage during high-utilization cycles. Design-for-manufacture lowers switching costs, but tooling and line changeovers create friction. Geographic diversification reduces single-site risk while increasing coordination complexity and logistics spend.
Specialized components scarcity
In 2024 PoE controller, high-gain antenna and enterprise NAND/DRAM shortages pushed lead times to 20+ weeks for niche SKUs, giving suppliers leverage to demand firmer MOQ and price premia; when boutique parts constrain builds vendors often extract better terms. Spot-buying produced double-digit premium volatility and margin pressure, while interchangeable designs and second-source specs reduced supplier power.
Logistics and compliance gating
Logistics and compliance act as quasi-suppliers for Ubiquiti: global shipping disruptions and US Section 301 tariffs remaining at up to 25% on many Chinese electronics amplify supplier leverage, while FCC/CE lab certification typically takes 4–12 weeks, elongating go-to-market timelines. Capacity crunches, regulatory updates, or customs delays shift bargaining power away from buyers and increase launch dependence on carriers and labs; early testing and bonded inventory reduce this exposure.
- Tariffs: up to 25%
- FCC/CE test time: 4–12 weeks
- Mitigation: early testing
- Mitigation: bonded inventory
Currency and input price pass-through
Suppliers for Ubiquiti price in USD or local currencies, shifting FX risk upstream; with US CPI ~3.4% in 2024 vendors more readily pass through higher material and labor costs. Ubiquiti’s ability to reprice is constrained by competitive positioning and channel sensitivity, so supplier leverage persists. Hedging and cost-down engineering have partially mitigated margin pressure.
- FX exposure: USD/local pricing
- Inflation pass-through: materials & labor
- Repricing limited by competition
- Mitigants: hedging, engineering cost-downs
Supplier concentration in chips and sensors fuels lead-time premiums and tariff pass-thru
Supplier concentration (Wi‑Fi SoCs, RF front‑ends, sensors) gives vendors leverage; Sony held ~50% of CMOS sensors in 2024 and lead times typically 12–24 weeks. EMS capacity and niche SKU shortages pushed some lead times to 20+ weeks in 2024, enabling price premiums; tariffs remain up to 25% and US CPI ~3.4% raised pass‑through risk.
| Metric | 2024 |
|---|---|
| Sony CMOS share | ~50% |
| Typical lead time | 12–24 weeks |
| Niche SKU lead time | 20+ weeks |
| Tariffs | up to 25% |
| US CPI | ~3.4% |
What is included in the product
Detailed Word Document
Examines competitive rivalry, supplier and buyer power, threats of substitutes and new entrants facing Ubiquiti, highlighting its strengths in product differentiation, cost-efficient distribution, and ecosystem lock-in while noting risks from commoditized hardware, component suppliers, and emerging software rivals.
Customizable Excel Spreadsheet
Clear, one-sheet Porter's Five Forces for Ubiquiti that maps supplier, buyer, rivalry, substitutes and entry threats—perfect for fast strategic decisions; pressure levels are customizable so you can model regulatory shifts, new entrants or component shortages instantly.
Customers Bargaining Power
Price-sensitive SMB and WISP base
Core SMB and WISP customers aggressively compare total cost of ownership against incumbents and low-cost rivals, driving selection decisions in 2024. High online price transparency magnifies their bargaining power and shortens purchase cycles. Volume and transition-period discount expectations are common, forcing Ubiquiti to offer tiered pricing. Continued value engineering is essential to defend margins amid competitive price pressure.
Moderate switching costs via ecosystem
UniFi/UISP controllers, device adoption and site configurations create meaningful stickiness, with Ubiquiti generating over $1 billion in annual revenue in 2024 that reflects broad ecosystem use. Open standards like Ethernet and Wi‑Fi limit full lock‑in versus proprietary stacks. Data migration and retraining remain real frictions for customers. Bundled firmware and service upgrades raise ecosystem utility and can reduce churn.
Channel and MSP influence
Distributors and MSPs aggregate demand for Ubiquiti and negotiate terms, leveraging a managed services market valued around $300B in 2024 to extract preferred-pricing tiers and rebates. Preferred tiers and rebate programs materially shape end-customer choices by lowering effective prices. MSP standardization on a single stack can swing multi-site deals, while Ubiquiti’s need to preserve partner margins tempers buyer power at the edge.
RFP-driven enterprise deals
- RFPs often >$100k
- Margin compression ~100–300 bps
- Certifications (SOC2/ISO) increase selection odds
- Reference architectures boost enterprise wins
Alternatives readily available
TCO pressure; stickiness drove $1.08B; rebates cut margins 100–300 bps
Buyers exert strong price pressure via TCO comparisons and online transparency, forcing tiered pricing and value engineering. UniFi/UISP stickiness helped drive ~ $1.08B revenue in 2024 but open standards and many substitutes keep switching costs moderate. MSPs/distributors and enterprise RFPs (> $100k) extract rebates and compress margins ~100–300 bps.
| Metric | 2024 value |
|---|---|
| Revenue | $1.08B |
| Managed services market | $300B |
| Typical RFPs | >$100k |
| Margin compression | 100–300 bps |
Full Version Awaits
Ubiquiti Porter's Five Forces Analysis
This preview shows the exact document you'll receive immediately after purchase—no surprises, no placeholders. The Ubiquiti Porter's Five Forces Analysis examines competitive rivalry, supplier and buyer power, threat of substitutes, and entry barriers, providing data-driven insights and strategic implications. It's fully formatted, actionable, and ready for immediate download and use.
Original: $10.00
-65%$10.00
$3.50Description
Don't Miss the Bigger Picture
Ubiquiti faces intense competition from established network vendors and nimble cloud-native challengers, while supplier and buyer power remain moderate due to specialized components and strong channel partners. Threats from substitutes and new entrants are rising with SaaS-driven networking. This preview is just the beginning. The full analysis provides a complete strategic snapshot with force-by-force ratings, visuals, and business implications tailored to Ubiquiti.
Suppliers Bargaining Power
Concentrated chip suppliers
Wi‑Fi SoCs, RF front‑ends and camera sensors come from a narrow set of suppliers—Qualcomm, Broadcom, MediaTek and Sony—leaving Ubiquiti exposed to supplier leverage; Sony held roughly 50% of the CMOS image‑sensor market in 2024. Limited alternatives raise switching costs and lead times of 12–24 weeks, so supply disruptions or design changes can ripple across Ubiquiti’s portfolio. Long‑term planning and multi‑sourcing reduce but do not remove concentration risk.
ODM/OEM manufacturing reliance
Ubiquiti relies on contract manufacturers, and per its 2024 SEC filings capacity allocation and yields materially affect COGS and delivery timelines; EMS partners gain pricing and scheduling leverage during high-utilization cycles. Design-for-manufacture lowers switching costs, but tooling and line changeovers create friction. Geographic diversification reduces single-site risk while increasing coordination complexity and logistics spend.
Specialized components scarcity
In 2024 PoE controller, high-gain antenna and enterprise NAND/DRAM shortages pushed lead times to 20+ weeks for niche SKUs, giving suppliers leverage to demand firmer MOQ and price premia; when boutique parts constrain builds vendors often extract better terms. Spot-buying produced double-digit premium volatility and margin pressure, while interchangeable designs and second-source specs reduced supplier power.
Logistics and compliance gating
Logistics and compliance act as quasi-suppliers for Ubiquiti: global shipping disruptions and US Section 301 tariffs remaining at up to 25% on many Chinese electronics amplify supplier leverage, while FCC/CE lab certification typically takes 4–12 weeks, elongating go-to-market timelines. Capacity crunches, regulatory updates, or customs delays shift bargaining power away from buyers and increase launch dependence on carriers and labs; early testing and bonded inventory reduce this exposure.
- Tariffs: up to 25%
- FCC/CE test time: 4–12 weeks
- Mitigation: early testing
- Mitigation: bonded inventory
Currency and input price pass-through
Suppliers for Ubiquiti price in USD or local currencies, shifting FX risk upstream; with US CPI ~3.4% in 2024 vendors more readily pass through higher material and labor costs. Ubiquiti’s ability to reprice is constrained by competitive positioning and channel sensitivity, so supplier leverage persists. Hedging and cost-down engineering have partially mitigated margin pressure.
- FX exposure: USD/local pricing
- Inflation pass-through: materials & labor
- Repricing limited by competition
- Mitigants: hedging, engineering cost-downs
Supplier concentration in chips and sensors fuels lead-time premiums and tariff pass-thru
Supplier concentration (Wi‑Fi SoCs, RF front‑ends, sensors) gives vendors leverage; Sony held ~50% of CMOS sensors in 2024 and lead times typically 12–24 weeks. EMS capacity and niche SKU shortages pushed some lead times to 20+ weeks in 2024, enabling price premiums; tariffs remain up to 25% and US CPI ~3.4% raised pass‑through risk.
| Metric | 2024 |
|---|---|
| Sony CMOS share | ~50% |
| Typical lead time | 12–24 weeks |
| Niche SKU lead time | 20+ weeks |
| Tariffs | up to 25% |
| US CPI | ~3.4% |
What is included in the product
Detailed Word Document
Examines competitive rivalry, supplier and buyer power, threats of substitutes and new entrants facing Ubiquiti, highlighting its strengths in product differentiation, cost-efficient distribution, and ecosystem lock-in while noting risks from commoditized hardware, component suppliers, and emerging software rivals.
Customizable Excel Spreadsheet
Clear, one-sheet Porter's Five Forces for Ubiquiti that maps supplier, buyer, rivalry, substitutes and entry threats—perfect for fast strategic decisions; pressure levels are customizable so you can model regulatory shifts, new entrants or component shortages instantly.
Customers Bargaining Power
Price-sensitive SMB and WISP base
Core SMB and WISP customers aggressively compare total cost of ownership against incumbents and low-cost rivals, driving selection decisions in 2024. High online price transparency magnifies their bargaining power and shortens purchase cycles. Volume and transition-period discount expectations are common, forcing Ubiquiti to offer tiered pricing. Continued value engineering is essential to defend margins amid competitive price pressure.
Moderate switching costs via ecosystem
UniFi/UISP controllers, device adoption and site configurations create meaningful stickiness, with Ubiquiti generating over $1 billion in annual revenue in 2024 that reflects broad ecosystem use. Open standards like Ethernet and Wi‑Fi limit full lock‑in versus proprietary stacks. Data migration and retraining remain real frictions for customers. Bundled firmware and service upgrades raise ecosystem utility and can reduce churn.
Channel and MSP influence
Distributors and MSPs aggregate demand for Ubiquiti and negotiate terms, leveraging a managed services market valued around $300B in 2024 to extract preferred-pricing tiers and rebates. Preferred tiers and rebate programs materially shape end-customer choices by lowering effective prices. MSP standardization on a single stack can swing multi-site deals, while Ubiquiti’s need to preserve partner margins tempers buyer power at the edge.
RFP-driven enterprise deals
- RFPs often >$100k
- Margin compression ~100–300 bps
- Certifications (SOC2/ISO) increase selection odds
- Reference architectures boost enterprise wins
Alternatives readily available
TCO pressure; stickiness drove $1.08B; rebates cut margins 100–300 bps
Buyers exert strong price pressure via TCO comparisons and online transparency, forcing tiered pricing and value engineering. UniFi/UISP stickiness helped drive ~ $1.08B revenue in 2024 but open standards and many substitutes keep switching costs moderate. MSPs/distributors and enterprise RFPs (> $100k) extract rebates and compress margins ~100–300 bps.
| Metric | 2024 value |
|---|---|
| Revenue | $1.08B |
| Managed services market | $300B |
| Typical RFPs | >$100k |
| Margin compression | 100–300 bps |
Full Version Awaits
Ubiquiti Porter's Five Forces Analysis
This preview shows the exact document you'll receive immediately after purchase—no surprises, no placeholders. The Ubiquiti Porter's Five Forces Analysis examines competitive rivalry, supplier and buyer power, threat of substitutes, and entry barriers, providing data-driven insights and strategic implications. It's fully formatted, actionable, and ready for immediate download and use.











