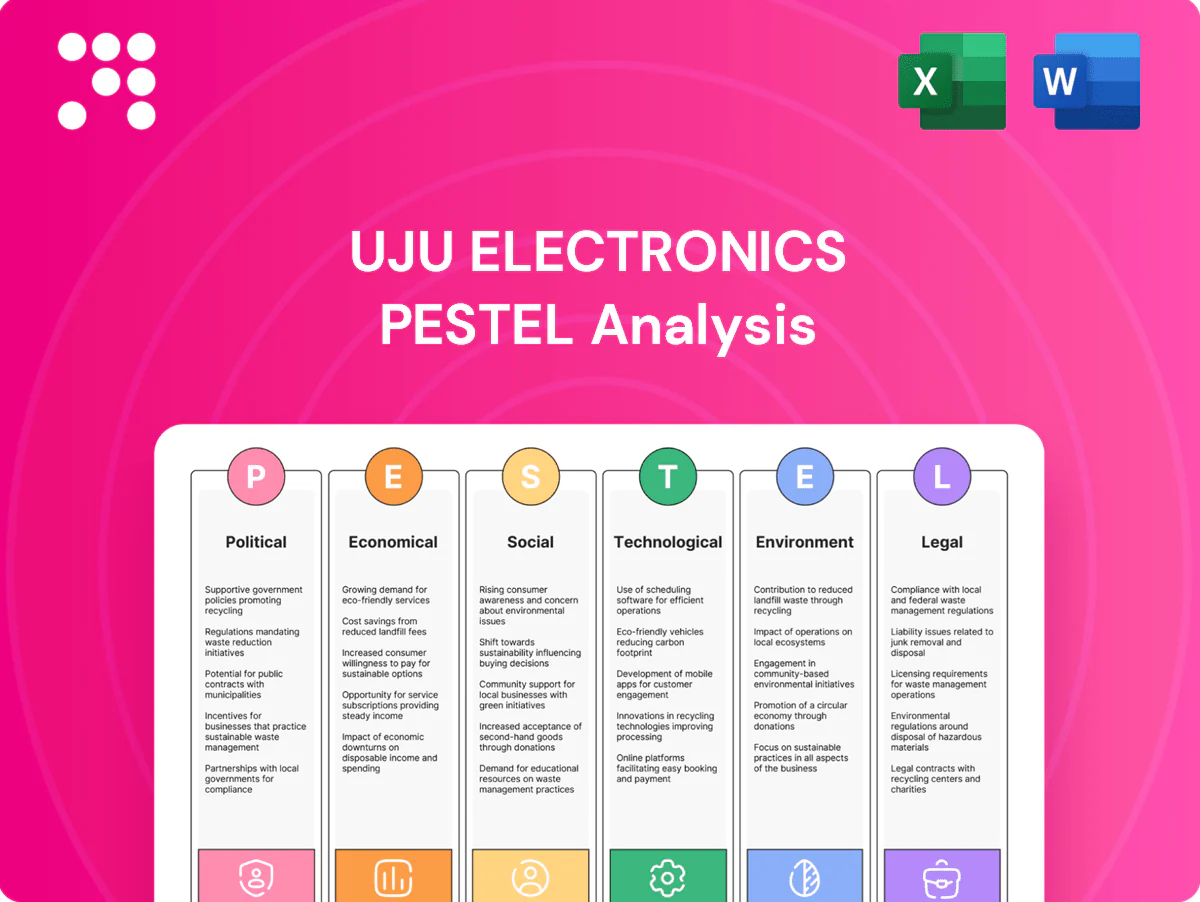
Uju Electronics PESTLE Analysis

Your Competitive Advantage Starts with This Report
Gain strategic clarity on how political shifts, supply-chain economics, and rapid tech change are shaping Uju Electronics’ future. This concise PESTLE snapshot highlights risks and opportunities you can act on today. For the full, editable deep-dive—download the complete analysis and make confident, data-driven decisions.
Political factors

South Korea policy stability
Stable South Korean governance underpins manufacturing incentives, R&D tax benefits and export promotion, supported by national R&D intensity near 4.7% of GDP (2023). Industrial policy prioritizes semiconductors, automotive and telecom—sectors driving connector demand and accounting for roughly 15–18% of goods exports in 2023. Monitor post-election shifts that could reweight subsidies or labor rules; local content encouragement may affect plant location and supplier sourcing.
US–China tech tensions
Export controls on advanced electronics are reshaping UJU’s end-customer mix and design-in requirements as suppliers face tighter US rules and allied controls; Section 301 tariffs remain as high as 25%, raising landed costs. Tariffs and entity-list restrictions drive part requalification and dual sourcing to avoid supply shocks. UJU must maintain automated compliance screening and track the EAR de minimis threshold of 25%. Diversifying beyond China and the US reduces concentration risk.

Trade agreements and tariffs
KORUS, RCEP and the EU–Korea FTA substantially lower duties on electronic connectors and components—EU–Korea eliminated most industrial tariffs since 2011 and RCEP (in force from 2022) covers about 30% of global GDP—so Uju can cut input duty exposure. Rules of origin dictate where value-add must occur to claim preferences, sudden tariff shifts can swing landed cost and pricing power, and flexible logistics to reroute via FTA-favorable hubs is essential.

Industrial standards diplomacy
Regional security risks
Regional security risks around the Korean peninsula—where South Korea increased defence spending to roughly 2.6% of GDP in 2024—raise the risk of maritime disruptions that can drive up shipping insurance and war-risk surcharges; carriers reported episodic rerouting and increased lead times in 2024–25. Uju Electronics should build contingency logistics plans, inventory buffers and geographic production redundancy to cut downtime exposure, and engage government alert systems and export credit agencies for risk cover.
- Insurance: war-risk surcharges reported by carriers in 2024–25
- Contingency: buffer inventory & alternate routes
- Redundancy: multi-site production lowers outage risk
- Support: register with national alerts & export credit agencies
R&D-led chip export surge: tariffs and defence spend force dual-sourcing, build redundancy
Stable SK governance supports R&D (4.7% of GDP, 2023), semiconductor-led export push (15–18% of goods exports, 2023) and incentives; tariffs/US export controls (up to 25%) force dual-sourcing and compliance; RCEP (~30% global GDP) and KORUS cut duties but rules of origin matter; defence spend 2.6% GDP (2024) raises logistics risk, so build buffers and multi-site redundancy.
| Metric | Value |
|---|---|
| R&D intensity (2023) | 4.7% |
| Defense spend (2024) | 2.6% GDP |
| Tariffs | Up to 25% |
| RCEP coverage | ~30% GDP |
What is included in the product
 Detailed Word Document
Explores how Political, Economic, Social, Technological, Environmental and Legal forces uniquely impact Uju Electronics, combining data-driven trends and region-specific regulatory context. Designed for executives and investors, the analysis highlights risks, opportunities and forward-looking scenarios to inform strategic planning and funding decisions.

 Customizable Excel Spreadsheet
A concise, visually segmented PESTLE summary of Uju Electronics that simplifies external risk assessment for meetings, is easily editable for region or business-line notes, and can be dropped into presentations for rapid team alignment and decision-making.
Economic factors

Cyclical demand swings
Automotive, telecom and consumer electronics demand cycles drive Uju Electronics revenue swings; global auto production fell to ~75 million units in 2024 while smartphone shipments were ~1.1 billion, highlighting sector volatility. Post‑boom inventory corrections in semiconductors have produced revenue declines up to 20–30% in downturns. Scenario planning should map semiconductor and handset cycles and maintain variable cost levers and flexible staffing to preserve margins.
FX and interest rates
KRW volatility vs USD (~1,330 KRW), CNY (~185 KRW) and EUR (~1,450 KRW) materially compresses export margins and raises costs for imported copper/aluminum; a 5% KRW move can swing gross margin several percentage points.
Hedging policies should match order backlog duration and metal exposure—use forwards/options sized to contracted volumes and a rolling 12–24 month horizon.
Global rate paths (Fed funds ~5.25–5.50%) dampen OEM capex for 5G and EV supply chains, delaying orders; include FX-pricing clauses to share currency risk with OEMs.

Input costs and metals
Copper (~US$9,000/t), gold (~US$2,300/oz), palladium (~US$1,400/oz) and engineering resins are the primary drivers of connector BOM cost, often representing the single-largest material spend. Rising plating chemical prices and elevated energy costs have compressed gross margins in 2024–25 across electronics suppliers. Long-term supply contracts and value-engineering programs have reduced input volatility. Pass-through pricing and design standardization improve resilience and margin recovery.

EV and 5G infrastructure
- EV sales 2024 ~14M — higher HV connector demand
- Public chargers ~1.5M — fast-charging components
- 5G subs ~1.6B — sustained RF/interconnect revenue
- Priority: convert tier-1/carrier wins into LTAs
Global supply chain shifts
Nearshoring and China+1 reshaped sourcing: nearshoring investment rose ~18% YoY in 2024 and 60% of electronics buyers sought regional suppliers to avoid tariffs (2024 surveys). Customers demand regionalized supply for risk mitigation and tariff avoidance. Multi-plant footprints and approved-vendor lists are now competitive advantages. Lead-time reliability wins share over price alone.
- Nearshoring +18% (2024)
- 60% buyers prefer regional (2024)
- Multi-plant & AVL = advantage
- Lead-time reliability > price
R&D-led chip export surge: tariffs and defence spend force dual-sourcing, build redundancy
Demand cycles (auto ~75M units 2024, smartphones ~1.1B) drive revenue volatility; EVs 14M and 5G subs 1.6B sustain connector demand. KRW ~1,330 vs USD (5% move = several ppts gross margin swing); Fed funds ~5.25–5.50% damp OEM capex. Copper ~US$9,000/t and resin/energy inflation compressed margins; nearshoring +18% and 60% buyers prefer regional suppliers.
| Metric | 2024/25 |
|---|---|
| Auto prod | ~75M |
| Smartphones | ~1.1B |
| EVs | ~14M |
| 5G subs | ~1.6B |
| Copper | US$9,000/t |
| Nearshoring | +18% / 60% buyers |
What You See Is What You Get
Uju Electronics PESTLE Analysis
The preview shown here is the exact Uju Electronics PESTLE Analysis you’ll receive after purchase—fully formatted, professionally structured, and ready to use. This screenshot reflects the real file delivered upon checkout with no placeholders or surprises. The content, layout, and structure you see are identical to the downloadable document provided immediately after payment.

Your Competitive Advantage Starts with This Report
Gain strategic clarity on how political shifts, supply-chain economics, and rapid tech change are shaping Uju Electronics’ future. This concise PESTLE snapshot highlights risks and opportunities you can act on today. For the full, editable deep-dive—download the complete analysis and make confident, data-driven decisions.
Political factors
South Korea policy stability
Stable South Korean governance underpins manufacturing incentives, R&D tax benefits and export promotion, supported by national R&D intensity near 4.7% of GDP (2023). Industrial policy prioritizes semiconductors, automotive and telecom—sectors driving connector demand and accounting for roughly 15–18% of goods exports in 2023. Monitor post-election shifts that could reweight subsidies or labor rules; local content encouragement may affect plant location and supplier sourcing.
US–China tech tensions
Export controls on advanced electronics are reshaping UJU’s end-customer mix and design-in requirements as suppliers face tighter US rules and allied controls; Section 301 tariffs remain as high as 25%, raising landed costs. Tariffs and entity-list restrictions drive part requalification and dual sourcing to avoid supply shocks. UJU must maintain automated compliance screening and track the EAR de minimis threshold of 25%. Diversifying beyond China and the US reduces concentration risk.
Trade agreements and tariffs
KORUS, RCEP and the EU–Korea FTA substantially lower duties on electronic connectors and components—EU–Korea eliminated most industrial tariffs since 2011 and RCEP (in force from 2022) covers about 30% of global GDP—so Uju can cut input duty exposure. Rules of origin dictate where value-add must occur to claim preferences, sudden tariff shifts can swing landed cost and pricing power, and flexible logistics to reroute via FTA-favorable hubs is essential.
Industrial standards diplomacy
Regional security risks
Regional security risks around the Korean peninsula—where South Korea increased defence spending to roughly 2.6% of GDP in 2024—raise the risk of maritime disruptions that can drive up shipping insurance and war-risk surcharges; carriers reported episodic rerouting and increased lead times in 2024–25. Uju Electronics should build contingency logistics plans, inventory buffers and geographic production redundancy to cut downtime exposure, and engage government alert systems and export credit agencies for risk cover.
- Insurance: war-risk surcharges reported by carriers in 2024–25
- Contingency: buffer inventory & alternate routes
- Redundancy: multi-site production lowers outage risk
- Support: register with national alerts & export credit agencies
R&D-led chip export surge: tariffs and defence spend force dual-sourcing, build redundancy
Stable SK governance supports R&D (4.7% of GDP, 2023), semiconductor-led export push (15–18% of goods exports, 2023) and incentives; tariffs/US export controls (up to 25%) force dual-sourcing and compliance; RCEP (~30% global GDP) and KORUS cut duties but rules of origin matter; defence spend 2.6% GDP (2024) raises logistics risk, so build buffers and multi-site redundancy.
| Metric | Value |
|---|---|
| R&D intensity (2023) | 4.7% |
| Defense spend (2024) | 2.6% GDP |
| Tariffs | Up to 25% |
| RCEP coverage | ~30% GDP |
What is included in the product
Detailed Word Document
Explores how Political, Economic, Social, Technological, Environmental and Legal forces uniquely impact Uju Electronics, combining data-driven trends and region-specific regulatory context. Designed for executives and investors, the analysis highlights risks, opportunities and forward-looking scenarios to inform strategic planning and funding decisions.
Customizable Excel Spreadsheet
A concise, visually segmented PESTLE summary of Uju Electronics that simplifies external risk assessment for meetings, is easily editable for region or business-line notes, and can be dropped into presentations for rapid team alignment and decision-making.
Economic factors
Cyclical demand swings
Automotive, telecom and consumer electronics demand cycles drive Uju Electronics revenue swings; global auto production fell to ~75 million units in 2024 while smartphone shipments were ~1.1 billion, highlighting sector volatility. Post‑boom inventory corrections in semiconductors have produced revenue declines up to 20–30% in downturns. Scenario planning should map semiconductor and handset cycles and maintain variable cost levers and flexible staffing to preserve margins.
FX and interest rates
KRW volatility vs USD (~1,330 KRW), CNY (~185 KRW) and EUR (~1,450 KRW) materially compresses export margins and raises costs for imported copper/aluminum; a 5% KRW move can swing gross margin several percentage points.
Hedging policies should match order backlog duration and metal exposure—use forwards/options sized to contracted volumes and a rolling 12–24 month horizon.
Global rate paths (Fed funds ~5.25–5.50%) dampen OEM capex for 5G and EV supply chains, delaying orders; include FX-pricing clauses to share currency risk with OEMs.
Input costs and metals
Copper (~US$9,000/t), gold (~US$2,300/oz), palladium (~US$1,400/oz) and engineering resins are the primary drivers of connector BOM cost, often representing the single-largest material spend. Rising plating chemical prices and elevated energy costs have compressed gross margins in 2024–25 across electronics suppliers. Long-term supply contracts and value-engineering programs have reduced input volatility. Pass-through pricing and design standardization improve resilience and margin recovery.
EV and 5G infrastructure
- EV sales 2024 ~14M — higher HV connector demand
- Public chargers ~1.5M — fast-charging components
- 5G subs ~1.6B — sustained RF/interconnect revenue
- Priority: convert tier-1/carrier wins into LTAs
Global supply chain shifts
Nearshoring and China+1 reshaped sourcing: nearshoring investment rose ~18% YoY in 2024 and 60% of electronics buyers sought regional suppliers to avoid tariffs (2024 surveys). Customers demand regionalized supply for risk mitigation and tariff avoidance. Multi-plant footprints and approved-vendor lists are now competitive advantages. Lead-time reliability wins share over price alone.
- Nearshoring +18% (2024)
- 60% buyers prefer regional (2024)
- Multi-plant & AVL = advantage
- Lead-time reliability > price
R&D-led chip export surge: tariffs and defence spend force dual-sourcing, build redundancy
Demand cycles (auto ~75M units 2024, smartphones ~1.1B) drive revenue volatility; EVs 14M and 5G subs 1.6B sustain connector demand. KRW ~1,330 vs USD (5% move = several ppts gross margin swing); Fed funds ~5.25–5.50% damp OEM capex. Copper ~US$9,000/t and resin/energy inflation compressed margins; nearshoring +18% and 60% buyers prefer regional suppliers.
| Metric | 2024/25 |
|---|---|
| Auto prod | ~75M |
| Smartphones | ~1.1B |
| EVs | ~14M |
| 5G subs | ~1.6B |
| Copper | US$9,000/t |
| Nearshoring | +18% / 60% buyers |
What You See Is What You Get
Uju Electronics PESTLE Analysis
The preview shown here is the exact Uju Electronics PESTLE Analysis you’ll receive after purchase—fully formatted, professionally structured, and ready to use. This screenshot reflects the real file delivered upon checkout with no placeholders or surprises. The content, layout, and structure you see are identical to the downloadable document provided immediately after payment.
Original: $10.00
-65%$10.00
$3.50Description
Your Competitive Advantage Starts with This Report
Gain strategic clarity on how political shifts, supply-chain economics, and rapid tech change are shaping Uju Electronics’ future. This concise PESTLE snapshot highlights risks and opportunities you can act on today. For the full, editable deep-dive—download the complete analysis and make confident, data-driven decisions.
Political factors
South Korea policy stability
Stable South Korean governance underpins manufacturing incentives, R&D tax benefits and export promotion, supported by national R&D intensity near 4.7% of GDP (2023). Industrial policy prioritizes semiconductors, automotive and telecom—sectors driving connector demand and accounting for roughly 15–18% of goods exports in 2023. Monitor post-election shifts that could reweight subsidies or labor rules; local content encouragement may affect plant location and supplier sourcing.
US–China tech tensions
Export controls on advanced electronics are reshaping UJU’s end-customer mix and design-in requirements as suppliers face tighter US rules and allied controls; Section 301 tariffs remain as high as 25%, raising landed costs. Tariffs and entity-list restrictions drive part requalification and dual sourcing to avoid supply shocks. UJU must maintain automated compliance screening and track the EAR de minimis threshold of 25%. Diversifying beyond China and the US reduces concentration risk.
Trade agreements and tariffs
KORUS, RCEP and the EU–Korea FTA substantially lower duties on electronic connectors and components—EU–Korea eliminated most industrial tariffs since 2011 and RCEP (in force from 2022) covers about 30% of global GDP—so Uju can cut input duty exposure. Rules of origin dictate where value-add must occur to claim preferences, sudden tariff shifts can swing landed cost and pricing power, and flexible logistics to reroute via FTA-favorable hubs is essential.
Industrial standards diplomacy
Regional security risks
Regional security risks around the Korean peninsula—where South Korea increased defence spending to roughly 2.6% of GDP in 2024—raise the risk of maritime disruptions that can drive up shipping insurance and war-risk surcharges; carriers reported episodic rerouting and increased lead times in 2024–25. Uju Electronics should build contingency logistics plans, inventory buffers and geographic production redundancy to cut downtime exposure, and engage government alert systems and export credit agencies for risk cover.
- Insurance: war-risk surcharges reported by carriers in 2024–25
- Contingency: buffer inventory & alternate routes
- Redundancy: multi-site production lowers outage risk
- Support: register with national alerts & export credit agencies
R&D-led chip export surge: tariffs and defence spend force dual-sourcing, build redundancy
Stable SK governance supports R&D (4.7% of GDP, 2023), semiconductor-led export push (15–18% of goods exports, 2023) and incentives; tariffs/US export controls (up to 25%) force dual-sourcing and compliance; RCEP (~30% global GDP) and KORUS cut duties but rules of origin matter; defence spend 2.6% GDP (2024) raises logistics risk, so build buffers and multi-site redundancy.
| Metric | Value |
|---|---|
| R&D intensity (2023) | 4.7% |
| Defense spend (2024) | 2.6% GDP |
| Tariffs | Up to 25% |
| RCEP coverage | ~30% GDP |
What is included in the product
Detailed Word Document
Explores how Political, Economic, Social, Technological, Environmental and Legal forces uniquely impact Uju Electronics, combining data-driven trends and region-specific regulatory context. Designed for executives and investors, the analysis highlights risks, opportunities and forward-looking scenarios to inform strategic planning and funding decisions.
Customizable Excel Spreadsheet
A concise, visually segmented PESTLE summary of Uju Electronics that simplifies external risk assessment for meetings, is easily editable for region or business-line notes, and can be dropped into presentations for rapid team alignment and decision-making.
Economic factors
Cyclical demand swings
Automotive, telecom and consumer electronics demand cycles drive Uju Electronics revenue swings; global auto production fell to ~75 million units in 2024 while smartphone shipments were ~1.1 billion, highlighting sector volatility. Post‑boom inventory corrections in semiconductors have produced revenue declines up to 20–30% in downturns. Scenario planning should map semiconductor and handset cycles and maintain variable cost levers and flexible staffing to preserve margins.
FX and interest rates
KRW volatility vs USD (~1,330 KRW), CNY (~185 KRW) and EUR (~1,450 KRW) materially compresses export margins and raises costs for imported copper/aluminum; a 5% KRW move can swing gross margin several percentage points.
Hedging policies should match order backlog duration and metal exposure—use forwards/options sized to contracted volumes and a rolling 12–24 month horizon.
Global rate paths (Fed funds ~5.25–5.50%) dampen OEM capex for 5G and EV supply chains, delaying orders; include FX-pricing clauses to share currency risk with OEMs.
Input costs and metals
Copper (~US$9,000/t), gold (~US$2,300/oz), palladium (~US$1,400/oz) and engineering resins are the primary drivers of connector BOM cost, often representing the single-largest material spend. Rising plating chemical prices and elevated energy costs have compressed gross margins in 2024–25 across electronics suppliers. Long-term supply contracts and value-engineering programs have reduced input volatility. Pass-through pricing and design standardization improve resilience and margin recovery.
EV and 5G infrastructure
- EV sales 2024 ~14M — higher HV connector demand
- Public chargers ~1.5M — fast-charging components
- 5G subs ~1.6B — sustained RF/interconnect revenue
- Priority: convert tier-1/carrier wins into LTAs
Global supply chain shifts
Nearshoring and China+1 reshaped sourcing: nearshoring investment rose ~18% YoY in 2024 and 60% of electronics buyers sought regional suppliers to avoid tariffs (2024 surveys). Customers demand regionalized supply for risk mitigation and tariff avoidance. Multi-plant footprints and approved-vendor lists are now competitive advantages. Lead-time reliability wins share over price alone.
- Nearshoring +18% (2024)
- 60% buyers prefer regional (2024)
- Multi-plant & AVL = advantage
- Lead-time reliability > price
R&D-led chip export surge: tariffs and defence spend force dual-sourcing, build redundancy
Demand cycles (auto ~75M units 2024, smartphones ~1.1B) drive revenue volatility; EVs 14M and 5G subs 1.6B sustain connector demand. KRW ~1,330 vs USD (5% move = several ppts gross margin swing); Fed funds ~5.25–5.50% damp OEM capex. Copper ~US$9,000/t and resin/energy inflation compressed margins; nearshoring +18% and 60% buyers prefer regional suppliers.
| Metric | 2024/25 |
|---|---|
| Auto prod | ~75M |
| Smartphones | ~1.1B |
| EVs | ~14M |
| 5G subs | ~1.6B |
| Copper | US$9,000/t |
| Nearshoring | +18% / 60% buyers |
What You See Is What You Get
Uju Electronics PESTLE Analysis
The preview shown here is the exact Uju Electronics PESTLE Analysis you’ll receive after purchase—fully formatted, professionally structured, and ready to use. This screenshot reflects the real file delivered upon checkout with no placeholders or surprises. The content, layout, and structure you see are identical to the downloadable document provided immediately after payment.











