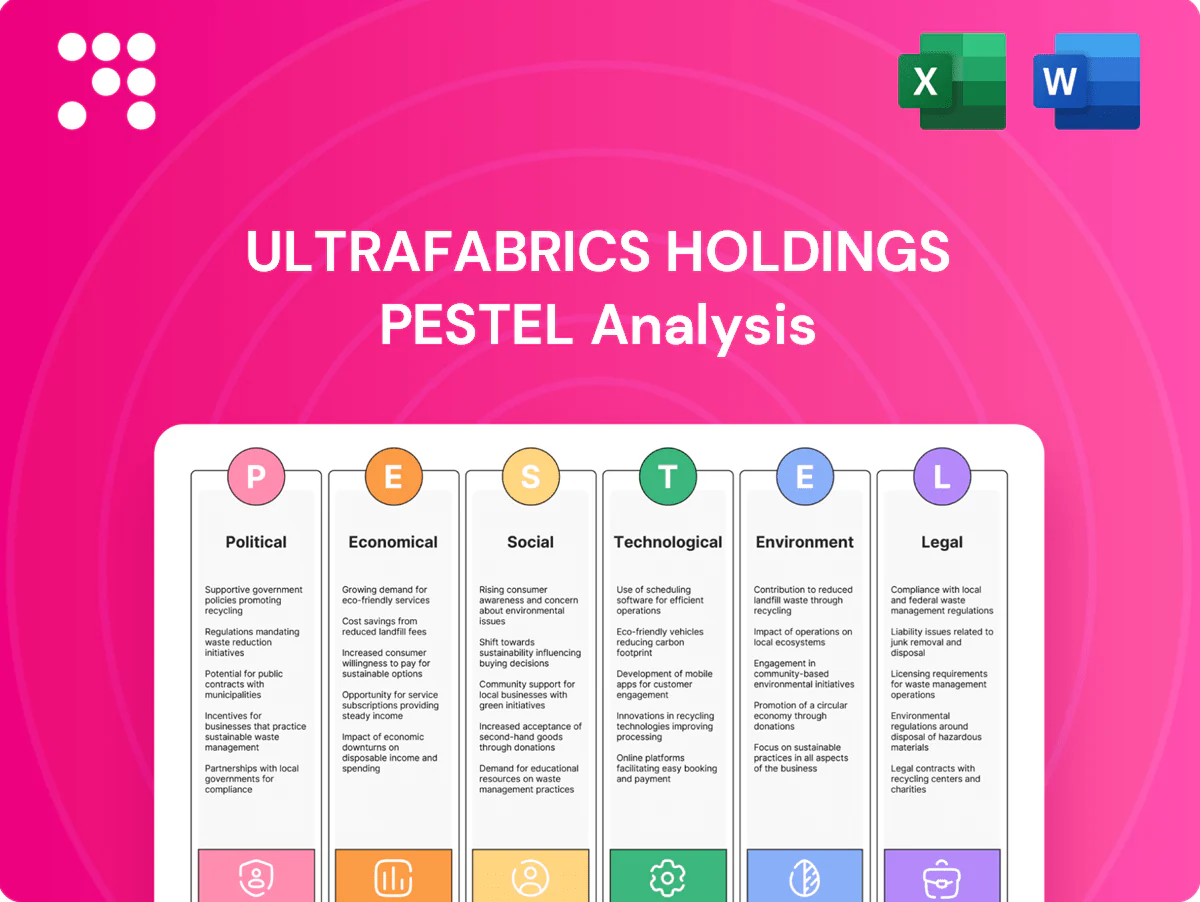
Ultrafabrics Holdings PESTLE Analysis

Plan Smarter. Present Sharper. Compete Stronger.
Discover how political shifts, economic cycles, social trends, technological advances, legal changes, and environmental pressures are shaping Ultrafabrics Holdings' strategic outlook in our concise PESTLE snapshot. This analysis highlights immediate risks and growth levers to inform investment and planning decisions. Purchase the full PESTLE for a complete, actionable breakdown ready for boardrooms and strategy decks.
Political factors

Trade policy and tariffs
Import duties on chemicals and textiles (commonly ranging 0–12% with many applied tariffs near 8–10%) directly raise polyurethane input costs, compressing Ultrafabrics’ margin and pricing power; China supplies roughly 40% of global chemical production, so US–EU–Asia trade shifts can disrupt resin, pigment and additive flows. Preferential trade deals (e.g., CPTPP expansion, EU trade pacts) could open premium fabric markets, while rising protectionism extends lead times and forces larger inventory buffers.
Sustainability incentives
Government subsidies and tax credits in the EU and US increasingly favor low-carbon, bio-based and solvent-free PU processes, while EU Green Public Procurement criteria and similar national rules push sustainable materials into transport and healthcare supply chains; public procurement represents about 14% of EU GDP (European Commission), so compliance can unlock large aviation and civic furniture bids, whereas weak incentives slow ROI on green capex.

Geopolitical supply risk
Regional instability still disrupts petrochemical feedstocks and specialty chemicals, with Brent crude averaging about $86/bbl in 2024, driving feedstock price volatility for Ultrafabrics' polyurethane inputs. Export controls on advanced materials have tightened since 2022, compressing available isocyanate supply and raising premiums for limited suppliers. Firms are adopting multi-region sourcing and 3–6 months strategic inventories, while political risk insurance (typical premiums 0.5–2% of insured value) and nearshoring reduce supply shocks.

Sector-specific standards
- Aviation: fleet renewal cycles
- Automotive/EV: growing addressable market (~14M EVs 2023)
- Healthcare: procurement tied to $4.5T spend (US 2023)
- Defense/public transport: strict compliance, ~$858B US defense FY2024
Labor and industrial policy
Minimum wage shifts—federal $7.25/hr and state examples like California $16.00/hr—can alter Ultrafabrics manufacturing footprints and labor costs; state increases have driven some reshoring. Federal incentives such as the CHIPS and Science Act (about $52 billion for semiconductor/manufacturing support) and state grants spur automation investments. H‑1B cap remains 85,000, constraining access to specialized chemical/materials talent; regional cluster incentives steer site selection.
- Labor cost: federal $7.25/hr; CA $16.00/hr
- Incentives: CHIPS Act ≈ $52B for manufacturing
- Immigration: H‑1B cap 85,000
- Site choice: regional cluster grants influence location
Import duties, China's ~40% share and $86/bbl Brent squeeze PU margins; green subsidies drive shift
Import duties (0–12%, many 8–10%) and China’s ~40% share of chemical output raise PU input risk and margin pressure; trade shifts and protectionism increase lead times. EU/US green subsidies and 14% EU public procurement push sustainable PU adoption while Brent averaged ~$86/bbl in 2024, adding feedstock volatility. Market drivers: 14M EVs (2023), US healthcare $4.5T (2023), US defense $858B (FY2024); labor: fed $7.25, CA $16, H‑1B 85,000.
| Factor | Key stat |
|---|---|
| Import duties | 0–12% (many 8–10%) |
| China chemical share | ~40% |
| Brent 2024 | $86/bbl |
| EVs 2023 | ~14M |
What is included in the product
 Detailed Word Document
Explores how Political, Economic, Social, Technological, Environmental, and Legal forces uniquely affect Ultrafabrics Holdings, using current market and regulatory data to identify industry-specific risks and opportunities; designed for executives and investors to inform strategy, scenario planning, and funding decisions.

 Customizable Excel Spreadsheet
A concise, visually segmented PESTLE summary of Ultrafabrics Holdings that eases stakeholder alignment by distilling external risks and market drivers into shareable slides or meeting notes, while allowing quick annotation for region- or product-specific pain points during strategic planning sessions.
Economic factors

Cyclical end-markets
Automotive, aviation and furniture cycles create volume volatility for Ultrafabrics: global light-vehicle production ~80 million units (2024), global air passengers ~4.5 billion (2024) and US furniture sales ≈$130 billion (2024) drive demand swings. Airline retrofit and OEM build rates move with macro growth and travel demand, tying upholstery volumes to fleet deliveries and passenger traffic. Healthcare end-markets are more resilient, smoothing revenue during downturns. A balanced portfolio across these sectors reduces overall cyclicality.
Input cost inflation
Input cost inflation pressures margins through polyurethane feedstocks (MDI/TDI, polyols), pigments and energy costs. Brent averaged about 86 USD/bbl in 2024, and oil and gas swings cascade through to chemical pricing and feedstock volatility. Long-term contracts and hedging help stabilize COGS, while value-based pricing supported by product performance enables pass-through of increases.

FX and global sales mix
Multi-currency revenues and costs expose Ultrafabrics to exchange-rate moves; the US dollar's strength—DXY peaked near 114 in Sep 2022 before easing to around 103 by end-2023—can compress reported overseas sales when translated. Natural hedges from local sourcing and local-currency pricing mitigate volatility across its global mix. Treasury policies and use of forwards and options provide further protection.

Interest rates and capex
Higher rates (US fed funds ~5.25–5.50% mid‑2025) raise financing costs for Ultrafabrics plant upgrades and sustainability projects; constrained customer financing depresses OEM order books amid ~66M global light‑vehicle sales in 2024. Prioritizing high‑ROI automation and energy efficiency can cut payback to 2–4 years, while programs like the US Inflation Reduction Act (~$369bn) can offset capital intensity.
- Financing cost sensitivity: +1% rate increases WACC and capex hurdle
- OEM demand link: 2024 global LV sales ~66M
- Mitigation: 2–4y payback targets, IRA $369bn grants
Emerging market growth
Rising middle classes in APAC and LATAM are expanding demand for premium, durable upholstery—Emerging Asia GDP grew about 4.6% and Latin America about 2.5% in 2024 (IMF), supporting higher discretionary spend and premium furniture uptake. Local regulations and certification requirements force product tailoring and testing; regional partnerships speed channel entry while price tiering preserves brand equity and captures broader market segments.
- APAC growth 4.6% (2024, IMF)
- LATAM growth 2.5% (2024, IMF)
- Certifications required per local standards
- Regional partners accelerate penetration
- Price tiers protect brand, capture value
Import duties, China's ~40% share and $86/bbl Brent squeeze PU margins; green subsidies drive shift
Cyclical demand from automotive (~80M light vehicles 2024), aviation (~4.5B passengers 2024) and US furniture (~$130B 2024) drives volume volatility, while healthcare provides resilience. Input inflation (Brent ~$86/bbl 2024) and feedstock swings pressure margins; hedging and long‑term contracts mitigate. Higher rates (fed funds ~5.25–5.50% mid‑2025) raise capex cost; APAC/LATAM growth (4.6%/2.5% 2024 IMF) supports premium demand.
| Metric | 2024/2025 |
|---|---|
| Global LV production | ~80M (2024) |
| Air passengers | ~4.5B (2024) |
| US furniture sales | $130B (2024) |
| Brent oil | $86/bbl (2024) |
| Fed funds | ~5.25–5.50% (mid‑2025) |
| APAC/LATAM GDP | 4.6% / 2.5% (2024) |
Full Version Awaits
Ultrafabrics Holdings PESTLE Analysis
The Ultrafabrics Holdings PESTLE Analysis delivers concise political, economic, social, technological, legal and environmental insights tailored for strategic decision-making. The preview shown here is the exact document you’ll receive after purchase—fully formatted and ready to use. Professional structure, no placeholders, and immediate download upon checkout ensure you get the finished file as displayed.

Plan Smarter. Present Sharper. Compete Stronger.
Discover how political shifts, economic cycles, social trends, technological advances, legal changes, and environmental pressures are shaping Ultrafabrics Holdings' strategic outlook in our concise PESTLE snapshot. This analysis highlights immediate risks and growth levers to inform investment and planning decisions. Purchase the full PESTLE for a complete, actionable breakdown ready for boardrooms and strategy decks.
Political factors
Trade policy and tariffs
Import duties on chemicals and textiles (commonly ranging 0–12% with many applied tariffs near 8–10%) directly raise polyurethane input costs, compressing Ultrafabrics’ margin and pricing power; China supplies roughly 40% of global chemical production, so US–EU–Asia trade shifts can disrupt resin, pigment and additive flows. Preferential trade deals (e.g., CPTPP expansion, EU trade pacts) could open premium fabric markets, while rising protectionism extends lead times and forces larger inventory buffers.
Sustainability incentives
Government subsidies and tax credits in the EU and US increasingly favor low-carbon, bio-based and solvent-free PU processes, while EU Green Public Procurement criteria and similar national rules push sustainable materials into transport and healthcare supply chains; public procurement represents about 14% of EU GDP (European Commission), so compliance can unlock large aviation and civic furniture bids, whereas weak incentives slow ROI on green capex.
Geopolitical supply risk
Regional instability still disrupts petrochemical feedstocks and specialty chemicals, with Brent crude averaging about $86/bbl in 2024, driving feedstock price volatility for Ultrafabrics' polyurethane inputs. Export controls on advanced materials have tightened since 2022, compressing available isocyanate supply and raising premiums for limited suppliers. Firms are adopting multi-region sourcing and 3–6 months strategic inventories, while political risk insurance (typical premiums 0.5–2% of insured value) and nearshoring reduce supply shocks.
Sector-specific standards
- Aviation: fleet renewal cycles
- Automotive/EV: growing addressable market (~14M EVs 2023)
- Healthcare: procurement tied to $4.5T spend (US 2023)
- Defense/public transport: strict compliance, ~$858B US defense FY2024
Labor and industrial policy
Minimum wage shifts—federal $7.25/hr and state examples like California $16.00/hr—can alter Ultrafabrics manufacturing footprints and labor costs; state increases have driven some reshoring. Federal incentives such as the CHIPS and Science Act (about $52 billion for semiconductor/manufacturing support) and state grants spur automation investments. H‑1B cap remains 85,000, constraining access to specialized chemical/materials talent; regional cluster incentives steer site selection.
- Labor cost: federal $7.25/hr; CA $16.00/hr
- Incentives: CHIPS Act ≈ $52B for manufacturing
- Immigration: H‑1B cap 85,000
- Site choice: regional cluster grants influence location
Import duties, China's ~40% share and $86/bbl Brent squeeze PU margins; green subsidies drive shift
Import duties (0–12%, many 8–10%) and China’s ~40% share of chemical output raise PU input risk and margin pressure; trade shifts and protectionism increase lead times. EU/US green subsidies and 14% EU public procurement push sustainable PU adoption while Brent averaged ~$86/bbl in 2024, adding feedstock volatility. Market drivers: 14M EVs (2023), US healthcare $4.5T (2023), US defense $858B (FY2024); labor: fed $7.25, CA $16, H‑1B 85,000.
| Factor | Key stat |
|---|---|
| Import duties | 0–12% (many 8–10%) |
| China chemical share | ~40% |
| Brent 2024 | $86/bbl |
| EVs 2023 | ~14M |
What is included in the product
Detailed Word Document
Explores how Political, Economic, Social, Technological, Environmental, and Legal forces uniquely affect Ultrafabrics Holdings, using current market and regulatory data to identify industry-specific risks and opportunities; designed for executives and investors to inform strategy, scenario planning, and funding decisions.
Customizable Excel Spreadsheet
A concise, visually segmented PESTLE summary of Ultrafabrics Holdings that eases stakeholder alignment by distilling external risks and market drivers into shareable slides or meeting notes, while allowing quick annotation for region- or product-specific pain points during strategic planning sessions.
Economic factors
Cyclical end-markets
Automotive, aviation and furniture cycles create volume volatility for Ultrafabrics: global light-vehicle production ~80 million units (2024), global air passengers ~4.5 billion (2024) and US furniture sales ≈$130 billion (2024) drive demand swings. Airline retrofit and OEM build rates move with macro growth and travel demand, tying upholstery volumes to fleet deliveries and passenger traffic. Healthcare end-markets are more resilient, smoothing revenue during downturns. A balanced portfolio across these sectors reduces overall cyclicality.
Input cost inflation
Input cost inflation pressures margins through polyurethane feedstocks (MDI/TDI, polyols), pigments and energy costs. Brent averaged about 86 USD/bbl in 2024, and oil and gas swings cascade through to chemical pricing and feedstock volatility. Long-term contracts and hedging help stabilize COGS, while value-based pricing supported by product performance enables pass-through of increases.
FX and global sales mix
Multi-currency revenues and costs expose Ultrafabrics to exchange-rate moves; the US dollar's strength—DXY peaked near 114 in Sep 2022 before easing to around 103 by end-2023—can compress reported overseas sales when translated. Natural hedges from local sourcing and local-currency pricing mitigate volatility across its global mix. Treasury policies and use of forwards and options provide further protection.
Interest rates and capex
Higher rates (US fed funds ~5.25–5.50% mid‑2025) raise financing costs for Ultrafabrics plant upgrades and sustainability projects; constrained customer financing depresses OEM order books amid ~66M global light‑vehicle sales in 2024. Prioritizing high‑ROI automation and energy efficiency can cut payback to 2–4 years, while programs like the US Inflation Reduction Act (~$369bn) can offset capital intensity.
- Financing cost sensitivity: +1% rate increases WACC and capex hurdle
- OEM demand link: 2024 global LV sales ~66M
- Mitigation: 2–4y payback targets, IRA $369bn grants
Emerging market growth
Rising middle classes in APAC and LATAM are expanding demand for premium, durable upholstery—Emerging Asia GDP grew about 4.6% and Latin America about 2.5% in 2024 (IMF), supporting higher discretionary spend and premium furniture uptake. Local regulations and certification requirements force product tailoring and testing; regional partnerships speed channel entry while price tiering preserves brand equity and captures broader market segments.
- APAC growth 4.6% (2024, IMF)
- LATAM growth 2.5% (2024, IMF)
- Certifications required per local standards
- Regional partners accelerate penetration
- Price tiers protect brand, capture value
Import duties, China's ~40% share and $86/bbl Brent squeeze PU margins; green subsidies drive shift
Cyclical demand from automotive (~80M light vehicles 2024), aviation (~4.5B passengers 2024) and US furniture (~$130B 2024) drives volume volatility, while healthcare provides resilience. Input inflation (Brent ~$86/bbl 2024) and feedstock swings pressure margins; hedging and long‑term contracts mitigate. Higher rates (fed funds ~5.25–5.50% mid‑2025) raise capex cost; APAC/LATAM growth (4.6%/2.5% 2024 IMF) supports premium demand.
| Metric | 2024/2025 |
|---|---|
| Global LV production | ~80M (2024) |
| Air passengers | ~4.5B (2024) |
| US furniture sales | $130B (2024) |
| Brent oil | $86/bbl (2024) |
| Fed funds | ~5.25–5.50% (mid‑2025) |
| APAC/LATAM GDP | 4.6% / 2.5% (2024) |
Full Version Awaits
Ultrafabrics Holdings PESTLE Analysis
The Ultrafabrics Holdings PESTLE Analysis delivers concise political, economic, social, technological, legal and environmental insights tailored for strategic decision-making. The preview shown here is the exact document you’ll receive after purchase—fully formatted and ready to use. Professional structure, no placeholders, and immediate download upon checkout ensure you get the finished file as displayed.
Description
Plan Smarter. Present Sharper. Compete Stronger.
Discover how political shifts, economic cycles, social trends, technological advances, legal changes, and environmental pressures are shaping Ultrafabrics Holdings' strategic outlook in our concise PESTLE snapshot. This analysis highlights immediate risks and growth levers to inform investment and planning decisions. Purchase the full PESTLE for a complete, actionable breakdown ready for boardrooms and strategy decks.
Political factors
Trade policy and tariffs
Import duties on chemicals and textiles (commonly ranging 0–12% with many applied tariffs near 8–10%) directly raise polyurethane input costs, compressing Ultrafabrics’ margin and pricing power; China supplies roughly 40% of global chemical production, so US–EU–Asia trade shifts can disrupt resin, pigment and additive flows. Preferential trade deals (e.g., CPTPP expansion, EU trade pacts) could open premium fabric markets, while rising protectionism extends lead times and forces larger inventory buffers.
Sustainability incentives
Government subsidies and tax credits in the EU and US increasingly favor low-carbon, bio-based and solvent-free PU processes, while EU Green Public Procurement criteria and similar national rules push sustainable materials into transport and healthcare supply chains; public procurement represents about 14% of EU GDP (European Commission), so compliance can unlock large aviation and civic furniture bids, whereas weak incentives slow ROI on green capex.
Geopolitical supply risk
Regional instability still disrupts petrochemical feedstocks and specialty chemicals, with Brent crude averaging about $86/bbl in 2024, driving feedstock price volatility for Ultrafabrics' polyurethane inputs. Export controls on advanced materials have tightened since 2022, compressing available isocyanate supply and raising premiums for limited suppliers. Firms are adopting multi-region sourcing and 3–6 months strategic inventories, while political risk insurance (typical premiums 0.5–2% of insured value) and nearshoring reduce supply shocks.
Sector-specific standards
- Aviation: fleet renewal cycles
- Automotive/EV: growing addressable market (~14M EVs 2023)
- Healthcare: procurement tied to $4.5T spend (US 2023)
- Defense/public transport: strict compliance, ~$858B US defense FY2024
Labor and industrial policy
Minimum wage shifts—federal $7.25/hr and state examples like California $16.00/hr—can alter Ultrafabrics manufacturing footprints and labor costs; state increases have driven some reshoring. Federal incentives such as the CHIPS and Science Act (about $52 billion for semiconductor/manufacturing support) and state grants spur automation investments. H‑1B cap remains 85,000, constraining access to specialized chemical/materials talent; regional cluster incentives steer site selection.
- Labor cost: federal $7.25/hr; CA $16.00/hr
- Incentives: CHIPS Act ≈ $52B for manufacturing
- Immigration: H‑1B cap 85,000
- Site choice: regional cluster grants influence location
Import duties, China's ~40% share and $86/bbl Brent squeeze PU margins; green subsidies drive shift
Import duties (0–12%, many 8–10%) and China’s ~40% share of chemical output raise PU input risk and margin pressure; trade shifts and protectionism increase lead times. EU/US green subsidies and 14% EU public procurement push sustainable PU adoption while Brent averaged ~$86/bbl in 2024, adding feedstock volatility. Market drivers: 14M EVs (2023), US healthcare $4.5T (2023), US defense $858B (FY2024); labor: fed $7.25, CA $16, H‑1B 85,000.
| Factor | Key stat |
|---|---|
| Import duties | 0–12% (many 8–10%) |
| China chemical share | ~40% |
| Brent 2024 | $86/bbl |
| EVs 2023 | ~14M |
What is included in the product
Detailed Word Document
Explores how Political, Economic, Social, Technological, Environmental, and Legal forces uniquely affect Ultrafabrics Holdings, using current market and regulatory data to identify industry-specific risks and opportunities; designed for executives and investors to inform strategy, scenario planning, and funding decisions.
Customizable Excel Spreadsheet
A concise, visually segmented PESTLE summary of Ultrafabrics Holdings that eases stakeholder alignment by distilling external risks and market drivers into shareable slides or meeting notes, while allowing quick annotation for region- or product-specific pain points during strategic planning sessions.
Economic factors
Cyclical end-markets
Automotive, aviation and furniture cycles create volume volatility for Ultrafabrics: global light-vehicle production ~80 million units (2024), global air passengers ~4.5 billion (2024) and US furniture sales ≈$130 billion (2024) drive demand swings. Airline retrofit and OEM build rates move with macro growth and travel demand, tying upholstery volumes to fleet deliveries and passenger traffic. Healthcare end-markets are more resilient, smoothing revenue during downturns. A balanced portfolio across these sectors reduces overall cyclicality.
Input cost inflation
Input cost inflation pressures margins through polyurethane feedstocks (MDI/TDI, polyols), pigments and energy costs. Brent averaged about 86 USD/bbl in 2024, and oil and gas swings cascade through to chemical pricing and feedstock volatility. Long-term contracts and hedging help stabilize COGS, while value-based pricing supported by product performance enables pass-through of increases.
FX and global sales mix
Multi-currency revenues and costs expose Ultrafabrics to exchange-rate moves; the US dollar's strength—DXY peaked near 114 in Sep 2022 before easing to around 103 by end-2023—can compress reported overseas sales when translated. Natural hedges from local sourcing and local-currency pricing mitigate volatility across its global mix. Treasury policies and use of forwards and options provide further protection.
Interest rates and capex
Higher rates (US fed funds ~5.25–5.50% mid‑2025) raise financing costs for Ultrafabrics plant upgrades and sustainability projects; constrained customer financing depresses OEM order books amid ~66M global light‑vehicle sales in 2024. Prioritizing high‑ROI automation and energy efficiency can cut payback to 2–4 years, while programs like the US Inflation Reduction Act (~$369bn) can offset capital intensity.
- Financing cost sensitivity: +1% rate increases WACC and capex hurdle
- OEM demand link: 2024 global LV sales ~66M
- Mitigation: 2–4y payback targets, IRA $369bn grants
Emerging market growth
Rising middle classes in APAC and LATAM are expanding demand for premium, durable upholstery—Emerging Asia GDP grew about 4.6% and Latin America about 2.5% in 2024 (IMF), supporting higher discretionary spend and premium furniture uptake. Local regulations and certification requirements force product tailoring and testing; regional partnerships speed channel entry while price tiering preserves brand equity and captures broader market segments.
- APAC growth 4.6% (2024, IMF)
- LATAM growth 2.5% (2024, IMF)
- Certifications required per local standards
- Regional partners accelerate penetration
- Price tiers protect brand, capture value
Import duties, China's ~40% share and $86/bbl Brent squeeze PU margins; green subsidies drive shift
Cyclical demand from automotive (~80M light vehicles 2024), aviation (~4.5B passengers 2024) and US furniture (~$130B 2024) drives volume volatility, while healthcare provides resilience. Input inflation (Brent ~$86/bbl 2024) and feedstock swings pressure margins; hedging and long‑term contracts mitigate. Higher rates (fed funds ~5.25–5.50% mid‑2025) raise capex cost; APAC/LATAM growth (4.6%/2.5% 2024 IMF) supports premium demand.
| Metric | 2024/2025 |
|---|---|
| Global LV production | ~80M (2024) |
| Air passengers | ~4.5B (2024) |
| US furniture sales | $130B (2024) |
| Brent oil | $86/bbl (2024) |
| Fed funds | ~5.25–5.50% (mid‑2025) |
| APAC/LATAM GDP | 4.6% / 2.5% (2024) |
Full Version Awaits
Ultrafabrics Holdings PESTLE Analysis
The Ultrafabrics Holdings PESTLE Analysis delivers concise political, economic, social, technological, legal and environmental insights tailored for strategic decision-making. The preview shown here is the exact document you’ll receive after purchase—fully formatted and ready to use. Professional structure, no placeholders, and immediate download upon checkout ensure you get the finished file as displayed.











