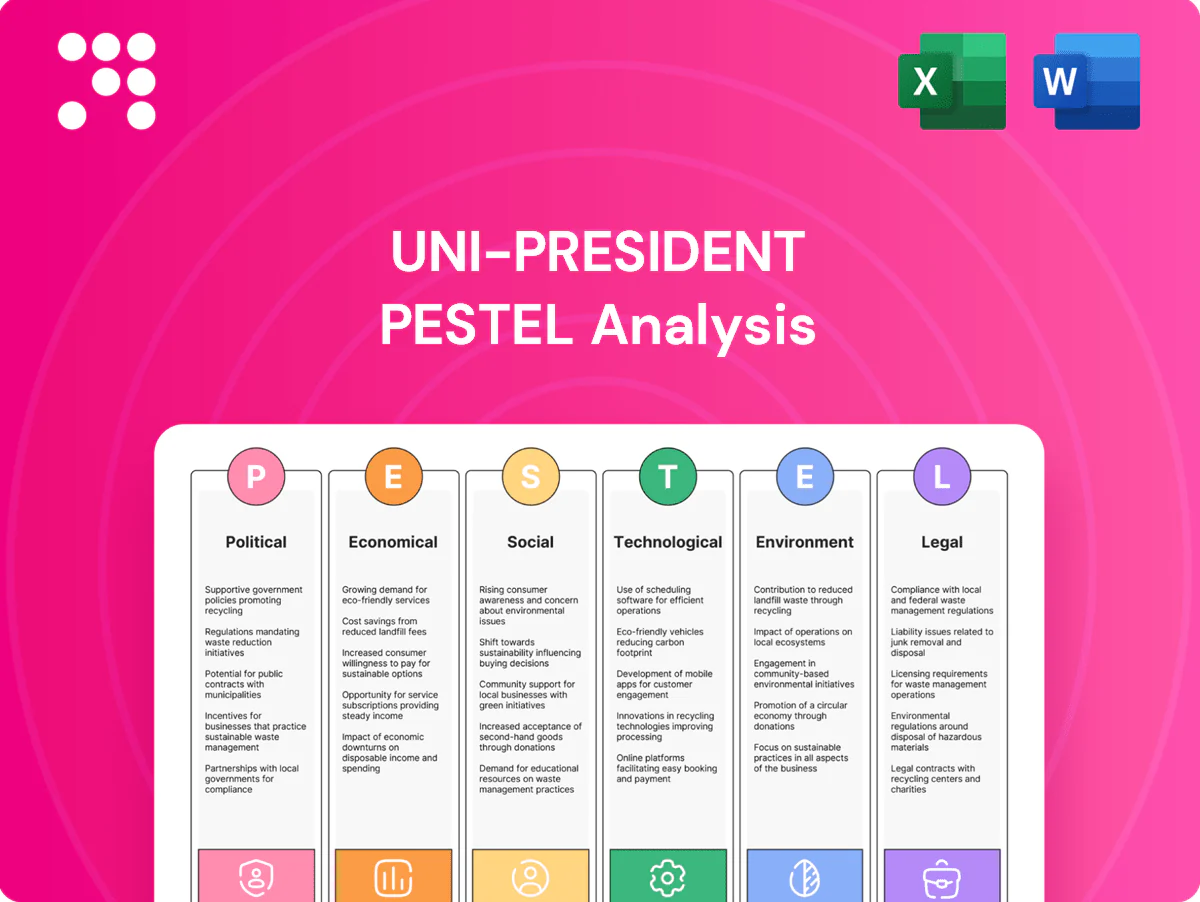
Uni-President PESTLE Analysis

Plan Smarter. Present Sharper. Compete Stronger.
Discover how political shifts, economic trends, social changes, technological advances, legal developments, and environmental pressures are shaping Uni‑President’s future. This concise PESTLE snapshot highlights risks and opportunities for investors and strategists. Purchase the full analysis to access the complete, actionable report and immediately apply insights to your decisions.
Political factors

Cross-strait relations and geopolitical risk
Heightened Taiwan–China tensions threaten Uni‑President’s sourcing, sales and logistics across the Strait given China/HK accounted for about 41% of Taiwan’s exports in 2023 (Taiwan MOF), so dual‑sourcing and inventory buffers are essential. Diplomatic shifts can disrupt Mainland licensing and distribution agreements, prompting increased political risk insurance and hedging for cross‑Strait operations.
Food and agri policy and subsidies
Government support for domestic agriculture (COA/MOA) directly affects Uni-President's input costs for grains, dairy and feed, with Taiwan's food self-sufficiency near 30% forcing reliance on imports. Shifts in import quotas or subsidies reshape pricing power across noodles, beverages and animal feed; recent tariff and subsidy adjustments have altered margins. Monitoring COA directives helps anticipate supply shocks and aligning with food-security goals can unlock incentives.

Trade tariffs and market access
RCEP, covering about 30% of world GDP, and CPTPP, which phases out tariffs on roughly 95% of tariff lines, reshape ingredient import costs and finished‑goods export access for Uni‑President. Tariff escalation can add single‑ to double‑digit percentage points to COGS, forcing reformulation or price hikes. Localizing production reduces tariff exposure and duty drag. Customs bottlenecks commonly cause delays of days to several weeks, risking seasonal launch timing.

Public health and food security directives
Pandemic readiness and contingency rules force Uni-President to adapt factories, cold chains and convenience-store operations; global food loss is ~33% (FAO) so cold-chain integrity is critical. Governments may mandate stockpiles of staples such as instant noodles and UHT beverages (UHT shelf life 6–12 months), raising inventory and compliance costs but reinforcing essential-supplier status. Clear crisis communications preserve brand trust and customer retention during disruptions.
- GHSI context: 2021 avg score 40.2 — drives national readiness updates
- FAO: ~33% food loss/waste — cold chain priority
- UHT shelf life 6–12 months — suitable for mandated stockpiles
Regional regulatory divergence
Operating across Taiwan, Mainland China and Southeast Asia (Vietnam, Thailand, Indonesia) forces Uni-President to manage divergent labeling, additive and retail rules, increasing compliance complexity and SKU fragmentation. Local regulatory relationships in each market accelerate approvals and market entry, while central governance and standardized quality controls reduce penalties and recall risks. Fragmentation drives higher logistics and reporting costs.
- Markets: Taiwan, Mainland China, Vietnam, Thailand, Indonesia
- Risk: SKU proliferation and compliance complexity
- Mitigation: local regulatory ties speed approvals
- Control: central governance lowers penalties/recalls
Taiwan–China tensions threaten supply chains; China/HK 41% export share
Heightened Taiwan–China tensions threaten cross‑Strait sourcing and sales; China/HK = ~41% of Taiwan exports (2023 MOF), prompting dual‑sourcing and political risk insurance.
Taiwan food self‑sufficiency ≈30% increases import exposure for grains/dairy; COA subsidy/quota shifts materially affect COGS and margins.
RCEP (~30% global GDP) and CPTPP tariff cuts reshape input costs; customs delays and SKU fragmentation elevate compliance and logistics expenses.
| Metric | Value |
|---|---|
| China/HK share (2023) | 41% |
| Taiwan food self‑sufficiency | ~30% |
| Global GDP in RCEP | ~30% |
What is included in the product
 Detailed Word Document
Explores how macro-environmental factors uniquely affect Uni‑President across Political, Economic, Social, Technological, Environmental and Legal dimensions, with data‑backed insights tied to its regional food & retail operations. Designed for executives and investors, the analysis is forward‑looking, reflects current market and regulatory dynamics, and is formatted for direct use in plans, decks, or reports.

 Customizable Excel Spreadsheet
A concise, visually segmented Uni‑President PESTLE summary that’s presentation-ready, easily shareable, and editable for local context—ideal for quick alignment in meetings and strategy sessions.
Economic factors

Consumer spending and inflation
Food inflation has shifted demand toward value packs and private labels, with the FAO Food Price Index averaging 114.3 in 2024, still above pre-2020 levels. Passing through costs risks volume loss in convenience retail, prompting Uni-President to limit price increases. Menu engineering and pack-price architecture protect margins. Hedging and procurement timing are used to smooth commodity volatility.
Commodity and FX volatility
Grain, palm oil, dairy, sugar and PET resin swings remain the largest drivers of Uni-President’s COGS, with raw-materials typically representing roughly 55–65% of input costs; palm oil and PET saw elevated volatility through 2023–24. FX moves versus the USD (TWD/US$ shifts and other regional currencies) affect imported inputs and offshore earnings translation. Structured hedges and long-term supplier contracts have materially reduced cost variability. Reformulation and lightweighting further lower exposure to commodity and resin price swings.

Channel mix and urban convenience
7‑Eleven–style convenience stores capture impulse and on‑the‑go demand with higher gross margins (typically 25–35% vs supermarkets 15–25%), lifting basket size through mission‑based assortment optimization; impulse items can represent 30–40% of transactions. Economic slowdowns shift traffic to supermarkets and e‑commerce (global e‑commerce ~20% of retail in 2023–24), while proximity logistics cut last‑mile cost (last‑mile ≈53% of fulfillment cost), improving unit economics.

Mainland China growth and competition
Mainland China offers a 1.41 billion population addressable market for beverages and instant foods, with per‑capita instant‑noodle consumption about 37 packs/year (2023). Intense local competition and recurring price wars compress margins where clear brand moats are absent. Tiered‑city strategies and localized flavors improve share, while partnerships and e‑commerce (online retail ≈30% of sales in 2023) extend distribution reach.
Pet food and feed cycle sensitivity
Pet humanization sustains premium pet food demand even in downturns; US pet industry spending reached USD 136.8 billion in 2022 (APPA), underscoring resilience. Animal feed volumes track livestock cycles and farm profitability, with global feed production ≈1.2 billion tonnes in 2022 (FAO). Diversified pet/feed portfolio and flexible capacity help smooth cyclical swings and protect utilization.
- Premium pet food growth — resilient demand (US pet spend USD 136.8B, 2022)
- Feed cyclical exposure — tied to livestock profitability (global feed ≈1.2B t, 2022)
- Diversification — balances revenue volatility
- Capacity flexibility — preserves utilization rates
Taiwan–China tensions threaten supply chains; China/HK 41% export share
Food inflation (FAO FPI 114.3 in 2024) and FX drive input cost swings; commodities (grain, palm, dairy, sugar, PET) are ~55–65% of COGS, forcing limited price pass‑through, hedging and SKU/pricing strategies. Convenience margins (25–35%) lift basket value but are volume‑sensitive in slowdowns; e‑commerce ~30% (2023) boosts reach. China (1.41B; 37 packs/yr instant noodles, 2023) and premium pet demand (US pet spend 136.8B, 2022) offer growth levers.
| Metric | Value |
|---|---|
| FAO Food Price Index (2024) | 114.3 |
| Raw materials of COGS | 55–65% |
| Convenience gross margin | 25–35% |
| China population / noodles | 1.41B / 37 pkgs/yr (2023) |
| Online retail share (2023) | ~30% |
| US pet spend (2022) | USD 136.8B |
Full Version Awaits
Uni-President PESTLE Analysis
The preview shown here is the exact Uni-President PESTLE Analysis document you’ll receive after purchase—fully formatted and ready to use. The layout, content, and structure visible are identical to the downloadable file, with no placeholders or teasers. After payment you’ll instantly get this professional, final report for immediate analysis and presentation.

Plan Smarter. Present Sharper. Compete Stronger.
Discover how political shifts, economic trends, social changes, technological advances, legal developments, and environmental pressures are shaping Uni‑President’s future. This concise PESTLE snapshot highlights risks and opportunities for investors and strategists. Purchase the full analysis to access the complete, actionable report and immediately apply insights to your decisions.
Political factors
Cross-strait relations and geopolitical risk
Heightened Taiwan–China tensions threaten Uni‑President’s sourcing, sales and logistics across the Strait given China/HK accounted for about 41% of Taiwan’s exports in 2023 (Taiwan MOF), so dual‑sourcing and inventory buffers are essential. Diplomatic shifts can disrupt Mainland licensing and distribution agreements, prompting increased political risk insurance and hedging for cross‑Strait operations.
Food and agri policy and subsidies
Government support for domestic agriculture (COA/MOA) directly affects Uni-President's input costs for grains, dairy and feed, with Taiwan's food self-sufficiency near 30% forcing reliance on imports. Shifts in import quotas or subsidies reshape pricing power across noodles, beverages and animal feed; recent tariff and subsidy adjustments have altered margins. Monitoring COA directives helps anticipate supply shocks and aligning with food-security goals can unlock incentives.
Trade tariffs and market access
RCEP, covering about 30% of world GDP, and CPTPP, which phases out tariffs on roughly 95% of tariff lines, reshape ingredient import costs and finished‑goods export access for Uni‑President. Tariff escalation can add single‑ to double‑digit percentage points to COGS, forcing reformulation or price hikes. Localizing production reduces tariff exposure and duty drag. Customs bottlenecks commonly cause delays of days to several weeks, risking seasonal launch timing.
Public health and food security directives
Pandemic readiness and contingency rules force Uni-President to adapt factories, cold chains and convenience-store operations; global food loss is ~33% (FAO) so cold-chain integrity is critical. Governments may mandate stockpiles of staples such as instant noodles and UHT beverages (UHT shelf life 6–12 months), raising inventory and compliance costs but reinforcing essential-supplier status. Clear crisis communications preserve brand trust and customer retention during disruptions.
- GHSI context: 2021 avg score 40.2 — drives national readiness updates
- FAO: ~33% food loss/waste — cold chain priority
- UHT shelf life 6–12 months — suitable for mandated stockpiles
Regional regulatory divergence
Operating across Taiwan, Mainland China and Southeast Asia (Vietnam, Thailand, Indonesia) forces Uni-President to manage divergent labeling, additive and retail rules, increasing compliance complexity and SKU fragmentation. Local regulatory relationships in each market accelerate approvals and market entry, while central governance and standardized quality controls reduce penalties and recall risks. Fragmentation drives higher logistics and reporting costs.
- Markets: Taiwan, Mainland China, Vietnam, Thailand, Indonesia
- Risk: SKU proliferation and compliance complexity
- Mitigation: local regulatory ties speed approvals
- Control: central governance lowers penalties/recalls
Taiwan–China tensions threaten supply chains; China/HK 41% export share
Heightened Taiwan–China tensions threaten cross‑Strait sourcing and sales; China/HK = ~41% of Taiwan exports (2023 MOF), prompting dual‑sourcing and political risk insurance.
Taiwan food self‑sufficiency ≈30% increases import exposure for grains/dairy; COA subsidy/quota shifts materially affect COGS and margins.
RCEP (~30% global GDP) and CPTPP tariff cuts reshape input costs; customs delays and SKU fragmentation elevate compliance and logistics expenses.
| Metric | Value |
|---|---|
| China/HK share (2023) | 41% |
| Taiwan food self‑sufficiency | ~30% |
| Global GDP in RCEP | ~30% |
What is included in the product
Detailed Word Document
Explores how macro-environmental factors uniquely affect Uni‑President across Political, Economic, Social, Technological, Environmental and Legal dimensions, with data‑backed insights tied to its regional food & retail operations. Designed for executives and investors, the analysis is forward‑looking, reflects current market and regulatory dynamics, and is formatted for direct use in plans, decks, or reports.
Customizable Excel Spreadsheet
A concise, visually segmented Uni‑President PESTLE summary that’s presentation-ready, easily shareable, and editable for local context—ideal for quick alignment in meetings and strategy sessions.
Economic factors
Consumer spending and inflation
Food inflation has shifted demand toward value packs and private labels, with the FAO Food Price Index averaging 114.3 in 2024, still above pre-2020 levels. Passing through costs risks volume loss in convenience retail, prompting Uni-President to limit price increases. Menu engineering and pack-price architecture protect margins. Hedging and procurement timing are used to smooth commodity volatility.
Commodity and FX volatility
Grain, palm oil, dairy, sugar and PET resin swings remain the largest drivers of Uni-President’s COGS, with raw-materials typically representing roughly 55–65% of input costs; palm oil and PET saw elevated volatility through 2023–24. FX moves versus the USD (TWD/US$ shifts and other regional currencies) affect imported inputs and offshore earnings translation. Structured hedges and long-term supplier contracts have materially reduced cost variability. Reformulation and lightweighting further lower exposure to commodity and resin price swings.
Channel mix and urban convenience
7‑Eleven–style convenience stores capture impulse and on‑the‑go demand with higher gross margins (typically 25–35% vs supermarkets 15–25%), lifting basket size through mission‑based assortment optimization; impulse items can represent 30–40% of transactions. Economic slowdowns shift traffic to supermarkets and e‑commerce (global e‑commerce ~20% of retail in 2023–24), while proximity logistics cut last‑mile cost (last‑mile ≈53% of fulfillment cost), improving unit economics.
Mainland China growth and competition
Mainland China offers a 1.41 billion population addressable market for beverages and instant foods, with per‑capita instant‑noodle consumption about 37 packs/year (2023). Intense local competition and recurring price wars compress margins where clear brand moats are absent. Tiered‑city strategies and localized flavors improve share, while partnerships and e‑commerce (online retail ≈30% of sales in 2023) extend distribution reach.
Pet food and feed cycle sensitivity
Pet humanization sustains premium pet food demand even in downturns; US pet industry spending reached USD 136.8 billion in 2022 (APPA), underscoring resilience. Animal feed volumes track livestock cycles and farm profitability, with global feed production ≈1.2 billion tonnes in 2022 (FAO). Diversified pet/feed portfolio and flexible capacity help smooth cyclical swings and protect utilization.
- Premium pet food growth — resilient demand (US pet spend USD 136.8B, 2022)
- Feed cyclical exposure — tied to livestock profitability (global feed ≈1.2B t, 2022)
- Diversification — balances revenue volatility
- Capacity flexibility — preserves utilization rates
Taiwan–China tensions threaten supply chains; China/HK 41% export share
Food inflation (FAO FPI 114.3 in 2024) and FX drive input cost swings; commodities (grain, palm, dairy, sugar, PET) are ~55–65% of COGS, forcing limited price pass‑through, hedging and SKU/pricing strategies. Convenience margins (25–35%) lift basket value but are volume‑sensitive in slowdowns; e‑commerce ~30% (2023) boosts reach. China (1.41B; 37 packs/yr instant noodles, 2023) and premium pet demand (US pet spend 136.8B, 2022) offer growth levers.
| Metric | Value |
|---|---|
| FAO Food Price Index (2024) | 114.3 |
| Raw materials of COGS | 55–65% |
| Convenience gross margin | 25–35% |
| China population / noodles | 1.41B / 37 pkgs/yr (2023) |
| Online retail share (2023) | ~30% |
| US pet spend (2022) | USD 136.8B |
Full Version Awaits
Uni-President PESTLE Analysis
The preview shown here is the exact Uni-President PESTLE Analysis document you’ll receive after purchase—fully formatted and ready to use. The layout, content, and structure visible are identical to the downloadable file, with no placeholders or teasers. After payment you’ll instantly get this professional, final report for immediate analysis and presentation.
Description
Plan Smarter. Present Sharper. Compete Stronger.
Discover how political shifts, economic trends, social changes, technological advances, legal developments, and environmental pressures are shaping Uni‑President’s future. This concise PESTLE snapshot highlights risks and opportunities for investors and strategists. Purchase the full analysis to access the complete, actionable report and immediately apply insights to your decisions.
Political factors
Cross-strait relations and geopolitical risk
Heightened Taiwan–China tensions threaten Uni‑President’s sourcing, sales and logistics across the Strait given China/HK accounted for about 41% of Taiwan’s exports in 2023 (Taiwan MOF), so dual‑sourcing and inventory buffers are essential. Diplomatic shifts can disrupt Mainland licensing and distribution agreements, prompting increased political risk insurance and hedging for cross‑Strait operations.
Food and agri policy and subsidies
Government support for domestic agriculture (COA/MOA) directly affects Uni-President's input costs for grains, dairy and feed, with Taiwan's food self-sufficiency near 30% forcing reliance on imports. Shifts in import quotas or subsidies reshape pricing power across noodles, beverages and animal feed; recent tariff and subsidy adjustments have altered margins. Monitoring COA directives helps anticipate supply shocks and aligning with food-security goals can unlock incentives.
Trade tariffs and market access
RCEP, covering about 30% of world GDP, and CPTPP, which phases out tariffs on roughly 95% of tariff lines, reshape ingredient import costs and finished‑goods export access for Uni‑President. Tariff escalation can add single‑ to double‑digit percentage points to COGS, forcing reformulation or price hikes. Localizing production reduces tariff exposure and duty drag. Customs bottlenecks commonly cause delays of days to several weeks, risking seasonal launch timing.
Public health and food security directives
Pandemic readiness and contingency rules force Uni-President to adapt factories, cold chains and convenience-store operations; global food loss is ~33% (FAO) so cold-chain integrity is critical. Governments may mandate stockpiles of staples such as instant noodles and UHT beverages (UHT shelf life 6–12 months), raising inventory and compliance costs but reinforcing essential-supplier status. Clear crisis communications preserve brand trust and customer retention during disruptions.
- GHSI context: 2021 avg score 40.2 — drives national readiness updates
- FAO: ~33% food loss/waste — cold chain priority
- UHT shelf life 6–12 months — suitable for mandated stockpiles
Regional regulatory divergence
Operating across Taiwan, Mainland China and Southeast Asia (Vietnam, Thailand, Indonesia) forces Uni-President to manage divergent labeling, additive and retail rules, increasing compliance complexity and SKU fragmentation. Local regulatory relationships in each market accelerate approvals and market entry, while central governance and standardized quality controls reduce penalties and recall risks. Fragmentation drives higher logistics and reporting costs.
- Markets: Taiwan, Mainland China, Vietnam, Thailand, Indonesia
- Risk: SKU proliferation and compliance complexity
- Mitigation: local regulatory ties speed approvals
- Control: central governance lowers penalties/recalls
Taiwan–China tensions threaten supply chains; China/HK 41% export share
Heightened Taiwan–China tensions threaten cross‑Strait sourcing and sales; China/HK = ~41% of Taiwan exports (2023 MOF), prompting dual‑sourcing and political risk insurance.
Taiwan food self‑sufficiency ≈30% increases import exposure for grains/dairy; COA subsidy/quota shifts materially affect COGS and margins.
RCEP (~30% global GDP) and CPTPP tariff cuts reshape input costs; customs delays and SKU fragmentation elevate compliance and logistics expenses.
| Metric | Value |
|---|---|
| China/HK share (2023) | 41% |
| Taiwan food self‑sufficiency | ~30% |
| Global GDP in RCEP | ~30% |
What is included in the product
Detailed Word Document
Explores how macro-environmental factors uniquely affect Uni‑President across Political, Economic, Social, Technological, Environmental and Legal dimensions, with data‑backed insights tied to its regional food & retail operations. Designed for executives and investors, the analysis is forward‑looking, reflects current market and regulatory dynamics, and is formatted for direct use in plans, decks, or reports.
Customizable Excel Spreadsheet
A concise, visually segmented Uni‑President PESTLE summary that’s presentation-ready, easily shareable, and editable for local context—ideal for quick alignment in meetings and strategy sessions.
Economic factors
Consumer spending and inflation
Food inflation has shifted demand toward value packs and private labels, with the FAO Food Price Index averaging 114.3 in 2024, still above pre-2020 levels. Passing through costs risks volume loss in convenience retail, prompting Uni-President to limit price increases. Menu engineering and pack-price architecture protect margins. Hedging and procurement timing are used to smooth commodity volatility.
Commodity and FX volatility
Grain, palm oil, dairy, sugar and PET resin swings remain the largest drivers of Uni-President’s COGS, with raw-materials typically representing roughly 55–65% of input costs; palm oil and PET saw elevated volatility through 2023–24. FX moves versus the USD (TWD/US$ shifts and other regional currencies) affect imported inputs and offshore earnings translation. Structured hedges and long-term supplier contracts have materially reduced cost variability. Reformulation and lightweighting further lower exposure to commodity and resin price swings.
Channel mix and urban convenience
7‑Eleven–style convenience stores capture impulse and on‑the‑go demand with higher gross margins (typically 25–35% vs supermarkets 15–25%), lifting basket size through mission‑based assortment optimization; impulse items can represent 30–40% of transactions. Economic slowdowns shift traffic to supermarkets and e‑commerce (global e‑commerce ~20% of retail in 2023–24), while proximity logistics cut last‑mile cost (last‑mile ≈53% of fulfillment cost), improving unit economics.
Mainland China growth and competition
Mainland China offers a 1.41 billion population addressable market for beverages and instant foods, with per‑capita instant‑noodle consumption about 37 packs/year (2023). Intense local competition and recurring price wars compress margins where clear brand moats are absent. Tiered‑city strategies and localized flavors improve share, while partnerships and e‑commerce (online retail ≈30% of sales in 2023) extend distribution reach.
Pet food and feed cycle sensitivity
Pet humanization sustains premium pet food demand even in downturns; US pet industry spending reached USD 136.8 billion in 2022 (APPA), underscoring resilience. Animal feed volumes track livestock cycles and farm profitability, with global feed production ≈1.2 billion tonnes in 2022 (FAO). Diversified pet/feed portfolio and flexible capacity help smooth cyclical swings and protect utilization.
- Premium pet food growth — resilient demand (US pet spend USD 136.8B, 2022)
- Feed cyclical exposure — tied to livestock profitability (global feed ≈1.2B t, 2022)
- Diversification — balances revenue volatility
- Capacity flexibility — preserves utilization rates
Taiwan–China tensions threaten supply chains; China/HK 41% export share
Food inflation (FAO FPI 114.3 in 2024) and FX drive input cost swings; commodities (grain, palm, dairy, sugar, PET) are ~55–65% of COGS, forcing limited price pass‑through, hedging and SKU/pricing strategies. Convenience margins (25–35%) lift basket value but are volume‑sensitive in slowdowns; e‑commerce ~30% (2023) boosts reach. China (1.41B; 37 packs/yr instant noodles, 2023) and premium pet demand (US pet spend 136.8B, 2022) offer growth levers.
| Metric | Value |
|---|---|
| FAO Food Price Index (2024) | 114.3 |
| Raw materials of COGS | 55–65% |
| Convenience gross margin | 25–35% |
| China population / noodles | 1.41B / 37 pkgs/yr (2023) |
| Online retail share (2023) | ~30% |
| US pet spend (2022) | USD 136.8B |
Full Version Awaits
Uni-President PESTLE Analysis
The preview shown here is the exact Uni-President PESTLE Analysis document you’ll receive after purchase—fully formatted and ready to use. The layout, content, and structure visible are identical to the downloadable file, with no placeholders or teasers. After payment you’ll instantly get this professional, final report for immediate analysis and presentation.











