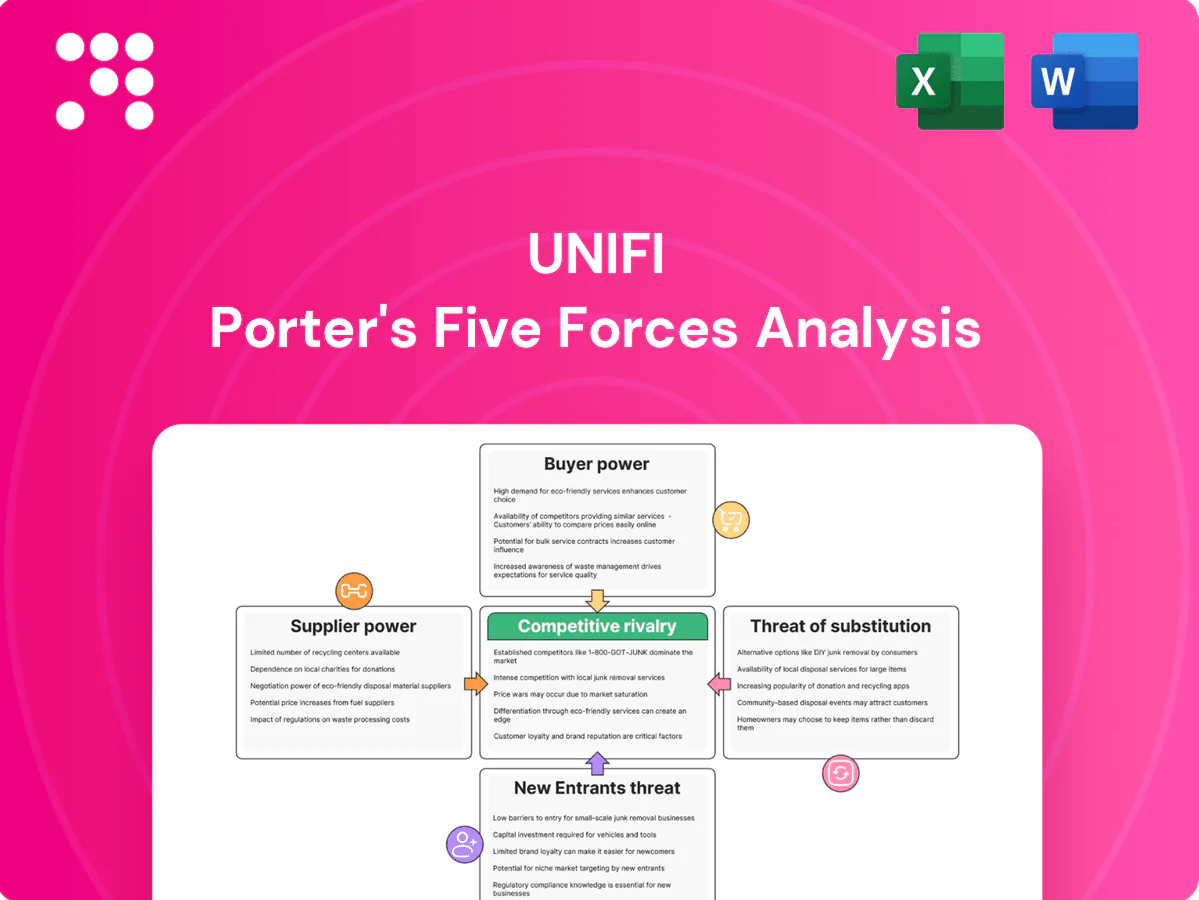
Unifi Porter's Five Forces Analysis

Go Beyond the Preview—Access the Full Strategic Report
Unifi faces shifting supplier dynamics, evolving buyer expectations, and persistent substitute threats that shape its competitive landscape; this brief snapshot highlights key pressures but stops short of force-by-force detail. The full Porter's Five Forces Analysis decodes intensity, implications, and strategic options. Unlock the complete report for visuals, ratings, and actionable insights tailored to Unifi.
Suppliers Bargaining Power

Concentrated rPET feedstock sources
Concentrated rPET feedstock sources give bottle suppliers, MRFs and aggregators—often regionally dominant—pricing and quality leverage over Unifi, especially during high-collection seasons when supply tightness increases supplier power. Long-term contracts and third-party certifications (e.g., ISCC, GRS) partially mitigate this risk. Geographic diversification of sourcing reduces exposure to single-supplier disruptions.
Volatile petrochemical inputs
Petrochemical inputs such as PTA/MEG and additives link Unifi costs to oil and chemical cycles—Brent averaged about $86/bbl in 2024 and MEG/PTA spots swung roughly 20–35% that year—allowing suppliers to pass costs through quickly. Price surges can compress Unifi margins if customer pass-through lags. Hedging and indexed contracts cut but do not eliminate exposure; multi-sourcing improves negotiation leverage.

Energy and utilities intensity
Fiber extrusion and recycling are highly energy-intensive, making utilities a key cost driver; US industrial electricity averaged about $0.08/kWh in 2024 (EIA), materially affecting unit economics and demand-charge exposure. Regional pricing and demand charges can swing margins, while corporate renewable PPAs averaged roughly $20–$30/MWh in 2024, helping stabilize rates and bolster ESG claims. Grid reliability (outage minutes per customer) directly impacts uptime and yield.

Specialty additives and colorants
High-spec additives and colorants exert strong supplier power for Unifi because niche producers dominate specialty masterbatches; 2024 industry surveys show qualification cycles average 9–12 months, increasing dependency and switching frictions. Consistency requirements and long validation timelines raise the cost of supplier changes, while volume commitments in 2024 deals often secured discounts of 5–15% in exchange for assured supply. Co-development agreements in 2024 transactions frequently included multi-year exclusivity, locking mutual value but raising switching costs further.
- Qualification cycles: 9–12 months (2024)
- Volume discounts commonly 5–15% (2024)
- Co-development often multi-year exclusivity (2024)
Equipment and maintenance OEMs
Equipment and maintenance OEMs for extrusion, filtration and recycling lines control critical spares and upgrades, with aftermarket parts and service margins often exceeding 50% (2024 industry data), creating vendor lock-in and pricing power. Proprietary components and limited second-source parts for specialized machinery raise switching costs and elevate downtime risk. Preventive maintenance contracts reduce unplanned outages but add recurring cost and dependency on OEM service networks.
- Critical spares concentration
- Proprietary component lock-in
- High aftermarket margins (2024)
- Limited second-source parts
- Preventive maintenance trade-off
Suppliers wield pricing power amid rPET concentration and energy-linked commodity swings
Suppliers hold moderate-to-high bargaining power: concentrated rPET, specialty additives and OEM spares create switching costs and service lock-in; PTA/MEG and energy tie costs to commodity cycles (Brent ~$86/bbl in 2024; US industrial electricity ~$0.08/kWh in 2024). Long-term contracts, hedges and multi-sourcing mitigate but do not eliminate price pass-through and margin risk.
| Factor | 2024 Metric |
|---|---|
| Brent | $86/bbl |
| US industrial electricity | $0.08/kWh |
| Qualification cycles | 9–12 months |
| Volume discounts | 5–15% |
| Aftermarket margins | >50% |
What is included in the product
 Detailed Word Document
Comprehensive Porter's Five Forces analysis tailored exclusively for Unifi, uncovering competitive drivers, supplier and buyer power, entry barriers, substitutes, and emerging disruptive threats; includes industry data, strategic commentary, and editable Word format for seamless use in investor materials or strategy decks.

 Customizable Excel Spreadsheet
One-sheet Unifi Porter’s Five Forces that turns complex competitive analysis into instant clarity—customize pressure levels, swap in your data, and visualize strategic threats with a ready-to-use spider chart for decks or decision-making.
Customers Bargaining Power

Concentrated global brands
Large apparel, footwear and auto OEMs buy at scale and negotiate aggressively, leveraging concentrated purchasing to extract concessions; the global apparel market was about $1.7 trillion in 2024. Approved-vendor lists raise supplier switching costs while centralizing buyer power, enabling demands for price cuts, extended payment terms and detailed sustainability data. Losing one marquee account can materially dent volumes and margins for suppliers.
Price sensitivity amid demand cycles
End markets are cyclical and in downturns (2024) brands pressure suppliers for cost-downs, compressing rPET-to-virgin spreads and driving buyers to compare rPET with alternative fibers. Index-linked pricing introduced in 2023–24 caps spot volatility but keeps buyer leverage via formula resets. Promotions and annual tenders amplify competition, often forcing double-digit percentage concessions.

Specification and quality demands
Brands in 2024 demand tight specs, traceability and certifications like GRS, creating stringent qualification gates that give buyers leverage and make failure to meet specs a delisting risk. Unifi’s REPREVE traceability documents recycled content and chain-of-custody, helping defend value and reduce pure price haggling. Co-developed products further embed Unifi in buyer programs, raising switching costs and deepening strategic partnerships.

Switching costs are moderate
Qualified alternatives from global fiber peers keep switching costs manageable; line trials, color matching and approvals typically prolong switches (proof-of-concept 4–12 weeks), while multi-sourcing policies reduce single-supplier dependence; differentiated sustainability storytelling can raise perceived switching barriers.
- Qualified alternatives: global fiber peers
- Trials & approvals: 4–12 weeks
- Multi-sourcing: limits supplier risk
- Sustainability storytelling: increases perceived lock-in
ESG and transparency requirements
Buyers increasingly mandate recycled-content verification and lifecycle data, driven by 2024 regulations such as the EU CSRD now covering roughly 50,000 companies; this raises compliance costs and strengthens buyer leverage over suppliers lacking chain-of-custody documentation. Unifi’s Repreve brand equity and documented traceability can offset some pressure, but failure to document often forfeits orders from major retailers.
- Buyers mandate verification — raises supplier compliance costs
- EU CSRD (2024) ~50,000 firms — amplifies reporting demands
- Unifi brand equity helps but documentation is decisive
OEM buying power squeezes margins; index pricing limits spot upside, trials raise switching costs
Large OEMs exert strong leverage via concentrated buying (global apparel ~$1.7T in 2024), forcing price, payment and sustainability concessions; losing a marquee account materially hurts volumes. Index-linked pricing (2023–24) limits spot upside while annual tenders and promotions drive double-digit concessions. Repreve traceability and co-development raise switching costs despite 4–12 week trial windows.
| Metric | 2024 |
|---|---|
| Global apparel market | $1.7T |
| EU CSRD firms | ~50,000 |
| Trials & approvals | 4–12 weeks |
Preview the Actual Deliverable
Unifi Porter's Five Forces Analysis
This preview shows the exact Unifi Porter's Five Forces Analysis you'll receive immediately after purchase—no surprises, no placeholders. The file is fully formatted, professionally written, and ready for download and use the moment you buy. You're viewing the final deliverable; instant access is granted upon payment.

Go Beyond the Preview—Access the Full Strategic Report
Unifi faces shifting supplier dynamics, evolving buyer expectations, and persistent substitute threats that shape its competitive landscape; this brief snapshot highlights key pressures but stops short of force-by-force detail. The full Porter's Five Forces Analysis decodes intensity, implications, and strategic options. Unlock the complete report for visuals, ratings, and actionable insights tailored to Unifi.
Suppliers Bargaining Power
Concentrated rPET feedstock sources
Concentrated rPET feedstock sources give bottle suppliers, MRFs and aggregators—often regionally dominant—pricing and quality leverage over Unifi, especially during high-collection seasons when supply tightness increases supplier power. Long-term contracts and third-party certifications (e.g., ISCC, GRS) partially mitigate this risk. Geographic diversification of sourcing reduces exposure to single-supplier disruptions.
Volatile petrochemical inputs
Petrochemical inputs such as PTA/MEG and additives link Unifi costs to oil and chemical cycles—Brent averaged about $86/bbl in 2024 and MEG/PTA spots swung roughly 20–35% that year—allowing suppliers to pass costs through quickly. Price surges can compress Unifi margins if customer pass-through lags. Hedging and indexed contracts cut but do not eliminate exposure; multi-sourcing improves negotiation leverage.
Energy and utilities intensity
Fiber extrusion and recycling are highly energy-intensive, making utilities a key cost driver; US industrial electricity averaged about $0.08/kWh in 2024 (EIA), materially affecting unit economics and demand-charge exposure. Regional pricing and demand charges can swing margins, while corporate renewable PPAs averaged roughly $20–$30/MWh in 2024, helping stabilize rates and bolster ESG claims. Grid reliability (outage minutes per customer) directly impacts uptime and yield.
Specialty additives and colorants
High-spec additives and colorants exert strong supplier power for Unifi because niche producers dominate specialty masterbatches; 2024 industry surveys show qualification cycles average 9–12 months, increasing dependency and switching frictions. Consistency requirements and long validation timelines raise the cost of supplier changes, while volume commitments in 2024 deals often secured discounts of 5–15% in exchange for assured supply. Co-development agreements in 2024 transactions frequently included multi-year exclusivity, locking mutual value but raising switching costs further.
- Qualification cycles: 9–12 months (2024)
- Volume discounts commonly 5–15% (2024)
- Co-development often multi-year exclusivity (2024)
Equipment and maintenance OEMs
Equipment and maintenance OEMs for extrusion, filtration and recycling lines control critical spares and upgrades, with aftermarket parts and service margins often exceeding 50% (2024 industry data), creating vendor lock-in and pricing power. Proprietary components and limited second-source parts for specialized machinery raise switching costs and elevate downtime risk. Preventive maintenance contracts reduce unplanned outages but add recurring cost and dependency on OEM service networks.
- Critical spares concentration
- Proprietary component lock-in
- High aftermarket margins (2024)
- Limited second-source parts
- Preventive maintenance trade-off
Suppliers wield pricing power amid rPET concentration and energy-linked commodity swings
Suppliers hold moderate-to-high bargaining power: concentrated rPET, specialty additives and OEM spares create switching costs and service lock-in; PTA/MEG and energy tie costs to commodity cycles (Brent ~$86/bbl in 2024; US industrial electricity ~$0.08/kWh in 2024). Long-term contracts, hedges and multi-sourcing mitigate but do not eliminate price pass-through and margin risk.
| Factor | 2024 Metric |
|---|---|
| Brent | $86/bbl |
| US industrial electricity | $0.08/kWh |
| Qualification cycles | 9–12 months |
| Volume discounts | 5–15% |
| Aftermarket margins | >50% |
What is included in the product
Detailed Word Document
Comprehensive Porter's Five Forces analysis tailored exclusively for Unifi, uncovering competitive drivers, supplier and buyer power, entry barriers, substitutes, and emerging disruptive threats; includes industry data, strategic commentary, and editable Word format for seamless use in investor materials or strategy decks.
Customizable Excel Spreadsheet
One-sheet Unifi Porter’s Five Forces that turns complex competitive analysis into instant clarity—customize pressure levels, swap in your data, and visualize strategic threats with a ready-to-use spider chart for decks or decision-making.
Customers Bargaining Power
Concentrated global brands
Large apparel, footwear and auto OEMs buy at scale and negotiate aggressively, leveraging concentrated purchasing to extract concessions; the global apparel market was about $1.7 trillion in 2024. Approved-vendor lists raise supplier switching costs while centralizing buyer power, enabling demands for price cuts, extended payment terms and detailed sustainability data. Losing one marquee account can materially dent volumes and margins for suppliers.
Price sensitivity amid demand cycles
End markets are cyclical and in downturns (2024) brands pressure suppliers for cost-downs, compressing rPET-to-virgin spreads and driving buyers to compare rPET with alternative fibers. Index-linked pricing introduced in 2023–24 caps spot volatility but keeps buyer leverage via formula resets. Promotions and annual tenders amplify competition, often forcing double-digit percentage concessions.
Specification and quality demands
Brands in 2024 demand tight specs, traceability and certifications like GRS, creating stringent qualification gates that give buyers leverage and make failure to meet specs a delisting risk. Unifi’s REPREVE traceability documents recycled content and chain-of-custody, helping defend value and reduce pure price haggling. Co-developed products further embed Unifi in buyer programs, raising switching costs and deepening strategic partnerships.
Switching costs are moderate
Qualified alternatives from global fiber peers keep switching costs manageable; line trials, color matching and approvals typically prolong switches (proof-of-concept 4–12 weeks), while multi-sourcing policies reduce single-supplier dependence; differentiated sustainability storytelling can raise perceived switching barriers.
- Qualified alternatives: global fiber peers
- Trials & approvals: 4–12 weeks
- Multi-sourcing: limits supplier risk
- Sustainability storytelling: increases perceived lock-in
ESG and transparency requirements
Buyers increasingly mandate recycled-content verification and lifecycle data, driven by 2024 regulations such as the EU CSRD now covering roughly 50,000 companies; this raises compliance costs and strengthens buyer leverage over suppliers lacking chain-of-custody documentation. Unifi’s Repreve brand equity and documented traceability can offset some pressure, but failure to document often forfeits orders from major retailers.
- Buyers mandate verification — raises supplier compliance costs
- EU CSRD (2024) ~50,000 firms — amplifies reporting demands
- Unifi brand equity helps but documentation is decisive
OEM buying power squeezes margins; index pricing limits spot upside, trials raise switching costs
Large OEMs exert strong leverage via concentrated buying (global apparel ~$1.7T in 2024), forcing price, payment and sustainability concessions; losing a marquee account materially hurts volumes. Index-linked pricing (2023–24) limits spot upside while annual tenders and promotions drive double-digit concessions. Repreve traceability and co-development raise switching costs despite 4–12 week trial windows.
| Metric | 2024 |
|---|---|
| Global apparel market | $1.7T |
| EU CSRD firms | ~50,000 |
| Trials & approvals | 4–12 weeks |
Preview the Actual Deliverable
Unifi Porter's Five Forces Analysis
This preview shows the exact Unifi Porter's Five Forces Analysis you'll receive immediately after purchase—no surprises, no placeholders. The file is fully formatted, professionally written, and ready for download and use the moment you buy. You're viewing the final deliverable; instant access is granted upon payment.
Description
Go Beyond the Preview—Access the Full Strategic Report
Unifi faces shifting supplier dynamics, evolving buyer expectations, and persistent substitute threats that shape its competitive landscape; this brief snapshot highlights key pressures but stops short of force-by-force detail. The full Porter's Five Forces Analysis decodes intensity, implications, and strategic options. Unlock the complete report for visuals, ratings, and actionable insights tailored to Unifi.
Suppliers Bargaining Power
Concentrated rPET feedstock sources
Concentrated rPET feedstock sources give bottle suppliers, MRFs and aggregators—often regionally dominant—pricing and quality leverage over Unifi, especially during high-collection seasons when supply tightness increases supplier power. Long-term contracts and third-party certifications (e.g., ISCC, GRS) partially mitigate this risk. Geographic diversification of sourcing reduces exposure to single-supplier disruptions.
Volatile petrochemical inputs
Petrochemical inputs such as PTA/MEG and additives link Unifi costs to oil and chemical cycles—Brent averaged about $86/bbl in 2024 and MEG/PTA spots swung roughly 20–35% that year—allowing suppliers to pass costs through quickly. Price surges can compress Unifi margins if customer pass-through lags. Hedging and indexed contracts cut but do not eliminate exposure; multi-sourcing improves negotiation leverage.
Energy and utilities intensity
Fiber extrusion and recycling are highly energy-intensive, making utilities a key cost driver; US industrial electricity averaged about $0.08/kWh in 2024 (EIA), materially affecting unit economics and demand-charge exposure. Regional pricing and demand charges can swing margins, while corporate renewable PPAs averaged roughly $20–$30/MWh in 2024, helping stabilize rates and bolster ESG claims. Grid reliability (outage minutes per customer) directly impacts uptime and yield.
Specialty additives and colorants
High-spec additives and colorants exert strong supplier power for Unifi because niche producers dominate specialty masterbatches; 2024 industry surveys show qualification cycles average 9–12 months, increasing dependency and switching frictions. Consistency requirements and long validation timelines raise the cost of supplier changes, while volume commitments in 2024 deals often secured discounts of 5–15% in exchange for assured supply. Co-development agreements in 2024 transactions frequently included multi-year exclusivity, locking mutual value but raising switching costs further.
- Qualification cycles: 9–12 months (2024)
- Volume discounts commonly 5–15% (2024)
- Co-development often multi-year exclusivity (2024)
Equipment and maintenance OEMs
Equipment and maintenance OEMs for extrusion, filtration and recycling lines control critical spares and upgrades, with aftermarket parts and service margins often exceeding 50% (2024 industry data), creating vendor lock-in and pricing power. Proprietary components and limited second-source parts for specialized machinery raise switching costs and elevate downtime risk. Preventive maintenance contracts reduce unplanned outages but add recurring cost and dependency on OEM service networks.
- Critical spares concentration
- Proprietary component lock-in
- High aftermarket margins (2024)
- Limited second-source parts
- Preventive maintenance trade-off
Suppliers wield pricing power amid rPET concentration and energy-linked commodity swings
Suppliers hold moderate-to-high bargaining power: concentrated rPET, specialty additives and OEM spares create switching costs and service lock-in; PTA/MEG and energy tie costs to commodity cycles (Brent ~$86/bbl in 2024; US industrial electricity ~$0.08/kWh in 2024). Long-term contracts, hedges and multi-sourcing mitigate but do not eliminate price pass-through and margin risk.
| Factor | 2024 Metric |
|---|---|
| Brent | $86/bbl |
| US industrial electricity | $0.08/kWh |
| Qualification cycles | 9–12 months |
| Volume discounts | 5–15% |
| Aftermarket margins | >50% |
What is included in the product
Detailed Word Document
Comprehensive Porter's Five Forces analysis tailored exclusively for Unifi, uncovering competitive drivers, supplier and buyer power, entry barriers, substitutes, and emerging disruptive threats; includes industry data, strategic commentary, and editable Word format for seamless use in investor materials or strategy decks.
Customizable Excel Spreadsheet
One-sheet Unifi Porter’s Five Forces that turns complex competitive analysis into instant clarity—customize pressure levels, swap in your data, and visualize strategic threats with a ready-to-use spider chart for decks or decision-making.
Customers Bargaining Power
Concentrated global brands
Large apparel, footwear and auto OEMs buy at scale and negotiate aggressively, leveraging concentrated purchasing to extract concessions; the global apparel market was about $1.7 trillion in 2024. Approved-vendor lists raise supplier switching costs while centralizing buyer power, enabling demands for price cuts, extended payment terms and detailed sustainability data. Losing one marquee account can materially dent volumes and margins for suppliers.
Price sensitivity amid demand cycles
End markets are cyclical and in downturns (2024) brands pressure suppliers for cost-downs, compressing rPET-to-virgin spreads and driving buyers to compare rPET with alternative fibers. Index-linked pricing introduced in 2023–24 caps spot volatility but keeps buyer leverage via formula resets. Promotions and annual tenders amplify competition, often forcing double-digit percentage concessions.
Specification and quality demands
Brands in 2024 demand tight specs, traceability and certifications like GRS, creating stringent qualification gates that give buyers leverage and make failure to meet specs a delisting risk. Unifi’s REPREVE traceability documents recycled content and chain-of-custody, helping defend value and reduce pure price haggling. Co-developed products further embed Unifi in buyer programs, raising switching costs and deepening strategic partnerships.
Switching costs are moderate
Qualified alternatives from global fiber peers keep switching costs manageable; line trials, color matching and approvals typically prolong switches (proof-of-concept 4–12 weeks), while multi-sourcing policies reduce single-supplier dependence; differentiated sustainability storytelling can raise perceived switching barriers.
- Qualified alternatives: global fiber peers
- Trials & approvals: 4–12 weeks
- Multi-sourcing: limits supplier risk
- Sustainability storytelling: increases perceived lock-in
ESG and transparency requirements
Buyers increasingly mandate recycled-content verification and lifecycle data, driven by 2024 regulations such as the EU CSRD now covering roughly 50,000 companies; this raises compliance costs and strengthens buyer leverage over suppliers lacking chain-of-custody documentation. Unifi’s Repreve brand equity and documented traceability can offset some pressure, but failure to document often forfeits orders from major retailers.
- Buyers mandate verification — raises supplier compliance costs
- EU CSRD (2024) ~50,000 firms — amplifies reporting demands
- Unifi brand equity helps but documentation is decisive
OEM buying power squeezes margins; index pricing limits spot upside, trials raise switching costs
Large OEMs exert strong leverage via concentrated buying (global apparel ~$1.7T in 2024), forcing price, payment and sustainability concessions; losing a marquee account materially hurts volumes. Index-linked pricing (2023–24) limits spot upside while annual tenders and promotions drive double-digit concessions. Repreve traceability and co-development raise switching costs despite 4–12 week trial windows.
| Metric | 2024 |
|---|---|
| Global apparel market | $1.7T |
| EU CSRD firms | ~50,000 |
| Trials & approvals | 4–12 weeks |
Preview the Actual Deliverable
Unifi Porter's Five Forces Analysis
This preview shows the exact Unifi Porter's Five Forces Analysis you'll receive immediately after purchase—no surprises, no placeholders. The file is fully formatted, professionally written, and ready for download and use the moment you buy. You're viewing the final deliverable; instant access is granted upon payment.











