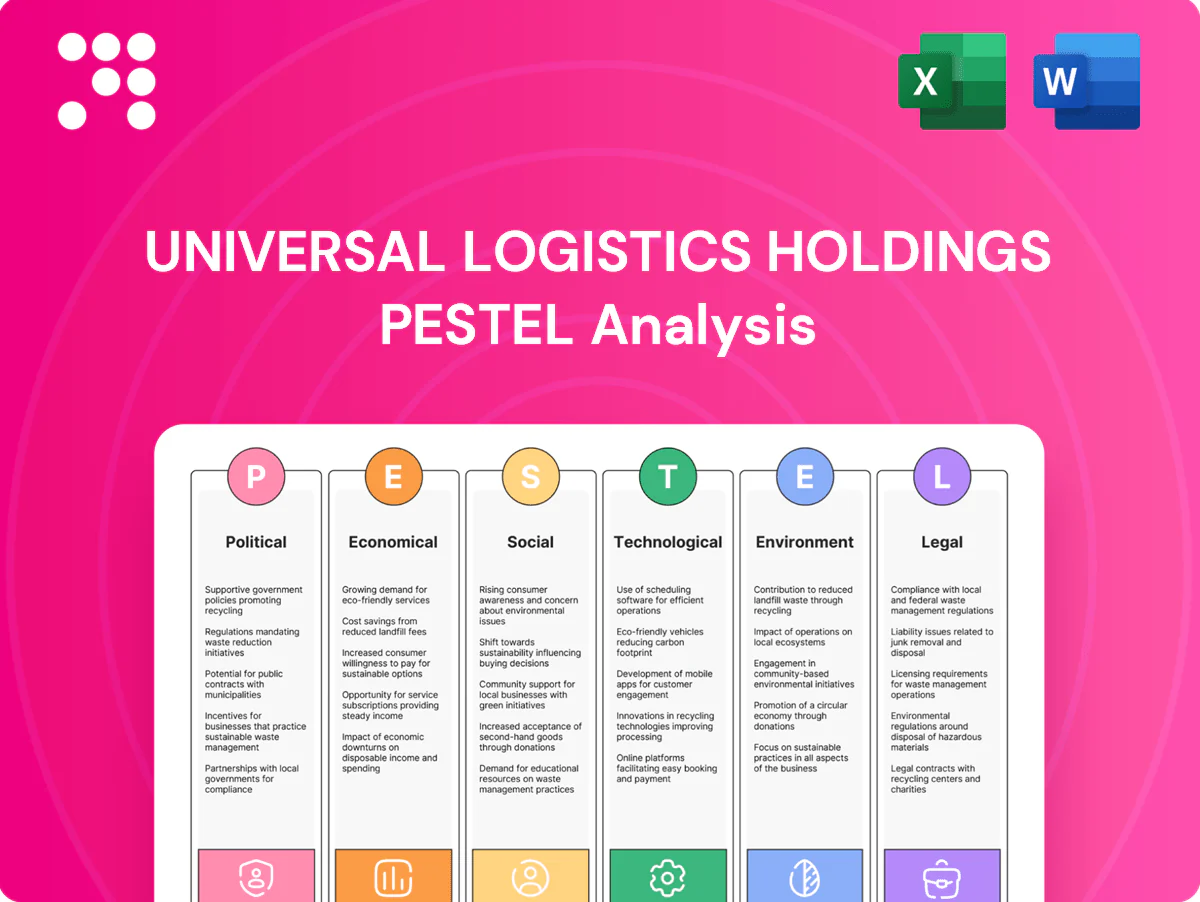
Universal Logistics Holdings PESTLE Analysis

Make Smarter Strategic Decisions with a Complete PESTEL View
Gain a competitive edge with our targeted PESTLE analysis of Universal Logistics Holdings—uncover how regulation, trade trends, and technology shifts shape its growth prospects. This concise briefing highlights key risks and opportunities. Buy the full version to access the complete, actionable intelligence instantly.
Political factors

USMCA and cross‑border trade policy
Operating across the U.S., Canada and Mexico makes USMCA stability (effective July 1, 2020) critical for Universal Logistics Holdings, as rule-of-origin changes—notably the 75% auto regional content and 40–45% high-wage labor provisions—can shift lane profitability and mode mix. Sector quotas or tweaks would affect pricing and capacity planning; Universal can hedge by diversifying customers and expanding customs brokerage capabilities. Proactive engagement with trade bodies helps anticipate regulatory shifts.
Infrastructure spending and public investment
U.S. IIJA’s $1.2 trillion package (about $550 billion new federal investment) and Canada’s Investing in Canada Plan (~$180 billion) reshape congestion, transit times and equipment utilization; short-term construction can disrupt lanes while long-term corridor upgrades lower per-mile costs and improve reliability. Universal can retune network design, revise contract SLAs to slated upgrades and advocate for access near intermodal hubs and ports.

Geopolitical tensions and supply chain rerouting
Tariff volatility and sanctions continue to re-map freight flows between ports and border crossings, driving modal shifts that alter Universal Logistics Holdings mix and margins as ocean volumes swing toward cross-border truck and rail. Scenario planning and dynamic lane modeling help protect against sudden imbalances in 2024–25 trade lanes. Strategic partnerships with rail and intermodal carriers create the operational flexibility needed under disruption.

Border security and customs enforcement
- Higher inspection rates → longer dwell/detention risk
- C-TPAT >11,000 partners (2024) → faster clearances
- Pre-clearance data quality → fewer exceptions
- Real-time visibility → 10–20% inventory buffer reduction
State and local incentives/zoning
Warehouse siting hinges on regional incentives, zoning approvals and community acceptance; tax abatements commonly run 5–20 years and can shift facility ROI and network topology materially, especially when upfront incentives exceed millions of dollars. Universal can prioritize pro-logistics jurisdictions to accelerate openings and use targeted community engagement to reduce opposition and permitting delays.
- Incentives: 5–20 year abatements
- Impact: millions in upfront offset
- Strategy: target pro-logistics states
- Mitigation: community engagement lowers delays
USMCA 75%/40-45% rules; IIJA $550B reshape North American freight ROI
Operating across US/Canada/Mexico makes USMCA rules (75% auto content; 40–45% high‑wage) material to lane profitability and mode mix. IIJA ~ $550B new federal investment and Canada ~C$180B reshape congestion and equipment utilization. C-TPAT >11,000 partners (2024) and 5–20 year tax abatements drive site selection, compliance and ROI.
| Factor | Metric |
|---|---|
| USMCA | 75% / 40–45% |
| IIJA / Canada | $550B / C$180B |
| C-TPAT | >11,000 (2024) |
| Incentives | 5–20 yr abatements |
What is included in the product
 Detailed Word Document
Explores how macro-environmental forces uniquely affect Universal Logistics Holdings across Political, Economic, Social, Technological, Environmental and Legal dimensions, with data-backed, forward-looking insights to help executives, investors and strategists identify risks, opportunities and scenario-driven actions.

 Customizable Excel Spreadsheet
Concise, visually segmented PESTLE summary of Universal Logistics Holdings that relieves meeting prep pain by highlighting regulatory, economic, and technological risks and opportunities in one editable, shareable slide-ready format for rapid team alignment and client reporting.
Economic factors

Freight demand cycles and industrial production
Logistics volumes closely follow GDP (US GDP growth ~2.5% in 2024), retail sales (≈+3.0% y/y 2024) and industrial production (+1.8% 2024), with automotive and manufacturing driving tonnage; downturns compress rates and heighten bidding, while upturns allow yield management. Universal’s diversified mode and sector mix buffers cycles and its flexible cost structure supports margin resilience.
Fuel price volatility (diesel)
Diesel swings—EIA data shows U.S. diesel rack prices moved roughly 30% between 2022–24—reshaped Universal Logistics linehaul costs and surcharge recoveries, forcing frequent recalibration of contract fuel adders; effective fuel programs and rapid pass-throughs have restored roughly 80–95% of incremental fuel costs across truckload, LTL and dedicated. Mode shifting to intermodal (typically 15–25% lower fuel cost in high-fuel regimes) and data-driven routing plus idle-reduction tech (fuel savings of 8–12%) further compress exposure and protect margins.

Labor market tightness and wage inflation
Driver and warehouse labor scarcity—ATA estimated a US truck driver shortfall of about 80,000 in 2023—elevates Universal Logistics recruitment and retention costs and pushes up wages (BLS median annual pay for heavy/tractor-trailer drivers was $48,310 in May 2023). Tight markets pressure service reliability and slow onboarding, while scheduling flexibility, targeted pay structures and warehouse automation can boost productivity. Brokerage capacity networks let Universal cover peaks without large fixed-cost increases.

Interest rates and capital allocation
- H1 2025: higher financing pressure vs 2021–22
- Focus: high-ROIC contracts, variable capacity
- Mitigants: interest-rate hedges, staggered maturities
Nearshoring to Mexico
USMCA 75%/40-45% rules; IIJA $550B reshape North American freight ROI
Logistics demand tied to US GDP ~2.5% (2024) and retail sales ≈+3.0% (2024), benefiting Universal’s diversified mix; diesel volatility (~30% 2022–24) and driver shortfall (~80,000 in 2023) raise operating costs; nearshoring (Mexico ~15% of US trade; Laredo ~40% land trade) boosts cross‑border lanes; higher rates H1 2025 lift financing costs, favoring high‑ROIC, variable capacity.
| Metric | Value | Impact |
|---|---|---|
| US GDP (2024) | ~2.5% | Volume growth |
| Diesel swing (2022–24) | ~30% | Cost volatility |
| Driver gap (2023) | ~80,000 | Labor cost↑ |
| Mexico share (2023) | ~15% | Cross‑border demand↑ |
Preview Before You Purchase
Universal Logistics Holdings PESTLE Analysis
The Universal Logistics Holdings PESTLE Analysis shown here is the exact document you’ll receive after purchase—fully formatted and ready to use. This preview reflects the final layout, content, and structure with no placeholders or teasers. After checkout you’ll instantly download the same professional, ready-to-use file.

Make Smarter Strategic Decisions with a Complete PESTEL View
Gain a competitive edge with our targeted PESTLE analysis of Universal Logistics Holdings—uncover how regulation, trade trends, and technology shifts shape its growth prospects. This concise briefing highlights key risks and opportunities. Buy the full version to access the complete, actionable intelligence instantly.
Political factors
USMCA and cross‑border trade policy
Operating across the U.S., Canada and Mexico makes USMCA stability (effective July 1, 2020) critical for Universal Logistics Holdings, as rule-of-origin changes—notably the 75% auto regional content and 40–45% high-wage labor provisions—can shift lane profitability and mode mix. Sector quotas or tweaks would affect pricing and capacity planning; Universal can hedge by diversifying customers and expanding customs brokerage capabilities. Proactive engagement with trade bodies helps anticipate regulatory shifts.
Infrastructure spending and public investment
U.S. IIJA’s $1.2 trillion package (about $550 billion new federal investment) and Canada’s Investing in Canada Plan (~$180 billion) reshape congestion, transit times and equipment utilization; short-term construction can disrupt lanes while long-term corridor upgrades lower per-mile costs and improve reliability. Universal can retune network design, revise contract SLAs to slated upgrades and advocate for access near intermodal hubs and ports.
Geopolitical tensions and supply chain rerouting
Tariff volatility and sanctions continue to re-map freight flows between ports and border crossings, driving modal shifts that alter Universal Logistics Holdings mix and margins as ocean volumes swing toward cross-border truck and rail. Scenario planning and dynamic lane modeling help protect against sudden imbalances in 2024–25 trade lanes. Strategic partnerships with rail and intermodal carriers create the operational flexibility needed under disruption.
Border security and customs enforcement
- Higher inspection rates → longer dwell/detention risk
- C-TPAT >11,000 partners (2024) → faster clearances
- Pre-clearance data quality → fewer exceptions
- Real-time visibility → 10–20% inventory buffer reduction
State and local incentives/zoning
Warehouse siting hinges on regional incentives, zoning approvals and community acceptance; tax abatements commonly run 5–20 years and can shift facility ROI and network topology materially, especially when upfront incentives exceed millions of dollars. Universal can prioritize pro-logistics jurisdictions to accelerate openings and use targeted community engagement to reduce opposition and permitting delays.
- Incentives: 5–20 year abatements
- Impact: millions in upfront offset
- Strategy: target pro-logistics states
- Mitigation: community engagement lowers delays
USMCA 75%/40-45% rules; IIJA $550B reshape North American freight ROI
Operating across US/Canada/Mexico makes USMCA rules (75% auto content; 40–45% high‑wage) material to lane profitability and mode mix. IIJA ~ $550B new federal investment and Canada ~C$180B reshape congestion and equipment utilization. C-TPAT >11,000 partners (2024) and 5–20 year tax abatements drive site selection, compliance and ROI.
| Factor | Metric |
|---|---|
| USMCA | 75% / 40–45% |
| IIJA / Canada | $550B / C$180B |
| C-TPAT | >11,000 (2024) |
| Incentives | 5–20 yr abatements |
What is included in the product
Detailed Word Document
Explores how macro-environmental forces uniquely affect Universal Logistics Holdings across Political, Economic, Social, Technological, Environmental and Legal dimensions, with data-backed, forward-looking insights to help executives, investors and strategists identify risks, opportunities and scenario-driven actions.
Customizable Excel Spreadsheet
Concise, visually segmented PESTLE summary of Universal Logistics Holdings that relieves meeting prep pain by highlighting regulatory, economic, and technological risks and opportunities in one editable, shareable slide-ready format for rapid team alignment and client reporting.
Economic factors
Freight demand cycles and industrial production
Logistics volumes closely follow GDP (US GDP growth ~2.5% in 2024), retail sales (≈+3.0% y/y 2024) and industrial production (+1.8% 2024), with automotive and manufacturing driving tonnage; downturns compress rates and heighten bidding, while upturns allow yield management. Universal’s diversified mode and sector mix buffers cycles and its flexible cost structure supports margin resilience.
Fuel price volatility (diesel)
Diesel swings—EIA data shows U.S. diesel rack prices moved roughly 30% between 2022–24—reshaped Universal Logistics linehaul costs and surcharge recoveries, forcing frequent recalibration of contract fuel adders; effective fuel programs and rapid pass-throughs have restored roughly 80–95% of incremental fuel costs across truckload, LTL and dedicated. Mode shifting to intermodal (typically 15–25% lower fuel cost in high-fuel regimes) and data-driven routing plus idle-reduction tech (fuel savings of 8–12%) further compress exposure and protect margins.
Labor market tightness and wage inflation
Driver and warehouse labor scarcity—ATA estimated a US truck driver shortfall of about 80,000 in 2023—elevates Universal Logistics recruitment and retention costs and pushes up wages (BLS median annual pay for heavy/tractor-trailer drivers was $48,310 in May 2023). Tight markets pressure service reliability and slow onboarding, while scheduling flexibility, targeted pay structures and warehouse automation can boost productivity. Brokerage capacity networks let Universal cover peaks without large fixed-cost increases.
Interest rates and capital allocation
- H1 2025: higher financing pressure vs 2021–22
- Focus: high-ROIC contracts, variable capacity
- Mitigants: interest-rate hedges, staggered maturities
Nearshoring to Mexico
USMCA 75%/40-45% rules; IIJA $550B reshape North American freight ROI
Logistics demand tied to US GDP ~2.5% (2024) and retail sales ≈+3.0% (2024), benefiting Universal’s diversified mix; diesel volatility (~30% 2022–24) and driver shortfall (~80,000 in 2023) raise operating costs; nearshoring (Mexico ~15% of US trade; Laredo ~40% land trade) boosts cross‑border lanes; higher rates H1 2025 lift financing costs, favoring high‑ROIC, variable capacity.
| Metric | Value | Impact |
|---|---|---|
| US GDP (2024) | ~2.5% | Volume growth |
| Diesel swing (2022–24) | ~30% | Cost volatility |
| Driver gap (2023) | ~80,000 | Labor cost↑ |
| Mexico share (2023) | ~15% | Cross‑border demand↑ |
Preview Before You Purchase
Universal Logistics Holdings PESTLE Analysis
The Universal Logistics Holdings PESTLE Analysis shown here is the exact document you’ll receive after purchase—fully formatted and ready to use. This preview reflects the final layout, content, and structure with no placeholders or teasers. After checkout you’ll instantly download the same professional, ready-to-use file.
Original: $10.00
-65%$10.00
$3.50Description
Make Smarter Strategic Decisions with a Complete PESTEL View
Gain a competitive edge with our targeted PESTLE analysis of Universal Logistics Holdings—uncover how regulation, trade trends, and technology shifts shape its growth prospects. This concise briefing highlights key risks and opportunities. Buy the full version to access the complete, actionable intelligence instantly.
Political factors
USMCA and cross‑border trade policy
Operating across the U.S., Canada and Mexico makes USMCA stability (effective July 1, 2020) critical for Universal Logistics Holdings, as rule-of-origin changes—notably the 75% auto regional content and 40–45% high-wage labor provisions—can shift lane profitability and mode mix. Sector quotas or tweaks would affect pricing and capacity planning; Universal can hedge by diversifying customers and expanding customs brokerage capabilities. Proactive engagement with trade bodies helps anticipate regulatory shifts.
Infrastructure spending and public investment
U.S. IIJA’s $1.2 trillion package (about $550 billion new federal investment) and Canada’s Investing in Canada Plan (~$180 billion) reshape congestion, transit times and equipment utilization; short-term construction can disrupt lanes while long-term corridor upgrades lower per-mile costs and improve reliability. Universal can retune network design, revise contract SLAs to slated upgrades and advocate for access near intermodal hubs and ports.
Geopolitical tensions and supply chain rerouting
Tariff volatility and sanctions continue to re-map freight flows between ports and border crossings, driving modal shifts that alter Universal Logistics Holdings mix and margins as ocean volumes swing toward cross-border truck and rail. Scenario planning and dynamic lane modeling help protect against sudden imbalances in 2024–25 trade lanes. Strategic partnerships with rail and intermodal carriers create the operational flexibility needed under disruption.
Border security and customs enforcement
- Higher inspection rates → longer dwell/detention risk
- C-TPAT >11,000 partners (2024) → faster clearances
- Pre-clearance data quality → fewer exceptions
- Real-time visibility → 10–20% inventory buffer reduction
State and local incentives/zoning
Warehouse siting hinges on regional incentives, zoning approvals and community acceptance; tax abatements commonly run 5–20 years and can shift facility ROI and network topology materially, especially when upfront incentives exceed millions of dollars. Universal can prioritize pro-logistics jurisdictions to accelerate openings and use targeted community engagement to reduce opposition and permitting delays.
- Incentives: 5–20 year abatements
- Impact: millions in upfront offset
- Strategy: target pro-logistics states
- Mitigation: community engagement lowers delays
USMCA 75%/40-45% rules; IIJA $550B reshape North American freight ROI
Operating across US/Canada/Mexico makes USMCA rules (75% auto content; 40–45% high‑wage) material to lane profitability and mode mix. IIJA ~ $550B new federal investment and Canada ~C$180B reshape congestion and equipment utilization. C-TPAT >11,000 partners (2024) and 5–20 year tax abatements drive site selection, compliance and ROI.
| Factor | Metric |
|---|---|
| USMCA | 75% / 40–45% |
| IIJA / Canada | $550B / C$180B |
| C-TPAT | >11,000 (2024) |
| Incentives | 5–20 yr abatements |
What is included in the product
Detailed Word Document
Explores how macro-environmental forces uniquely affect Universal Logistics Holdings across Political, Economic, Social, Technological, Environmental and Legal dimensions, with data-backed, forward-looking insights to help executives, investors and strategists identify risks, opportunities and scenario-driven actions.
Customizable Excel Spreadsheet
Concise, visually segmented PESTLE summary of Universal Logistics Holdings that relieves meeting prep pain by highlighting regulatory, economic, and technological risks and opportunities in one editable, shareable slide-ready format for rapid team alignment and client reporting.
Economic factors
Freight demand cycles and industrial production
Logistics volumes closely follow GDP (US GDP growth ~2.5% in 2024), retail sales (≈+3.0% y/y 2024) and industrial production (+1.8% 2024), with automotive and manufacturing driving tonnage; downturns compress rates and heighten bidding, while upturns allow yield management. Universal’s diversified mode and sector mix buffers cycles and its flexible cost structure supports margin resilience.
Fuel price volatility (diesel)
Diesel swings—EIA data shows U.S. diesel rack prices moved roughly 30% between 2022–24—reshaped Universal Logistics linehaul costs and surcharge recoveries, forcing frequent recalibration of contract fuel adders; effective fuel programs and rapid pass-throughs have restored roughly 80–95% of incremental fuel costs across truckload, LTL and dedicated. Mode shifting to intermodal (typically 15–25% lower fuel cost in high-fuel regimes) and data-driven routing plus idle-reduction tech (fuel savings of 8–12%) further compress exposure and protect margins.
Labor market tightness and wage inflation
Driver and warehouse labor scarcity—ATA estimated a US truck driver shortfall of about 80,000 in 2023—elevates Universal Logistics recruitment and retention costs and pushes up wages (BLS median annual pay for heavy/tractor-trailer drivers was $48,310 in May 2023). Tight markets pressure service reliability and slow onboarding, while scheduling flexibility, targeted pay structures and warehouse automation can boost productivity. Brokerage capacity networks let Universal cover peaks without large fixed-cost increases.
Interest rates and capital allocation
- H1 2025: higher financing pressure vs 2021–22
- Focus: high-ROIC contracts, variable capacity
- Mitigants: interest-rate hedges, staggered maturities
Nearshoring to Mexico
USMCA 75%/40-45% rules; IIJA $550B reshape North American freight ROI
Logistics demand tied to US GDP ~2.5% (2024) and retail sales ≈+3.0% (2024), benefiting Universal’s diversified mix; diesel volatility (~30% 2022–24) and driver shortfall (~80,000 in 2023) raise operating costs; nearshoring (Mexico ~15% of US trade; Laredo ~40% land trade) boosts cross‑border lanes; higher rates H1 2025 lift financing costs, favoring high‑ROIC, variable capacity.
| Metric | Value | Impact |
|---|---|---|
| US GDP (2024) | ~2.5% | Volume growth |
| Diesel swing (2022–24) | ~30% | Cost volatility |
| Driver gap (2023) | ~80,000 | Labor cost↑ |
| Mexico share (2023) | ~15% | Cross‑border demand↑ |
Preview Before You Purchase
Universal Logistics Holdings PESTLE Analysis
The Universal Logistics Holdings PESTLE Analysis shown here is the exact document you’ll receive after purchase—fully formatted and ready to use. This preview reflects the final layout, content, and structure with no placeholders or teasers. After checkout you’ll instantly download the same professional, ready-to-use file.











