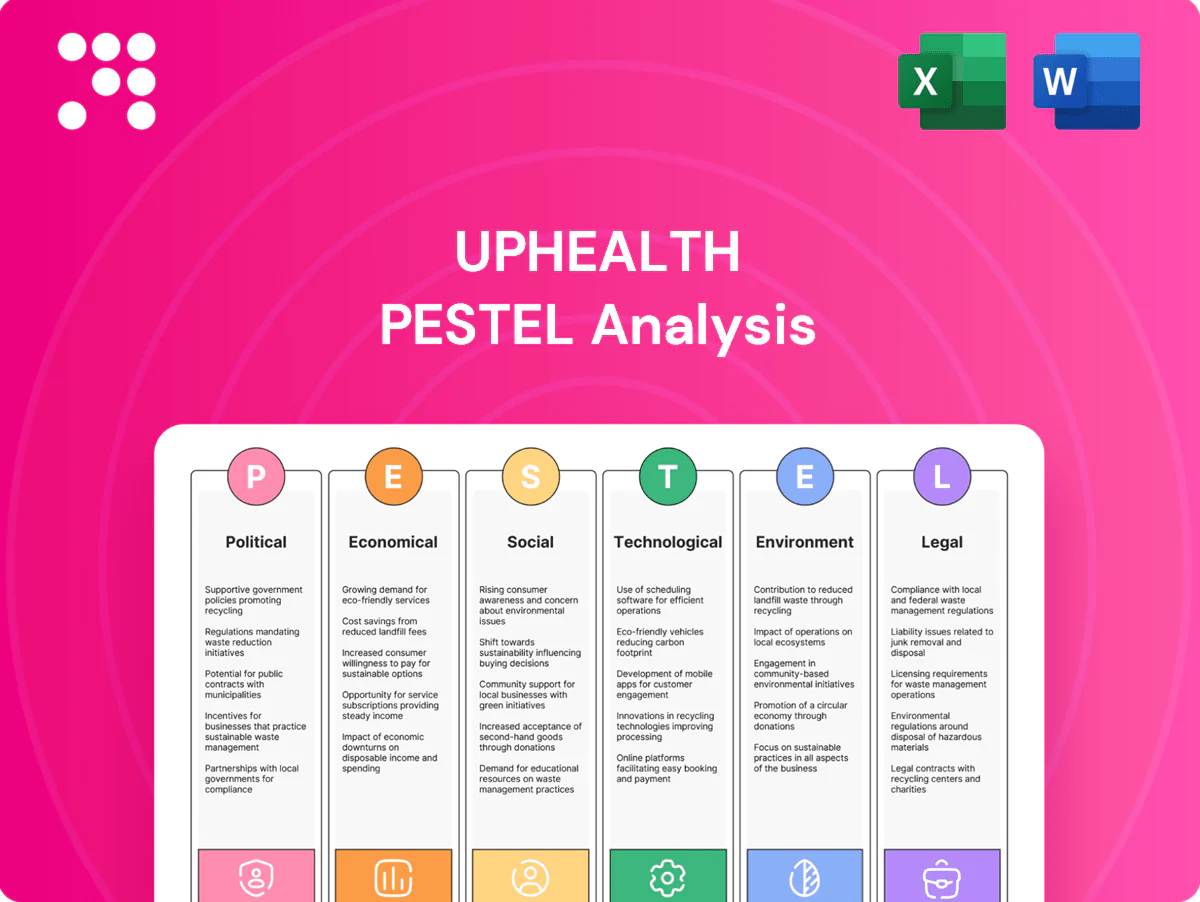
UpHealth PESTLE Analysis

Skip the Research. Get the Strategy.
Gain a strategic advantage with our PESTLE Analysis of UpHealth—three to five concise external forces explained to show how politics, economics, and technology shape growth and risk. Ideal for investors and strategists, this analysis is ready to apply in decisions and presentations. Purchase the full report for the complete, editable breakdown and actionable recommendations.
Political factors

Telehealth reimbursement and public funding
Government reimbursement parity drives adoption and pricing power; as of 2024 roughly 39 states plus DC have telehealth payment parity laws, supporting provider revenue. Policy shifts in Medicare/Medicaid and national health systems—after COVID-era expansions—can rapidly expand or constrain volumes, with telehealth now representing roughly 10–15% of outpatient visits in many markets. Elections and budget cycles create coverage volatility that can swing utilization and revenue. UpHealth must monitor regulatory changes and lobby to maintain favorable rates.
National digital health strategies
Many countries now treat e-health, EHR integration and virtual care as strategic priorities, with over 70% of OECD and emerging-market governments publishing national digital health strategies by 2024. Dedicated grants and procurement frameworks—including multi‑year funding pools—have accelerated platform uptake, often enabling pilots to scale within 12–24 months. Priority alignment has driven faster tenders and deployments; misalignment commonly delays tenders and elongates sales cycles by 6–12 months.

Cross-border service regulations
Operating globally exposes UpHealth to differing telemedicine rules across 50 US states and 27 EU member states, creating licensing and reimbursement variability. Restrictions on cross-border care and provider presence—compounded by GDPR transfer rules and data localization policies in China, Russia and India—shape delivery models. Local partnerships help navigate compliance and enable in‑market provider models.

Behavioral health policy emphasis
Governments have elevated mental health access post-pandemic: WHO reported a 25% global rise in anxiety and depression in 2020, and CDC recorded a 154% surge in telehealth visits in March 2020; CMS and many states expanded telebehavioral reimbursement, while policy targets in several health systems push digital triage to under 4 weeks; budget cuts or stigma-driven politics could reverse gains.
- Funding growth: expanded Medicare/state reimbursement
- Access target: digital triage <4 weeks in multiple systems
- Risk: political cuts or stigma may roll back progress
Public health emergency readiness
Preparedness agendas have funded virtual surge capacity, with telehealth visits rising more than 50-fold in 2020 (HHS) and stabilizing around 5–8% of outpatient visits by 2023; emergency waivers temporarily broadened licensure and reimbursement but lapsed rules often push utilization back toward baseline. UpHealth must build offerings that function under both expanded-waiver and post-waiver regimes to protect revenue and care continuity.
- Funded surge capacity: federal/state grants
- Waivers: temporary licensure/reimbursement expansion
- Normalization risk: utilization ~5–8% (2023)
- Action: design policy-resilient products
Parity in ~39+DC and national strategies normalize telehealth at 5–8%
Reimbursement parity in ~39 states+DC and expanded Medicare/state coverage drove adoption; telehealth now ~10–15% of outpatient visits in many markets but normalized to ~5–8% by 2023. Over 70% of OECD/emerging economies had national digital health strategies by 2024, accelerating procurement. Cross‑border rules, GDPR and localization create licensing/reimbursement variability requiring local partnerships.
| Metric | 2023–2024 |
|---|---|
| States with parity | ~39+DC |
| Telehealth share | 10–15% peak; 5–8% 2023 |
| Govt strategies | >70% OECD/emerging |
What is included in the product
 Detailed Word Document
Explores how external macro-environmental factors uniquely affect UpHealth across Political, Economic, Social, Technological, Environmental and Legal dimensions, providing data-backed insights and region-specific market and regulatory context. Designed for executives, consultants and investors, the analysis delivers detailed sub-points, forward-looking scenario insights and clean formatting ready for business plans, pitch decks or internal reports.

 Customizable Excel Spreadsheet
A concise, visually segmented UpHealth PESTLE summary that relieves pain points by highlighting external risks and opportunities for quick inclusion in presentations, team alignment and consultant reports, with editable notes for regional or business-line context.
Economic factors

Value-based care and cost containment
Payers increasingly demand outcomes at lower total cost of care; Medicare Advantage enrollment reached about 28.6 million in 2023, intensifying payer focus on cost containment. Digital care coordination and RPM enable shared savings and lower utilization, while contracts now commonly include risk-sharing and performance fees. Demonstrable ROI and published savings metrics are critical for contract renewals and scaling.
Macroeconomic cycles and budgets
Recessions compress provider and payer budgets—IMF estimated global growth at 3.1% in 2024—lengthening sales cycles as capital projects are deferred. Demand shifts toward cost-saving software over capex-heavy devices; modular pricing and pay-as-you-go models preserve uptake. USD volatility (DXY up about 8% vs major peers 2022–24) has reduced reported international revenues.

Labor shortages and wage inflation
Clinician scarcity—AAMC projects a US physician shortfall of 37,800–124,000 by 2034—raises operating costs for UpHealth customers and heightens demand for workforce alternatives. Automation and virtual workforce tools become must-haves as RN turnover is ~27% (NSI 2023) with RN replacement cost ~$46,100 (NSI 2022). UpHealth can position its platforms as productivity levers, but sparse published ROI evidence risks procurement deferrals.

Consolidation among payers/providers
Consolidation among payers and providers concentrates buying power and standardizes vendor lists, raising procurement bar for UpHealth; large-system win rates unlock scale but compress pricing and margins. Post-merger integrations drive upsell opportunities into care management and digital front-end services, while losing a single system deal can swing ARR by multiple percentage points for mid-market vendors.
- Concentration increases procurement leverage
- Wins yield scale but pressure on pricing
- Integrations = upsell channels
- Single-system losses can move ARR materially
Access to capital and cost of debt
- Interest rates: 5.25–5.5% (H1 2025)
- SaaS multiples: ~4x EV/Revenue (2024)
- Models: pay-as-you-go lowers entry barriers; strong unit economics improve investor appetite
Parity in ~39+DC and national strategies normalize telehealth at 5–8%
Payer focus on outcomes intensifies—Medicare Advantage ~28.6M (2023)—forcing risk-sharing and ROI proofs. Higher rates (fed funds 5.25–5.5% H1 2025) compress SaaS valuations (~4x EV/Rev 2024) and favor consumption pricing. Clinician gap (AAMC 37,800–124,000 by 2034) and RN turnover ~27% (NSI 2023) raise demand for automation.
| Metric | Value |
|---|---|
| MA enrollment (2023) | 28.6M |
| Fed funds (H1 2025) | 5.25–5.5% |
| SaaS EV/Rev (2024) | ~4x |
| Physician shortfall | 37,800–124,000 (2034) |
What You See Is What You Get
UpHealth PESTLE Analysis
The preview shown here is the exact document you’ll receive after purchase—fully formatted and ready to use. This UpHealth PESTLE Analysis delivers concise political, economic, social, technological, legal, and environmental insights tailored to digital health strategy. No placeholders or teasers; the file is final and download-ready.

Skip the Research. Get the Strategy.
Gain a strategic advantage with our PESTLE Analysis of UpHealth—three to five concise external forces explained to show how politics, economics, and technology shape growth and risk. Ideal for investors and strategists, this analysis is ready to apply in decisions and presentations. Purchase the full report for the complete, editable breakdown and actionable recommendations.
Political factors
Telehealth reimbursement and public funding
Government reimbursement parity drives adoption and pricing power; as of 2024 roughly 39 states plus DC have telehealth payment parity laws, supporting provider revenue. Policy shifts in Medicare/Medicaid and national health systems—after COVID-era expansions—can rapidly expand or constrain volumes, with telehealth now representing roughly 10–15% of outpatient visits in many markets. Elections and budget cycles create coverage volatility that can swing utilization and revenue. UpHealth must monitor regulatory changes and lobby to maintain favorable rates.
National digital health strategies
Many countries now treat e-health, EHR integration and virtual care as strategic priorities, with over 70% of OECD and emerging-market governments publishing national digital health strategies by 2024. Dedicated grants and procurement frameworks—including multi‑year funding pools—have accelerated platform uptake, often enabling pilots to scale within 12–24 months. Priority alignment has driven faster tenders and deployments; misalignment commonly delays tenders and elongates sales cycles by 6–12 months.
Cross-border service regulations
Operating globally exposes UpHealth to differing telemedicine rules across 50 US states and 27 EU member states, creating licensing and reimbursement variability. Restrictions on cross-border care and provider presence—compounded by GDPR transfer rules and data localization policies in China, Russia and India—shape delivery models. Local partnerships help navigate compliance and enable in‑market provider models.
Behavioral health policy emphasis
Governments have elevated mental health access post-pandemic: WHO reported a 25% global rise in anxiety and depression in 2020, and CDC recorded a 154% surge in telehealth visits in March 2020; CMS and many states expanded telebehavioral reimbursement, while policy targets in several health systems push digital triage to under 4 weeks; budget cuts or stigma-driven politics could reverse gains.
- Funding growth: expanded Medicare/state reimbursement
- Access target: digital triage <4 weeks in multiple systems
- Risk: political cuts or stigma may roll back progress
Public health emergency readiness
Preparedness agendas have funded virtual surge capacity, with telehealth visits rising more than 50-fold in 2020 (HHS) and stabilizing around 5–8% of outpatient visits by 2023; emergency waivers temporarily broadened licensure and reimbursement but lapsed rules often push utilization back toward baseline. UpHealth must build offerings that function under both expanded-waiver and post-waiver regimes to protect revenue and care continuity.
- Funded surge capacity: federal/state grants
- Waivers: temporary licensure/reimbursement expansion
- Normalization risk: utilization ~5–8% (2023)
- Action: design policy-resilient products
Parity in ~39+DC and national strategies normalize telehealth at 5–8%
Reimbursement parity in ~39 states+DC and expanded Medicare/state coverage drove adoption; telehealth now ~10–15% of outpatient visits in many markets but normalized to ~5–8% by 2023. Over 70% of OECD/emerging economies had national digital health strategies by 2024, accelerating procurement. Cross‑border rules, GDPR and localization create licensing/reimbursement variability requiring local partnerships.
| Metric | 2023–2024 |
|---|---|
| States with parity | ~39+DC |
| Telehealth share | 10–15% peak; 5–8% 2023 |
| Govt strategies | >70% OECD/emerging |
What is included in the product
Detailed Word Document
Explores how external macro-environmental factors uniquely affect UpHealth across Political, Economic, Social, Technological, Environmental and Legal dimensions, providing data-backed insights and region-specific market and regulatory context. Designed for executives, consultants and investors, the analysis delivers detailed sub-points, forward-looking scenario insights and clean formatting ready for business plans, pitch decks or internal reports.
Customizable Excel Spreadsheet
A concise, visually segmented UpHealth PESTLE summary that relieves pain points by highlighting external risks and opportunities for quick inclusion in presentations, team alignment and consultant reports, with editable notes for regional or business-line context.
Economic factors
Value-based care and cost containment
Payers increasingly demand outcomes at lower total cost of care; Medicare Advantage enrollment reached about 28.6 million in 2023, intensifying payer focus on cost containment. Digital care coordination and RPM enable shared savings and lower utilization, while contracts now commonly include risk-sharing and performance fees. Demonstrable ROI and published savings metrics are critical for contract renewals and scaling.
Macroeconomic cycles and budgets
Recessions compress provider and payer budgets—IMF estimated global growth at 3.1% in 2024—lengthening sales cycles as capital projects are deferred. Demand shifts toward cost-saving software over capex-heavy devices; modular pricing and pay-as-you-go models preserve uptake. USD volatility (DXY up about 8% vs major peers 2022–24) has reduced reported international revenues.
Labor shortages and wage inflation
Clinician scarcity—AAMC projects a US physician shortfall of 37,800–124,000 by 2034—raises operating costs for UpHealth customers and heightens demand for workforce alternatives. Automation and virtual workforce tools become must-haves as RN turnover is ~27% (NSI 2023) with RN replacement cost ~$46,100 (NSI 2022). UpHealth can position its platforms as productivity levers, but sparse published ROI evidence risks procurement deferrals.
Consolidation among payers/providers
Consolidation among payers and providers concentrates buying power and standardizes vendor lists, raising procurement bar for UpHealth; large-system win rates unlock scale but compress pricing and margins. Post-merger integrations drive upsell opportunities into care management and digital front-end services, while losing a single system deal can swing ARR by multiple percentage points for mid-market vendors.
- Concentration increases procurement leverage
- Wins yield scale but pressure on pricing
- Integrations = upsell channels
- Single-system losses can move ARR materially
Access to capital and cost of debt
- Interest rates: 5.25–5.5% (H1 2025)
- SaaS multiples: ~4x EV/Revenue (2024)
- Models: pay-as-you-go lowers entry barriers; strong unit economics improve investor appetite
Parity in ~39+DC and national strategies normalize telehealth at 5–8%
Payer focus on outcomes intensifies—Medicare Advantage ~28.6M (2023)—forcing risk-sharing and ROI proofs. Higher rates (fed funds 5.25–5.5% H1 2025) compress SaaS valuations (~4x EV/Rev 2024) and favor consumption pricing. Clinician gap (AAMC 37,800–124,000 by 2034) and RN turnover ~27% (NSI 2023) raise demand for automation.
| Metric | Value |
|---|---|
| MA enrollment (2023) | 28.6M |
| Fed funds (H1 2025) | 5.25–5.5% |
| SaaS EV/Rev (2024) | ~4x |
| Physician shortfall | 37,800–124,000 (2034) |
What You See Is What You Get
UpHealth PESTLE Analysis
The preview shown here is the exact document you’ll receive after purchase—fully formatted and ready to use. This UpHealth PESTLE Analysis delivers concise political, economic, social, technological, legal, and environmental insights tailored to digital health strategy. No placeholders or teasers; the file is final and download-ready.
Original: $10.00
-65%$10.00
$3.50Description
Skip the Research. Get the Strategy.
Gain a strategic advantage with our PESTLE Analysis of UpHealth—three to five concise external forces explained to show how politics, economics, and technology shape growth and risk. Ideal for investors and strategists, this analysis is ready to apply in decisions and presentations. Purchase the full report for the complete, editable breakdown and actionable recommendations.
Political factors
Telehealth reimbursement and public funding
Government reimbursement parity drives adoption and pricing power; as of 2024 roughly 39 states plus DC have telehealth payment parity laws, supporting provider revenue. Policy shifts in Medicare/Medicaid and national health systems—after COVID-era expansions—can rapidly expand or constrain volumes, with telehealth now representing roughly 10–15% of outpatient visits in many markets. Elections and budget cycles create coverage volatility that can swing utilization and revenue. UpHealth must monitor regulatory changes and lobby to maintain favorable rates.
National digital health strategies
Many countries now treat e-health, EHR integration and virtual care as strategic priorities, with over 70% of OECD and emerging-market governments publishing national digital health strategies by 2024. Dedicated grants and procurement frameworks—including multi‑year funding pools—have accelerated platform uptake, often enabling pilots to scale within 12–24 months. Priority alignment has driven faster tenders and deployments; misalignment commonly delays tenders and elongates sales cycles by 6–12 months.
Cross-border service regulations
Operating globally exposes UpHealth to differing telemedicine rules across 50 US states and 27 EU member states, creating licensing and reimbursement variability. Restrictions on cross-border care and provider presence—compounded by GDPR transfer rules and data localization policies in China, Russia and India—shape delivery models. Local partnerships help navigate compliance and enable in‑market provider models.
Behavioral health policy emphasis
Governments have elevated mental health access post-pandemic: WHO reported a 25% global rise in anxiety and depression in 2020, and CDC recorded a 154% surge in telehealth visits in March 2020; CMS and many states expanded telebehavioral reimbursement, while policy targets in several health systems push digital triage to under 4 weeks; budget cuts or stigma-driven politics could reverse gains.
- Funding growth: expanded Medicare/state reimbursement
- Access target: digital triage <4 weeks in multiple systems
- Risk: political cuts or stigma may roll back progress
Public health emergency readiness
Preparedness agendas have funded virtual surge capacity, with telehealth visits rising more than 50-fold in 2020 (HHS) and stabilizing around 5–8% of outpatient visits by 2023; emergency waivers temporarily broadened licensure and reimbursement but lapsed rules often push utilization back toward baseline. UpHealth must build offerings that function under both expanded-waiver and post-waiver regimes to protect revenue and care continuity.
- Funded surge capacity: federal/state grants
- Waivers: temporary licensure/reimbursement expansion
- Normalization risk: utilization ~5–8% (2023)
- Action: design policy-resilient products
Parity in ~39+DC and national strategies normalize telehealth at 5–8%
Reimbursement parity in ~39 states+DC and expanded Medicare/state coverage drove adoption; telehealth now ~10–15% of outpatient visits in many markets but normalized to ~5–8% by 2023. Over 70% of OECD/emerging economies had national digital health strategies by 2024, accelerating procurement. Cross‑border rules, GDPR and localization create licensing/reimbursement variability requiring local partnerships.
| Metric | 2023–2024 |
|---|---|
| States with parity | ~39+DC |
| Telehealth share | 10–15% peak; 5–8% 2023 |
| Govt strategies | >70% OECD/emerging |
What is included in the product
Detailed Word Document
Explores how external macro-environmental factors uniquely affect UpHealth across Political, Economic, Social, Technological, Environmental and Legal dimensions, providing data-backed insights and region-specific market and regulatory context. Designed for executives, consultants and investors, the analysis delivers detailed sub-points, forward-looking scenario insights and clean formatting ready for business plans, pitch decks or internal reports.
Customizable Excel Spreadsheet
A concise, visually segmented UpHealth PESTLE summary that relieves pain points by highlighting external risks and opportunities for quick inclusion in presentations, team alignment and consultant reports, with editable notes for regional or business-line context.
Economic factors
Value-based care and cost containment
Payers increasingly demand outcomes at lower total cost of care; Medicare Advantage enrollment reached about 28.6 million in 2023, intensifying payer focus on cost containment. Digital care coordination and RPM enable shared savings and lower utilization, while contracts now commonly include risk-sharing and performance fees. Demonstrable ROI and published savings metrics are critical for contract renewals and scaling.
Macroeconomic cycles and budgets
Recessions compress provider and payer budgets—IMF estimated global growth at 3.1% in 2024—lengthening sales cycles as capital projects are deferred. Demand shifts toward cost-saving software over capex-heavy devices; modular pricing and pay-as-you-go models preserve uptake. USD volatility (DXY up about 8% vs major peers 2022–24) has reduced reported international revenues.
Labor shortages and wage inflation
Clinician scarcity—AAMC projects a US physician shortfall of 37,800–124,000 by 2034—raises operating costs for UpHealth customers and heightens demand for workforce alternatives. Automation and virtual workforce tools become must-haves as RN turnover is ~27% (NSI 2023) with RN replacement cost ~$46,100 (NSI 2022). UpHealth can position its platforms as productivity levers, but sparse published ROI evidence risks procurement deferrals.
Consolidation among payers/providers
Consolidation among payers and providers concentrates buying power and standardizes vendor lists, raising procurement bar for UpHealth; large-system win rates unlock scale but compress pricing and margins. Post-merger integrations drive upsell opportunities into care management and digital front-end services, while losing a single system deal can swing ARR by multiple percentage points for mid-market vendors.
- Concentration increases procurement leverage
- Wins yield scale but pressure on pricing
- Integrations = upsell channels
- Single-system losses can move ARR materially
Access to capital and cost of debt
- Interest rates: 5.25–5.5% (H1 2025)
- SaaS multiples: ~4x EV/Revenue (2024)
- Models: pay-as-you-go lowers entry barriers; strong unit economics improve investor appetite
Parity in ~39+DC and national strategies normalize telehealth at 5–8%
Payer focus on outcomes intensifies—Medicare Advantage ~28.6M (2023)—forcing risk-sharing and ROI proofs. Higher rates (fed funds 5.25–5.5% H1 2025) compress SaaS valuations (~4x EV/Rev 2024) and favor consumption pricing. Clinician gap (AAMC 37,800–124,000 by 2034) and RN turnover ~27% (NSI 2023) raise demand for automation.
| Metric | Value |
|---|---|
| MA enrollment (2023) | 28.6M |
| Fed funds (H1 2025) | 5.25–5.5% |
| SaaS EV/Rev (2024) | ~4x |
| Physician shortfall | 37,800–124,000 (2034) |
What You See Is What You Get
UpHealth PESTLE Analysis
The preview shown here is the exact document you’ll receive after purchase—fully formatted and ready to use. This UpHealth PESTLE Analysis delivers concise political, economic, social, technological, legal, and environmental insights tailored to digital health strategy. No placeholders or teasers; the file is final and download-ready.











