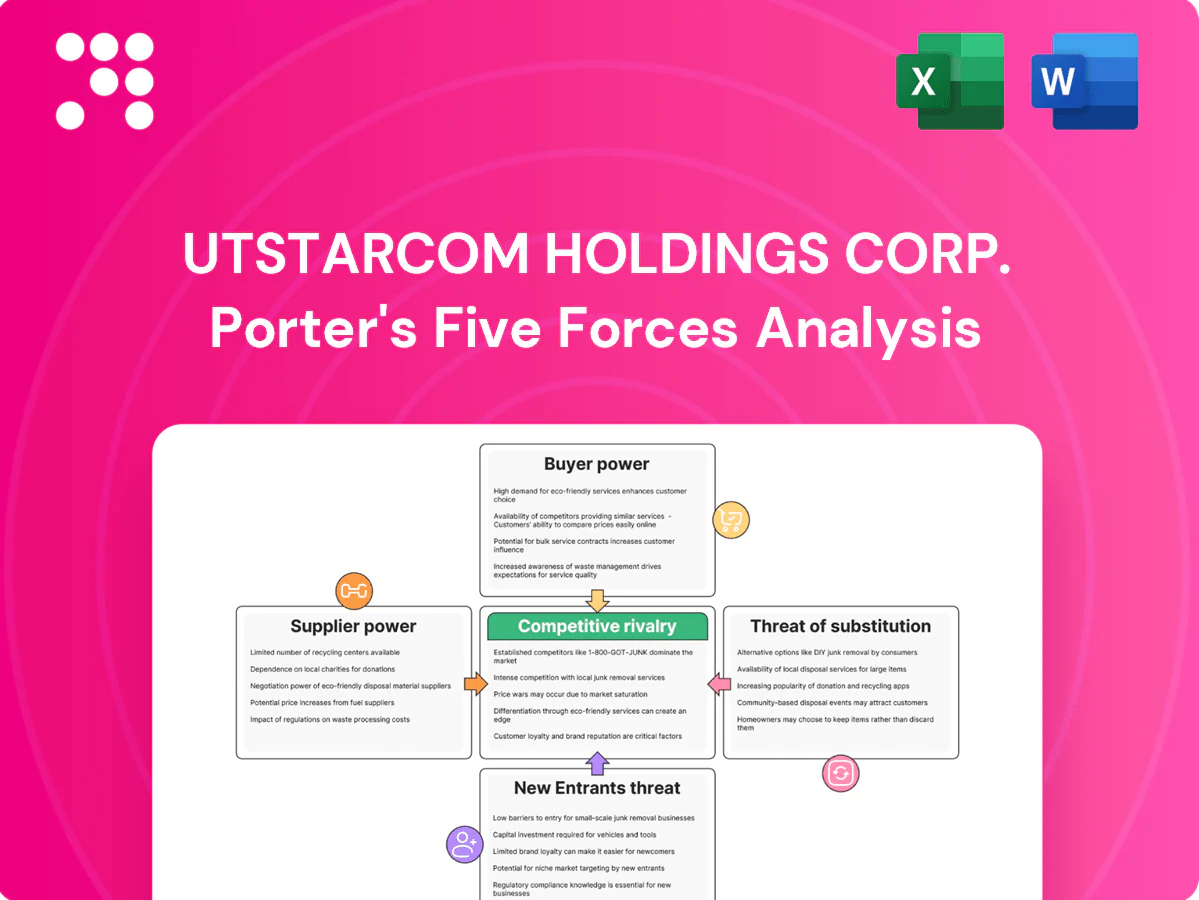
UTStarcom Holdings Corp. Porter's Five Forces Analysis

From Overview to Strategy Blueprint
UTStarcom faces moderate buyer power and intense technological substitution pressures as legacy telecom hardware competes with cloud-native and software-defined alternatives, while supplier leverage is tempered by commoditized components and outsourcing options. Barriers to entry are mixed—niche product expertise helps but scale is crucial. This brief snapshot only scratches the surface. Unlock the full Porter's Five Forces Analysis to explore UTStarcom Holdings Corp.’s competitive dynamics, market pressures, and strategic advantages in detail.
Suppliers Bargaining Power

Concentrated high-tech component sources
Core inputs—advanced semiconductors, optical modules and network processors—originate from a narrow set of tier-1 vendors (eg TSMC, Broadcom, Intel), concentrating supply and weakening UTStarcom’s price and lead-time leverage. Historical upcycles have pushed semiconductor lead times past 20 weeks, amplifying supply risk during demand surges. Dual-sourcing and design-for-alternatives reduce but do not eliminate exposure to bottlenecks and single-vendor constraints.
Contract manufacturing dependence
UTStarcom's reliance on outsourced EMS/ODM partners means suppliers shape cost, quality and delivery; the global EMS market exceeded $500B in 2024 and the top 5 EMS firms account for roughly 60% of revenue, allowing larger providers to extract stronger terms and pass fewer savings to smaller OEMs. Switching manufacturers often requires tooling and qualification costs typically in the $0.5–5M range, while multi‑year contracts and volume commitments partially mitigate supplier leverage.

Standards and licensed IP vendors
Compliance with telecom standards forces UTStarcom to license IP cores and protocol stacks, and in 2024 the global telecom equipment market was roughly $150 billion, intensifying competition for scarce SEPs. IP holders can command royalties and contractual terms that compress UTStarcom margins, with typical royalty burdens commonly cited in industry reports at 1–3% of device revenues. Limited substitutes for critical IP raise supplier leverage, while strategic partnerships or cross-licensing deals can secure more favorable licensing and lower effective royalty costs.

Software and OS ecosystem reliance
Control-plane software, NOS elements and security libraries are essential for UTStarcom's product stability and updates, making those suppliers strategically important. Proprietary modules or dominant open-source contributors can shape roadmap and SLAs, increasing supplier leverage. High integration and certification costs create implicit switching power, though investing in in-house stacks reduces dependency over time.
- Vendor lock: proprietary NOS modules
- OSS influence: key maintainers affect support
- Integration cost: certification and testing
- Mitigation: gradual in-house development
Logistics and geopolitical constraints
Export controls, tariffs, and regional compliance rules constrain UTStarcom’s sourcing choices, forcing certification and alternate sourcing for components from restricted jurisdictions.
Logistics bottlenecks elevate freight costs and cause shipment delays, while suppliers in sensitive jurisdictions face extra export scrutiny and licensing hurdles.
Maintaining diversified supply chains and multi-region suppliers buffers shocks and reduces single-source dependencies.
- Export controls impact sourcing
- Tariffs raise input costs
- Logistics bottlenecks delay delivery
- Sensitive-jurisdiction scrutiny
- Diversification mitigates risk
Supply squeeze: semis lead times >20 wks, EMS $500B/top-5 ~60%, royalties 1–3%
Suppliers exert high bargaining power: critical semiconductors (lead times >20 weeks in upcycles) and optical/network ASICs come from few tier‑1 vendors, constraining price and delivery leverage. EMS concentration (global market ~$500B in 2024; top‑5 ≈60%) and SEP royalty pressures (telecom market ~$150B; royalties ~1–3%) compress margins.
| Category | 2024 metric | Impact |
|---|---|---|
| Semiconductors | Lead times >20 wks | High supply risk |
| EMS | $500B; top‑5 ~60% | Stronger supplier terms |
| Royalties | 1–3% revenue | Margin pressure |
What is included in the product
 Detailed Word Document
Concise Porter's Five Forces analysis of UTStarcom Holdings Corp. highlighting competitive rivalry and substitute threats in telecom equipment, buyer and supplier bargaining power shaping pricing and margins, entry barriers from technology and scale, and emerging disruptive forces (5G, cloud-native networking) that could erode market share.

 Customizable Excel Spreadsheet
A clear one-sheet Porter's Five Forces for UTStarcom Holdings Corp.—quickly highlights supplier, buyer, competitive, entrant and substitution pressures to pinpoint strategic pain points. Customizable pressure levels and an instant radar chart let teams test scenarios and copy visuals into decks without complex tools.
Customers Bargaining Power

Highly concentrated carrier customers
Telecom operators are few, large, and sophisticated buyers—in China alone three national carriers (China Mobile, China Telecom, China Unicom) dominate demand—driving aggressive price and service requirements. Their scale and centralized procurement committees amplify leverage through consolidated RFPs and volume discounts. UTStarcom must win competitive RFPs by demonstrating superior total cost of ownership, service SLAs, and rapid deployment economics.
Stringent RFPs and long cycles
Procurement for UTStarcom often requires trials, PoCs and certifications, with PoCs commonly lasting 3–6 months and full RFP cycles frequently exceeding 12 months. Extended timelines intensify price negotiations and tougher payment terms as buyers seek leverage. Buyers routinely play vendors against each other through competitive RFPs. Reference wins and proven interoperability materially reduce buyer leverage by shortening validation steps.

High switching costs with multiyear lock-in
Once deployed, UTStarcom transport gear integrates tightly with OSS/BSS and field operations, creating multiyear lock-ins typically spanning 3–5 years. Replacement risks service disruption and retraining, with large carriers reporting downtime costs in the low- to mid-six figures per incident. This stickiness moderates buyer power after deployment. Strong SLAs and lifecycle support further reinforce retention and lower churn.

Demand for bundled solutions and services
Carriers increasingly demand turnkey, integrated and managed solutions, pressuring UTStarcom to bundle hardware, software and services; global telecom services revenue reached about 1.7 trillion USD in 2024, driving scale expectations. Bundling expands project scope but raises concession pressure on margins. Offering value-added services and outcome-based KPIs lets UTStarcom justify premiums and align incentives with carriers.
- Bundling raises scope but squeezes margins
- Value-added services enable premium pricing
- Outcome KPIs align incentives
Price sensitivity under capex constraints
Operators under 2024 capex discipline and tighter regulation push intense price sensitivity for UTStarcom; capex-to-revenue norms (~10–15%) force buyers to prioritize TCO, energy efficiency and rack/space savings when evaluating equipment.
- Discounting and vendor financing drive procurement decisions
- Clear ROI cases cut price pressure
- Energy/TCO metrics decisive
Large national carriers' centralized RFPs, long PoCs and 3-5yr lock-ins squeeze margins
Large national carriers (eg China Mobile/China Telecom/China Unicom) exert high bargaining power via centralized RFPs, long PoCs (3–6 months) and 12+ month RFP cycles, forcing TCO and SLA focus. Post-deployment 3–5 year lock-ins and high downtime costs (low–mid six figures) reduce churn; 2024 telecom services revenue ~1.7T USD intensifies scale demands and margin pressure.
| Metric | Value (2024) |
|---|---|
| Global telecom services | ~1.7T USD |
| PoC length | 3–6 months |
| RFP cycle | 12+ months |
| Lock-in | 3–5 years |
| Capex/rev norms | 10–15% |
Preview the Actual Deliverable
UTStarcom Holdings Corp. Porter's Five Forces Analysis
This preview shows the exact Porter's Five Forces analysis for UTStarcom Holdings Corp. you'll receive immediately after purchase—no surprises or placeholders. The document is professionally formatted, complete, and ready to download and use the moment you buy. It includes detailed assessment of competitive rivalry, supplier and buyer power, threat of substitutes, and barriers to entry. You're viewing the final deliverable.

From Overview to Strategy Blueprint
UTStarcom faces moderate buyer power and intense technological substitution pressures as legacy telecom hardware competes with cloud-native and software-defined alternatives, while supplier leverage is tempered by commoditized components and outsourcing options. Barriers to entry are mixed—niche product expertise helps but scale is crucial. This brief snapshot only scratches the surface. Unlock the full Porter's Five Forces Analysis to explore UTStarcom Holdings Corp.’s competitive dynamics, market pressures, and strategic advantages in detail.
Suppliers Bargaining Power
Concentrated high-tech component sources
Core inputs—advanced semiconductors, optical modules and network processors—originate from a narrow set of tier-1 vendors (eg TSMC, Broadcom, Intel), concentrating supply and weakening UTStarcom’s price and lead-time leverage. Historical upcycles have pushed semiconductor lead times past 20 weeks, amplifying supply risk during demand surges. Dual-sourcing and design-for-alternatives reduce but do not eliminate exposure to bottlenecks and single-vendor constraints.
Contract manufacturing dependence
UTStarcom's reliance on outsourced EMS/ODM partners means suppliers shape cost, quality and delivery; the global EMS market exceeded $500B in 2024 and the top 5 EMS firms account for roughly 60% of revenue, allowing larger providers to extract stronger terms and pass fewer savings to smaller OEMs. Switching manufacturers often requires tooling and qualification costs typically in the $0.5–5M range, while multi‑year contracts and volume commitments partially mitigate supplier leverage.
Standards and licensed IP vendors
Compliance with telecom standards forces UTStarcom to license IP cores and protocol stacks, and in 2024 the global telecom equipment market was roughly $150 billion, intensifying competition for scarce SEPs. IP holders can command royalties and contractual terms that compress UTStarcom margins, with typical royalty burdens commonly cited in industry reports at 1–3% of device revenues. Limited substitutes for critical IP raise supplier leverage, while strategic partnerships or cross-licensing deals can secure more favorable licensing and lower effective royalty costs.
Software and OS ecosystem reliance
Control-plane software, NOS elements and security libraries are essential for UTStarcom's product stability and updates, making those suppliers strategically important. Proprietary modules or dominant open-source contributors can shape roadmap and SLAs, increasing supplier leverage. High integration and certification costs create implicit switching power, though investing in in-house stacks reduces dependency over time.
- Vendor lock: proprietary NOS modules
- OSS influence: key maintainers affect support
- Integration cost: certification and testing
- Mitigation: gradual in-house development
Logistics and geopolitical constraints
Export controls, tariffs, and regional compliance rules constrain UTStarcom’s sourcing choices, forcing certification and alternate sourcing for components from restricted jurisdictions.
Logistics bottlenecks elevate freight costs and cause shipment delays, while suppliers in sensitive jurisdictions face extra export scrutiny and licensing hurdles.
Maintaining diversified supply chains and multi-region suppliers buffers shocks and reduces single-source dependencies.
- Export controls impact sourcing
- Tariffs raise input costs
- Logistics bottlenecks delay delivery
- Sensitive-jurisdiction scrutiny
- Diversification mitigates risk
Supply squeeze: semis lead times >20 wks, EMS $500B/top-5 ~60%, royalties 1–3%
Suppliers exert high bargaining power: critical semiconductors (lead times >20 weeks in upcycles) and optical/network ASICs come from few tier‑1 vendors, constraining price and delivery leverage. EMS concentration (global market ~$500B in 2024; top‑5 ≈60%) and SEP royalty pressures (telecom market ~$150B; royalties ~1–3%) compress margins.
| Category | 2024 metric | Impact |
|---|---|---|
| Semiconductors | Lead times >20 wks | High supply risk |
| EMS | $500B; top‑5 ~60% | Stronger supplier terms |
| Royalties | 1–3% revenue | Margin pressure |
What is included in the product
Detailed Word Document
Concise Porter's Five Forces analysis of UTStarcom Holdings Corp. highlighting competitive rivalry and substitute threats in telecom equipment, buyer and supplier bargaining power shaping pricing and margins, entry barriers from technology and scale, and emerging disruptive forces (5G, cloud-native networking) that could erode market share.
Customizable Excel Spreadsheet
A clear one-sheet Porter's Five Forces for UTStarcom Holdings Corp.—quickly highlights supplier, buyer, competitive, entrant and substitution pressures to pinpoint strategic pain points. Customizable pressure levels and an instant radar chart let teams test scenarios and copy visuals into decks without complex tools.
Customers Bargaining Power
Highly concentrated carrier customers
Telecom operators are few, large, and sophisticated buyers—in China alone three national carriers (China Mobile, China Telecom, China Unicom) dominate demand—driving aggressive price and service requirements. Their scale and centralized procurement committees amplify leverage through consolidated RFPs and volume discounts. UTStarcom must win competitive RFPs by demonstrating superior total cost of ownership, service SLAs, and rapid deployment economics.
Stringent RFPs and long cycles
Procurement for UTStarcom often requires trials, PoCs and certifications, with PoCs commonly lasting 3–6 months and full RFP cycles frequently exceeding 12 months. Extended timelines intensify price negotiations and tougher payment terms as buyers seek leverage. Buyers routinely play vendors against each other through competitive RFPs. Reference wins and proven interoperability materially reduce buyer leverage by shortening validation steps.
High switching costs with multiyear lock-in
Once deployed, UTStarcom transport gear integrates tightly with OSS/BSS and field operations, creating multiyear lock-ins typically spanning 3–5 years. Replacement risks service disruption and retraining, with large carriers reporting downtime costs in the low- to mid-six figures per incident. This stickiness moderates buyer power after deployment. Strong SLAs and lifecycle support further reinforce retention and lower churn.
Demand for bundled solutions and services
Carriers increasingly demand turnkey, integrated and managed solutions, pressuring UTStarcom to bundle hardware, software and services; global telecom services revenue reached about 1.7 trillion USD in 2024, driving scale expectations. Bundling expands project scope but raises concession pressure on margins. Offering value-added services and outcome-based KPIs lets UTStarcom justify premiums and align incentives with carriers.
- Bundling raises scope but squeezes margins
- Value-added services enable premium pricing
- Outcome KPIs align incentives
Price sensitivity under capex constraints
Operators under 2024 capex discipline and tighter regulation push intense price sensitivity for UTStarcom; capex-to-revenue norms (~10–15%) force buyers to prioritize TCO, energy efficiency and rack/space savings when evaluating equipment.
- Discounting and vendor financing drive procurement decisions
- Clear ROI cases cut price pressure
- Energy/TCO metrics decisive
Large national carriers' centralized RFPs, long PoCs and 3-5yr lock-ins squeeze margins
Large national carriers (eg China Mobile/China Telecom/China Unicom) exert high bargaining power via centralized RFPs, long PoCs (3–6 months) and 12+ month RFP cycles, forcing TCO and SLA focus. Post-deployment 3–5 year lock-ins and high downtime costs (low–mid six figures) reduce churn; 2024 telecom services revenue ~1.7T USD intensifies scale demands and margin pressure.
| Metric | Value (2024) |
|---|---|
| Global telecom services | ~1.7T USD |
| PoC length | 3–6 months |
| RFP cycle | 12+ months |
| Lock-in | 3–5 years |
| Capex/rev norms | 10–15% |
Preview the Actual Deliverable
UTStarcom Holdings Corp. Porter's Five Forces Analysis
This preview shows the exact Porter's Five Forces analysis for UTStarcom Holdings Corp. you'll receive immediately after purchase—no surprises or placeholders. The document is professionally formatted, complete, and ready to download and use the moment you buy. It includes detailed assessment of competitive rivalry, supplier and buyer power, threat of substitutes, and barriers to entry. You're viewing the final deliverable.
Description
From Overview to Strategy Blueprint
UTStarcom faces moderate buyer power and intense technological substitution pressures as legacy telecom hardware competes with cloud-native and software-defined alternatives, while supplier leverage is tempered by commoditized components and outsourcing options. Barriers to entry are mixed—niche product expertise helps but scale is crucial. This brief snapshot only scratches the surface. Unlock the full Porter's Five Forces Analysis to explore UTStarcom Holdings Corp.’s competitive dynamics, market pressures, and strategic advantages in detail.
Suppliers Bargaining Power
Concentrated high-tech component sources
Core inputs—advanced semiconductors, optical modules and network processors—originate from a narrow set of tier-1 vendors (eg TSMC, Broadcom, Intel), concentrating supply and weakening UTStarcom’s price and lead-time leverage. Historical upcycles have pushed semiconductor lead times past 20 weeks, amplifying supply risk during demand surges. Dual-sourcing and design-for-alternatives reduce but do not eliminate exposure to bottlenecks and single-vendor constraints.
Contract manufacturing dependence
UTStarcom's reliance on outsourced EMS/ODM partners means suppliers shape cost, quality and delivery; the global EMS market exceeded $500B in 2024 and the top 5 EMS firms account for roughly 60% of revenue, allowing larger providers to extract stronger terms and pass fewer savings to smaller OEMs. Switching manufacturers often requires tooling and qualification costs typically in the $0.5–5M range, while multi‑year contracts and volume commitments partially mitigate supplier leverage.
Standards and licensed IP vendors
Compliance with telecom standards forces UTStarcom to license IP cores and protocol stacks, and in 2024 the global telecom equipment market was roughly $150 billion, intensifying competition for scarce SEPs. IP holders can command royalties and contractual terms that compress UTStarcom margins, with typical royalty burdens commonly cited in industry reports at 1–3% of device revenues. Limited substitutes for critical IP raise supplier leverage, while strategic partnerships or cross-licensing deals can secure more favorable licensing and lower effective royalty costs.
Software and OS ecosystem reliance
Control-plane software, NOS elements and security libraries are essential for UTStarcom's product stability and updates, making those suppliers strategically important. Proprietary modules or dominant open-source contributors can shape roadmap and SLAs, increasing supplier leverage. High integration and certification costs create implicit switching power, though investing in in-house stacks reduces dependency over time.
- Vendor lock: proprietary NOS modules
- OSS influence: key maintainers affect support
- Integration cost: certification and testing
- Mitigation: gradual in-house development
Logistics and geopolitical constraints
Export controls, tariffs, and regional compliance rules constrain UTStarcom’s sourcing choices, forcing certification and alternate sourcing for components from restricted jurisdictions.
Logistics bottlenecks elevate freight costs and cause shipment delays, while suppliers in sensitive jurisdictions face extra export scrutiny and licensing hurdles.
Maintaining diversified supply chains and multi-region suppliers buffers shocks and reduces single-source dependencies.
- Export controls impact sourcing
- Tariffs raise input costs
- Logistics bottlenecks delay delivery
- Sensitive-jurisdiction scrutiny
- Diversification mitigates risk
Supply squeeze: semis lead times >20 wks, EMS $500B/top-5 ~60%, royalties 1–3%
Suppliers exert high bargaining power: critical semiconductors (lead times >20 weeks in upcycles) and optical/network ASICs come from few tier‑1 vendors, constraining price and delivery leverage. EMS concentration (global market ~$500B in 2024; top‑5 ≈60%) and SEP royalty pressures (telecom market ~$150B; royalties ~1–3%) compress margins.
| Category | 2024 metric | Impact |
|---|---|---|
| Semiconductors | Lead times >20 wks | High supply risk |
| EMS | $500B; top‑5 ~60% | Stronger supplier terms |
| Royalties | 1–3% revenue | Margin pressure |
What is included in the product
Detailed Word Document
Concise Porter's Five Forces analysis of UTStarcom Holdings Corp. highlighting competitive rivalry and substitute threats in telecom equipment, buyer and supplier bargaining power shaping pricing and margins, entry barriers from technology and scale, and emerging disruptive forces (5G, cloud-native networking) that could erode market share.
Customizable Excel Spreadsheet
A clear one-sheet Porter's Five Forces for UTStarcom Holdings Corp.—quickly highlights supplier, buyer, competitive, entrant and substitution pressures to pinpoint strategic pain points. Customizable pressure levels and an instant radar chart let teams test scenarios and copy visuals into decks without complex tools.
Customers Bargaining Power
Highly concentrated carrier customers
Telecom operators are few, large, and sophisticated buyers—in China alone three national carriers (China Mobile, China Telecom, China Unicom) dominate demand—driving aggressive price and service requirements. Their scale and centralized procurement committees amplify leverage through consolidated RFPs and volume discounts. UTStarcom must win competitive RFPs by demonstrating superior total cost of ownership, service SLAs, and rapid deployment economics.
Stringent RFPs and long cycles
Procurement for UTStarcom often requires trials, PoCs and certifications, with PoCs commonly lasting 3–6 months and full RFP cycles frequently exceeding 12 months. Extended timelines intensify price negotiations and tougher payment terms as buyers seek leverage. Buyers routinely play vendors against each other through competitive RFPs. Reference wins and proven interoperability materially reduce buyer leverage by shortening validation steps.
High switching costs with multiyear lock-in
Once deployed, UTStarcom transport gear integrates tightly with OSS/BSS and field operations, creating multiyear lock-ins typically spanning 3–5 years. Replacement risks service disruption and retraining, with large carriers reporting downtime costs in the low- to mid-six figures per incident. This stickiness moderates buyer power after deployment. Strong SLAs and lifecycle support further reinforce retention and lower churn.
Demand for bundled solutions and services
Carriers increasingly demand turnkey, integrated and managed solutions, pressuring UTStarcom to bundle hardware, software and services; global telecom services revenue reached about 1.7 trillion USD in 2024, driving scale expectations. Bundling expands project scope but raises concession pressure on margins. Offering value-added services and outcome-based KPIs lets UTStarcom justify premiums and align incentives with carriers.
- Bundling raises scope but squeezes margins
- Value-added services enable premium pricing
- Outcome KPIs align incentives
Price sensitivity under capex constraints
Operators under 2024 capex discipline and tighter regulation push intense price sensitivity for UTStarcom; capex-to-revenue norms (~10–15%) force buyers to prioritize TCO, energy efficiency and rack/space savings when evaluating equipment.
- Discounting and vendor financing drive procurement decisions
- Clear ROI cases cut price pressure
- Energy/TCO metrics decisive
Large national carriers' centralized RFPs, long PoCs and 3-5yr lock-ins squeeze margins
Large national carriers (eg China Mobile/China Telecom/China Unicom) exert high bargaining power via centralized RFPs, long PoCs (3–6 months) and 12+ month RFP cycles, forcing TCO and SLA focus. Post-deployment 3–5 year lock-ins and high downtime costs (low–mid six figures) reduce churn; 2024 telecom services revenue ~1.7T USD intensifies scale demands and margin pressure.
| Metric | Value (2024) |
|---|---|
| Global telecom services | ~1.7T USD |
| PoC length | 3–6 months |
| RFP cycle | 12+ months |
| Lock-in | 3–5 years |
| Capex/rev norms | 10–15% |
Preview the Actual Deliverable
UTStarcom Holdings Corp. Porter's Five Forces Analysis
This preview shows the exact Porter's Five Forces analysis for UTStarcom Holdings Corp. you'll receive immediately after purchase—no surprises or placeholders. The document is professionally formatted, complete, and ready to download and use the moment you buy. It includes detailed assessment of competitive rivalry, supplier and buyer power, threat of substitutes, and barriers to entry. You're viewing the final deliverable.











