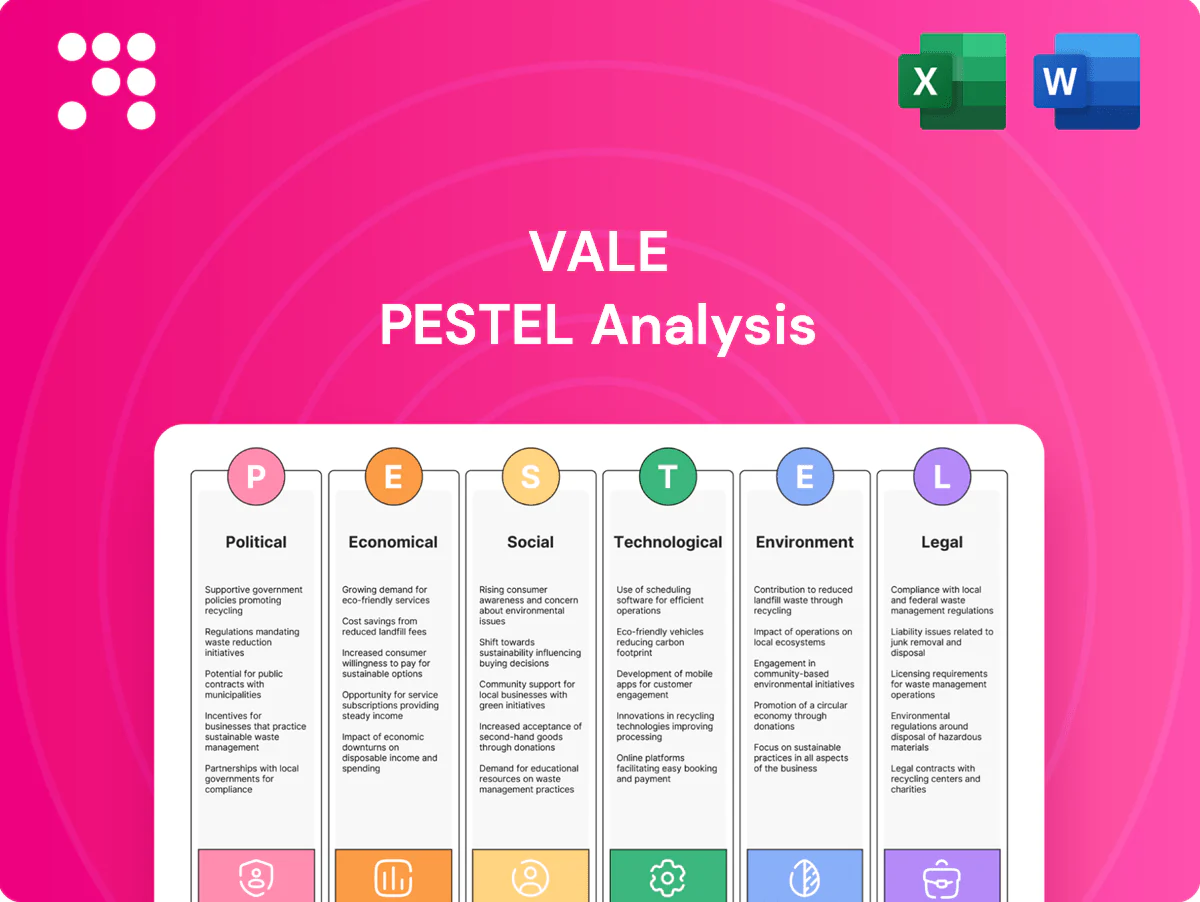
Vale PESTLE Analysis

Make Smarter Strategic Decisions with a Complete PESTEL View
Explore how political, economic, social, technological, legal and environmental forces are shaping Vale's strategic outlook. This PESTLE highlights regulatory risks, commodity cycles, ESG pressures and tech adoption affecting operations and valuation. Ideal for investors and strategists seeking actionable external insights. Purchase the full analysis to get the complete, downloadable report.
Political factors

Resource nationalism risk
Resource nationalism risk: host governments can tighten royalties, local-content and export rules, directly affecting Vale’s iron ore and nickel projects; iron ore and nickel account for roughly 70% of Vale’s revenue mix, raising sensitivity. Policy shifts in Brazil and provincial moves in Canada or Indonesia can change project economics, while elections and coalition changes may reset concessions and tax incentives; proactive government relations and scenario planning are essential.
Brazilian policy stability
Vale’s core operations remain concentrated in Brazil, with over 70% of its iron ore production and critical logistics networks headquartered there, making federal fiscal, infrastructure and permitting policy material to company performance. Federal-state alignment shapes timing of rail and port concessions and environmental licenses, where delays have historically pushed project capex timelines beyond original budgets. Political volatility and shifting regulatory priorities can slow approvals and increase execution risk, while Vale’s geographic diversification outside Brazil partly tempers this concentration risk.

China industrial policy
China’s industrial policy—with crude steel output around 1.04 billion tonnes in 2024 and NEV sales roughly 13.5 million—sustains strong seaborne iron ore and nickel demand, underpinning Vale volumes and pricing. Capacity controls, stimulus rounds and decarbonization mandates are lifting high-grade and pellet premiums, shifting demand toward low-impurity ores. Diplomatic tensions affect customs scrutiny and freight/pricing spreads, so close monitoring of NDRC guidance and monthly import notices is critical to forecast flows.

Trade and tariffs
Shifts in tariffs, CBAM transitional reporting (2023–2025) with full application from 2026, and quotas can re-route Vale shipments and raise delivered costs; sanctions or export controls on critical mining equipment (eg. dual‑use tech) constrain sourcing and cap replacement options. Cross‑border rail and port access hinge on bilateral agreements, making logistics corridors vulnerable; hedging route risk preserves margins.
- CBAM timeline: transitional 2023–2025, full from 2026
- Sanctions/export controls risk equipment supply
- Rail/port access=bilateral agreements
- Route hedging maintains margins
Community and indigenous politics
Local political leaders and indigenous councils materially affect Vale's social license to operate, especially in places where Vale operates in 30+ countries; municipal elections (eg Oct 2024 in Brazil) can reset benefit and jobs expectations and trigger renegotiations. Contested consultations and legal challenges delay projects, raising carrying costs, while structured agreements and grievance mechanisms reduce disruption and litigation risk.
Resource nationalism, tax changes threaten margins of major iron ore and nickel producer
Resource nationalism and tax/royalty shifts threaten Vale’s iron ore/nickel margins (iron ore + nickel ≈70% revenue). Brazil concentration (>70% iron ore prod) makes federal/state policy and elections material. China demand (crude steel ~1.04bn t in 2024) supports seaborne prices; CBAM full from 2026 alters EU demand routing.
| Metric | Value |
|---|---|
| Brazil share | >70% |
| China steel 2024 | 1.04bn t |
| CBAM | Full 2026 |
What is included in the product
 Detailed Word Document
Explores how Political, Economic, Social, Technological, Environmental and Legal forces uniquely shape Vale’s risk and opportunity profile, with data-backed trends and industry-specific examples; designed for executives and investors to inform strategy, scenario planning and external-report‑ready outputs.

 Customizable Excel Spreadsheet
Visually segmented by PESTLE categories for quick interpretation, this concise Vale analysis can be dropped into presentations or strategy packs and is easily shared to align teams and support external risk discussions.
Economic factors

Cyclic commodity prices
Cyclic iron ore and nickel price swings drive Vale’s cash flow and capex timing, with iron ore 62% CFR around USD 110/ton and LME nickel near USD 22,000/ton in mid‑2025 influencing project pacing. High operating leverage amplifies profits in upcycles and losses in downcycles, shifting free cash flow volatility. Price floors depend on global cost curves and Chinese steel demand, while disciplined capital allocation and hedging have reduced EBITDA volatility.
Global growth and steel demand
Infrastructure and construction cycles drive iron ore volumes as global crude steel output was about 1,878 Mt in 2023, with China ~980 Mt, linking Vale volumes to cyclical capex. Recessions compress spreads and premiums for high-grade products, squeezing margins. Emerging market urbanization sustains baseline demand over decades. Monitoring PMIs and stimulus programs guides short‑term sales and pricing plans.

Currency and inflation
BRL volatility (roughly 10% swings 2023–24), CAD moves (around 5–8%) and USD strength (~6% in 2024) materially shift Vale’s costs and revenues; local inflation in Brazil (~4–5% in 2024) and wage growth (~5–7% in mining) pressure unit costs. Diesel, explosives and freight (freight down ~20% from 2022 peaks by 2024) feed through rapidly to COGS. Indexation clauses and productivity programs (saving on the order of US$1–2/ton) help protect margins.

Energy and freight costs
Power tariffs and fuel prices directly shape Vale’s mining and processing margins; higher Brazilian industrial tariffs and diesel at ~$1.10–$1.40/liter in 2024 pushed unit costs up. Dry bulk freight volatility (BDI ~1,100 in 2024) alters delivered prices and arbitrage windows for iron ore. Long‑haul rails and port assets need steady capex (Vale logistics capex ~ $3.5bn in 2024) to ensure reliability; energy contracting and efficiency projects have cut exposure to spot swings.
- Power tariffs impact unit cost
- Diesel prices drive fuel cost
- BDI ~1,100 (2024) affects delivered price
- Logistics capex ~ $3.5bn (2024)
- Energy contracting reduces volatility
EV and battery metals demand
Rising EV adoption (about 14 million new EVs in 2023 per IEA) drives nickel demand, but chemistry shifts matter: high-nickel NMC uptake supports demand while mass-market LFP adoption limits nickel intensity per vehicle. Policy incentives and OEM strategies (China and EU subsidies, global OEM EV targets) set the demand growth slope. Price-sensitive substitution to LFP or recycled nickel can cap upside; Vale uses strategic offtakes and prepayments to stabilize cash flows.
- nickel demand linked to EV chemistry mix
- policy/OEM stance shapes growth slope
- LFP substitution caps upside
- offtakes/prepayments stabilize Vale cashflows
Resource nationalism, tax changes threaten margins of major iron ore and nickel producer
Cyclic iron ore and nickel prices (Fe62 ~USD110/t, LME Ni ~USD22,000/t mid‑2025) drive Vale cash flow and capex timing; high operating leverage amplifies swings. BRL ~10% volatility (2023‑24), diesel $1.10–1.40/L and BDI ~1,100 (2024) shift unit costs; logistics capex ~$3.5bn (2024) secures supply. EVs ~14M new (2023) support nickel demand but LFP substitution limits upside.
| Metric | Value |
|---|---|
| Fe62 CFR | ~USD110/t |
| LME Nickel | ~USD22,000/t |
| Global steel (2023) | 1,878 Mt |
| Logistics capex (2024) | ~$3.5bn |
Same Document Delivered
Vale PESTLE Analysis
The preview shown here is the exact Vale PESTLE Analysis document you’ll receive after purchase—fully formatted, professionally structured, and ready to use. No placeholders or teasers: the content, layout, and insights visible here are the final deliverable. After checkout you’ll be able to download this same file instantly.

Make Smarter Strategic Decisions with a Complete PESTEL View
Explore how political, economic, social, technological, legal and environmental forces are shaping Vale's strategic outlook. This PESTLE highlights regulatory risks, commodity cycles, ESG pressures and tech adoption affecting operations and valuation. Ideal for investors and strategists seeking actionable external insights. Purchase the full analysis to get the complete, downloadable report.
Political factors
Resource nationalism risk
Resource nationalism risk: host governments can tighten royalties, local-content and export rules, directly affecting Vale’s iron ore and nickel projects; iron ore and nickel account for roughly 70% of Vale’s revenue mix, raising sensitivity. Policy shifts in Brazil and provincial moves in Canada or Indonesia can change project economics, while elections and coalition changes may reset concessions and tax incentives; proactive government relations and scenario planning are essential.
Brazilian policy stability
Vale’s core operations remain concentrated in Brazil, with over 70% of its iron ore production and critical logistics networks headquartered there, making federal fiscal, infrastructure and permitting policy material to company performance. Federal-state alignment shapes timing of rail and port concessions and environmental licenses, where delays have historically pushed project capex timelines beyond original budgets. Political volatility and shifting regulatory priorities can slow approvals and increase execution risk, while Vale’s geographic diversification outside Brazil partly tempers this concentration risk.
China industrial policy
China’s industrial policy—with crude steel output around 1.04 billion tonnes in 2024 and NEV sales roughly 13.5 million—sustains strong seaborne iron ore and nickel demand, underpinning Vale volumes and pricing. Capacity controls, stimulus rounds and decarbonization mandates are lifting high-grade and pellet premiums, shifting demand toward low-impurity ores. Diplomatic tensions affect customs scrutiny and freight/pricing spreads, so close monitoring of NDRC guidance and monthly import notices is critical to forecast flows.
Trade and tariffs
Shifts in tariffs, CBAM transitional reporting (2023–2025) with full application from 2026, and quotas can re-route Vale shipments and raise delivered costs; sanctions or export controls on critical mining equipment (eg. dual‑use tech) constrain sourcing and cap replacement options. Cross‑border rail and port access hinge on bilateral agreements, making logistics corridors vulnerable; hedging route risk preserves margins.
- CBAM timeline: transitional 2023–2025, full from 2026
- Sanctions/export controls risk equipment supply
- Rail/port access=bilateral agreements
- Route hedging maintains margins
Community and indigenous politics
Local political leaders and indigenous councils materially affect Vale's social license to operate, especially in places where Vale operates in 30+ countries; municipal elections (eg Oct 2024 in Brazil) can reset benefit and jobs expectations and trigger renegotiations. Contested consultations and legal challenges delay projects, raising carrying costs, while structured agreements and grievance mechanisms reduce disruption and litigation risk.
Resource nationalism, tax changes threaten margins of major iron ore and nickel producer
Resource nationalism and tax/royalty shifts threaten Vale’s iron ore/nickel margins (iron ore + nickel ≈70% revenue). Brazil concentration (>70% iron ore prod) makes federal/state policy and elections material. China demand (crude steel ~1.04bn t in 2024) supports seaborne prices; CBAM full from 2026 alters EU demand routing.
| Metric | Value |
|---|---|
| Brazil share | >70% |
| China steel 2024 | 1.04bn t |
| CBAM | Full 2026 |
What is included in the product
Detailed Word Document
Explores how Political, Economic, Social, Technological, Environmental and Legal forces uniquely shape Vale’s risk and opportunity profile, with data-backed trends and industry-specific examples; designed for executives and investors to inform strategy, scenario planning and external-report‑ready outputs.
Customizable Excel Spreadsheet
Visually segmented by PESTLE categories for quick interpretation, this concise Vale analysis can be dropped into presentations or strategy packs and is easily shared to align teams and support external risk discussions.
Economic factors
Cyclic commodity prices
Cyclic iron ore and nickel price swings drive Vale’s cash flow and capex timing, with iron ore 62% CFR around USD 110/ton and LME nickel near USD 22,000/ton in mid‑2025 influencing project pacing. High operating leverage amplifies profits in upcycles and losses in downcycles, shifting free cash flow volatility. Price floors depend on global cost curves and Chinese steel demand, while disciplined capital allocation and hedging have reduced EBITDA volatility.
Global growth and steel demand
Infrastructure and construction cycles drive iron ore volumes as global crude steel output was about 1,878 Mt in 2023, with China ~980 Mt, linking Vale volumes to cyclical capex. Recessions compress spreads and premiums for high-grade products, squeezing margins. Emerging market urbanization sustains baseline demand over decades. Monitoring PMIs and stimulus programs guides short‑term sales and pricing plans.
Currency and inflation
BRL volatility (roughly 10% swings 2023–24), CAD moves (around 5–8%) and USD strength (~6% in 2024) materially shift Vale’s costs and revenues; local inflation in Brazil (~4–5% in 2024) and wage growth (~5–7% in mining) pressure unit costs. Diesel, explosives and freight (freight down ~20% from 2022 peaks by 2024) feed through rapidly to COGS. Indexation clauses and productivity programs (saving on the order of US$1–2/ton) help protect margins.
Energy and freight costs
Power tariffs and fuel prices directly shape Vale’s mining and processing margins; higher Brazilian industrial tariffs and diesel at ~$1.10–$1.40/liter in 2024 pushed unit costs up. Dry bulk freight volatility (BDI ~1,100 in 2024) alters delivered prices and arbitrage windows for iron ore. Long‑haul rails and port assets need steady capex (Vale logistics capex ~ $3.5bn in 2024) to ensure reliability; energy contracting and efficiency projects have cut exposure to spot swings.
- Power tariffs impact unit cost
- Diesel prices drive fuel cost
- BDI ~1,100 (2024) affects delivered price
- Logistics capex ~ $3.5bn (2024)
- Energy contracting reduces volatility
EV and battery metals demand
Rising EV adoption (about 14 million new EVs in 2023 per IEA) drives nickel demand, but chemistry shifts matter: high-nickel NMC uptake supports demand while mass-market LFP adoption limits nickel intensity per vehicle. Policy incentives and OEM strategies (China and EU subsidies, global OEM EV targets) set the demand growth slope. Price-sensitive substitution to LFP or recycled nickel can cap upside; Vale uses strategic offtakes and prepayments to stabilize cash flows.
- nickel demand linked to EV chemistry mix
- policy/OEM stance shapes growth slope
- LFP substitution caps upside
- offtakes/prepayments stabilize Vale cashflows
Resource nationalism, tax changes threaten margins of major iron ore and nickel producer
Cyclic iron ore and nickel prices (Fe62 ~USD110/t, LME Ni ~USD22,000/t mid‑2025) drive Vale cash flow and capex timing; high operating leverage amplifies swings. BRL ~10% volatility (2023‑24), diesel $1.10–1.40/L and BDI ~1,100 (2024) shift unit costs; logistics capex ~$3.5bn (2024) secures supply. EVs ~14M new (2023) support nickel demand but LFP substitution limits upside.
| Metric | Value |
|---|---|
| Fe62 CFR | ~USD110/t |
| LME Nickel | ~USD22,000/t |
| Global steel (2023) | 1,878 Mt |
| Logistics capex (2024) | ~$3.5bn |
Same Document Delivered
Vale PESTLE Analysis
The preview shown here is the exact Vale PESTLE Analysis document you’ll receive after purchase—fully formatted, professionally structured, and ready to use. No placeholders or teasers: the content, layout, and insights visible here are the final deliverable. After checkout you’ll be able to download this same file instantly.
Original: $10.00
-65%$10.00
$3.50Description
Make Smarter Strategic Decisions with a Complete PESTEL View
Explore how political, economic, social, technological, legal and environmental forces are shaping Vale's strategic outlook. This PESTLE highlights regulatory risks, commodity cycles, ESG pressures and tech adoption affecting operations and valuation. Ideal for investors and strategists seeking actionable external insights. Purchase the full analysis to get the complete, downloadable report.
Political factors
Resource nationalism risk
Resource nationalism risk: host governments can tighten royalties, local-content and export rules, directly affecting Vale’s iron ore and nickel projects; iron ore and nickel account for roughly 70% of Vale’s revenue mix, raising sensitivity. Policy shifts in Brazil and provincial moves in Canada or Indonesia can change project economics, while elections and coalition changes may reset concessions and tax incentives; proactive government relations and scenario planning are essential.
Brazilian policy stability
Vale’s core operations remain concentrated in Brazil, with over 70% of its iron ore production and critical logistics networks headquartered there, making federal fiscal, infrastructure and permitting policy material to company performance. Federal-state alignment shapes timing of rail and port concessions and environmental licenses, where delays have historically pushed project capex timelines beyond original budgets. Political volatility and shifting regulatory priorities can slow approvals and increase execution risk, while Vale’s geographic diversification outside Brazil partly tempers this concentration risk.
China industrial policy
China’s industrial policy—with crude steel output around 1.04 billion tonnes in 2024 and NEV sales roughly 13.5 million—sustains strong seaborne iron ore and nickel demand, underpinning Vale volumes and pricing. Capacity controls, stimulus rounds and decarbonization mandates are lifting high-grade and pellet premiums, shifting demand toward low-impurity ores. Diplomatic tensions affect customs scrutiny and freight/pricing spreads, so close monitoring of NDRC guidance and monthly import notices is critical to forecast flows.
Trade and tariffs
Shifts in tariffs, CBAM transitional reporting (2023–2025) with full application from 2026, and quotas can re-route Vale shipments and raise delivered costs; sanctions or export controls on critical mining equipment (eg. dual‑use tech) constrain sourcing and cap replacement options. Cross‑border rail and port access hinge on bilateral agreements, making logistics corridors vulnerable; hedging route risk preserves margins.
- CBAM timeline: transitional 2023–2025, full from 2026
- Sanctions/export controls risk equipment supply
- Rail/port access=bilateral agreements
- Route hedging maintains margins
Community and indigenous politics
Local political leaders and indigenous councils materially affect Vale's social license to operate, especially in places where Vale operates in 30+ countries; municipal elections (eg Oct 2024 in Brazil) can reset benefit and jobs expectations and trigger renegotiations. Contested consultations and legal challenges delay projects, raising carrying costs, while structured agreements and grievance mechanisms reduce disruption and litigation risk.
Resource nationalism, tax changes threaten margins of major iron ore and nickel producer
Resource nationalism and tax/royalty shifts threaten Vale’s iron ore/nickel margins (iron ore + nickel ≈70% revenue). Brazil concentration (>70% iron ore prod) makes federal/state policy and elections material. China demand (crude steel ~1.04bn t in 2024) supports seaborne prices; CBAM full from 2026 alters EU demand routing.
| Metric | Value |
|---|---|
| Brazil share | >70% |
| China steel 2024 | 1.04bn t |
| CBAM | Full 2026 |
What is included in the product
Detailed Word Document
Explores how Political, Economic, Social, Technological, Environmental and Legal forces uniquely shape Vale’s risk and opportunity profile, with data-backed trends and industry-specific examples; designed for executives and investors to inform strategy, scenario planning and external-report‑ready outputs.
Customizable Excel Spreadsheet
Visually segmented by PESTLE categories for quick interpretation, this concise Vale analysis can be dropped into presentations or strategy packs and is easily shared to align teams and support external risk discussions.
Economic factors
Cyclic commodity prices
Cyclic iron ore and nickel price swings drive Vale’s cash flow and capex timing, with iron ore 62% CFR around USD 110/ton and LME nickel near USD 22,000/ton in mid‑2025 influencing project pacing. High operating leverage amplifies profits in upcycles and losses in downcycles, shifting free cash flow volatility. Price floors depend on global cost curves and Chinese steel demand, while disciplined capital allocation and hedging have reduced EBITDA volatility.
Global growth and steel demand
Infrastructure and construction cycles drive iron ore volumes as global crude steel output was about 1,878 Mt in 2023, with China ~980 Mt, linking Vale volumes to cyclical capex. Recessions compress spreads and premiums for high-grade products, squeezing margins. Emerging market urbanization sustains baseline demand over decades. Monitoring PMIs and stimulus programs guides short‑term sales and pricing plans.
Currency and inflation
BRL volatility (roughly 10% swings 2023–24), CAD moves (around 5–8%) and USD strength (~6% in 2024) materially shift Vale’s costs and revenues; local inflation in Brazil (~4–5% in 2024) and wage growth (~5–7% in mining) pressure unit costs. Diesel, explosives and freight (freight down ~20% from 2022 peaks by 2024) feed through rapidly to COGS. Indexation clauses and productivity programs (saving on the order of US$1–2/ton) help protect margins.
Energy and freight costs
Power tariffs and fuel prices directly shape Vale’s mining and processing margins; higher Brazilian industrial tariffs and diesel at ~$1.10–$1.40/liter in 2024 pushed unit costs up. Dry bulk freight volatility (BDI ~1,100 in 2024) alters delivered prices and arbitrage windows for iron ore. Long‑haul rails and port assets need steady capex (Vale logistics capex ~ $3.5bn in 2024) to ensure reliability; energy contracting and efficiency projects have cut exposure to spot swings.
- Power tariffs impact unit cost
- Diesel prices drive fuel cost
- BDI ~1,100 (2024) affects delivered price
- Logistics capex ~ $3.5bn (2024)
- Energy contracting reduces volatility
EV and battery metals demand
Rising EV adoption (about 14 million new EVs in 2023 per IEA) drives nickel demand, but chemistry shifts matter: high-nickel NMC uptake supports demand while mass-market LFP adoption limits nickel intensity per vehicle. Policy incentives and OEM strategies (China and EU subsidies, global OEM EV targets) set the demand growth slope. Price-sensitive substitution to LFP or recycled nickel can cap upside; Vale uses strategic offtakes and prepayments to stabilize cash flows.
- nickel demand linked to EV chemistry mix
- policy/OEM stance shapes growth slope
- LFP substitution caps upside
- offtakes/prepayments stabilize Vale cashflows
Resource nationalism, tax changes threaten margins of major iron ore and nickel producer
Cyclic iron ore and nickel prices (Fe62 ~USD110/t, LME Ni ~USD22,000/t mid‑2025) drive Vale cash flow and capex timing; high operating leverage amplifies swings. BRL ~10% volatility (2023‑24), diesel $1.10–1.40/L and BDI ~1,100 (2024) shift unit costs; logistics capex ~$3.5bn (2024) secures supply. EVs ~14M new (2023) support nickel demand but LFP substitution limits upside.
| Metric | Value |
|---|---|
| Fe62 CFR | ~USD110/t |
| LME Nickel | ~USD22,000/t |
| Global steel (2023) | 1,878 Mt |
| Logistics capex (2024) | ~$3.5bn |
Same Document Delivered
Vale PESTLE Analysis
The preview shown here is the exact Vale PESTLE Analysis document you’ll receive after purchase—fully formatted, professionally structured, and ready to use. No placeholders or teasers: the content, layout, and insights visible here are the final deliverable. After checkout you’ll be able to download this same file instantly.











