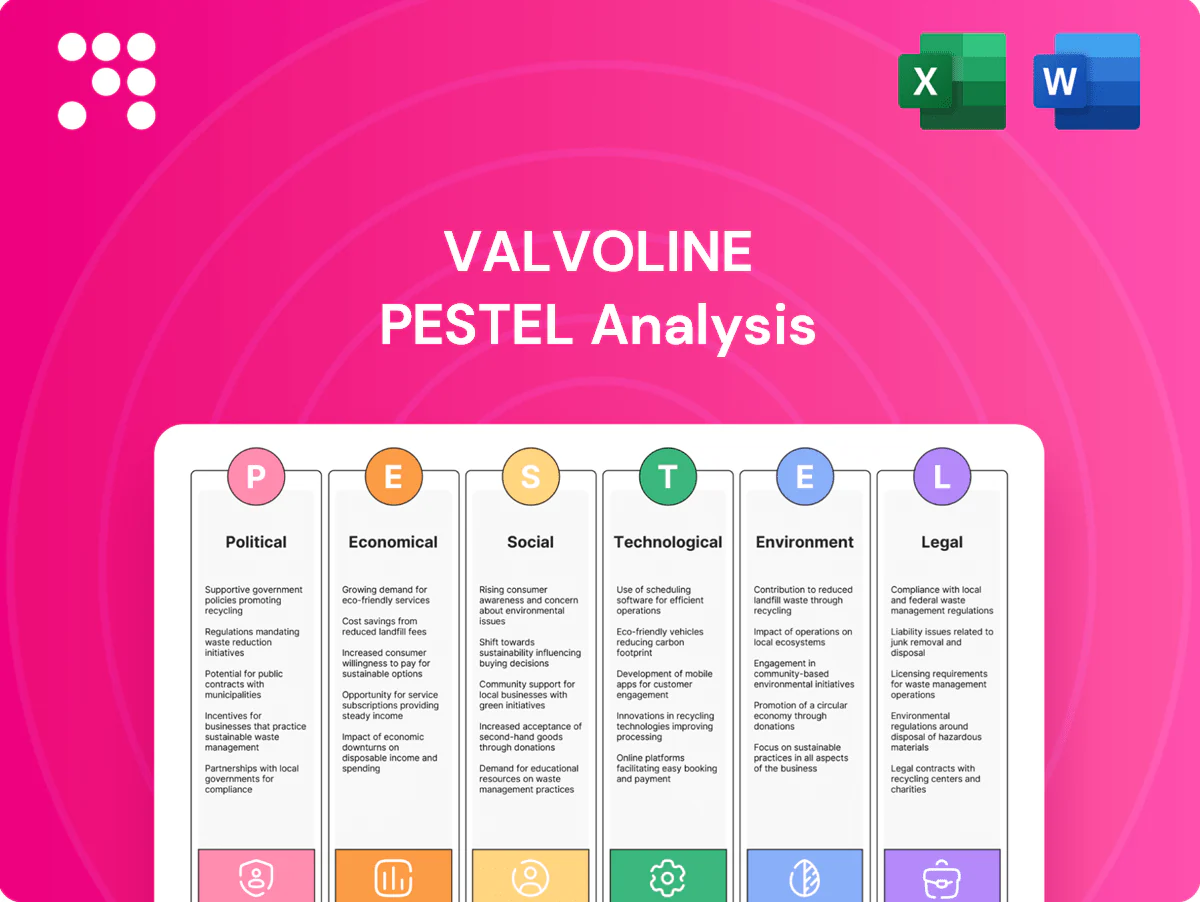
Valvoline PESTLE Analysis

Skip the Research. Get the Strategy.
Unlock strategic clarity with our Valvoline PESTLE Analysis—3–5 clear sentences revealing how political, economic, social, technological, legal, and environmental forces shape its outlook. Ideal for investors and strategists, this ready-to-use report highlights risks and growth levers. Buy the full analysis to download the complete, editable insights and make informed decisions faster.
Political factors

State-level transportation and EV incentives
State EV incentives, combined with a US EV new-vehicle share of about 7.6% in 2023 (IEA), can reduce routine oil-change demand while boosting revenue from tires, batteries, wipers and state inspection work. Wide variation in rebates, HOV access and charging grants across states complicates network planning and service mix. Tracking incentive-driven fleet shifts lets Valvoline optimize bay utilization. Advocacy can secure independent centers' roles in EV maintenance programs.
Local zoning, permitting, and expansion approvals
Opening new service centers for Valvoline, which operated over 1,000 U.S. locations as of 2024, hinges on municipal zoning, signage allowances, and permitting timelines; multi-month delays raise buildout costs and push back revenue realization. Proactive community engagement and standardized site packages have been shown to shorten approvals, and Valvoline now weights permit predictability alongside demand when prioritizing market entries.

Minimum wage and labor policy dynamics
Federal minimum wage remains $7.25 while more than 30 states maintain higher floors, directly lifting technician and manager labor costs and squeezing margins. Scheduling and dynamic pricing adjustments are required to offset typical labor-cost uplifts of 5–15% in states moving toward $15. Upskilling and productivity tools can boost tickets per hour by 10–20%, mitigating pressure, while tracking tipped/shift rules and benefits mandates prevents costly compliance penalties.

Healthcare and employment benefits policy
Mandates on employer-sponsored healthcare can raise per-employee costs—KFF reports 2024 average annual premiums of $8,070 (single) and $22,463 (family), increasing Valvoline’s benefits expense if employer share rises. Multi-state operations face divergent rules, adding HR compliance complexity and administrative cost. In a tight labor market (US unemployment ~3.7% in 2024), benefit design directly affects technician retention and may force repricing or staffing rebalances.
- Increased per-employee cost: KFF 2024 premiums
- Compliance burden: multi-state rule patchwork
- Retention risk: tight labor market (2024 unemployment ~3.7%)
- Operational impact: potential repricing or staffing model changes
Trade and supply chain sensitivities
Tariffs and trade restrictions, including Section 301 duties up to 25% on many China-origin auto parts, can raise Valvoline's COGS and compress margins; late-2024 industry reports showed auto-parts lead times easing to roughly 60 days but still above pre-pandemic levels, so domestic sourcing reduces tariff exposure but can raise purchase prices and limit selection. Political tensions can lengthen lead times and cut bay throughput; vendor diversification and safety stocks are common hedges.
- Tariffs: up to 25% (Section 301)
- Lead times: ~60 days (late 2024)
- Mitigants: domestic sourcing, vendor diversification, safety stock
EVs 7.6% cut oil changes; state variance, labor, tariffs strain networks
State EV incentives (US EV new‑vehicle share ~7.6% in 2023) reduce routine oil‑change demand while boosting tires/batteries/inspection work; wide state variance complicates network planning. Valvoline (1,000+ US sites in 2024) faces zoning/permit delays, higher labor/benefit costs amid 2024 unemployment ~3.7% and KFF 2024 premiums $8,070/$22,463; tariffs (up to 25%) and ~60‑day parts lead times pressure COGS.
| Metric | Value |
|---|---|
| US EV share (2023) | 7.6% |
| Valvoline US sites (2024) | 1,000+ |
| Unemployment (2024) | ~3.7% |
| Health premiums (2024) | $8,070 single / $22,463 family |
| Tariffs | Up to 25% |
| Parts lead time (late 2024) | ~60 days |
What is included in the product
 Detailed Word Document
Explores how macro-environmental factors uniquely impact Valvoline across Political, Economic, Social, Technological, Environmental and Legal dimensions, with data-backed trends and forward-looking insights to inform strategy and risk management for executives and investors.

 Customizable Excel Spreadsheet
Provides a concise, visually organized Valvoline PESTLE summary that can be dropped into PowerPoints or shared across teams to quickly align on external risks, market positioning, and strategic priorities during planning sessions.
Economic factors

Miles driven and vehicle parc age
Miles driven correlate closely with preventive maintenance frequency and ticket volume; U.S. vehicle miles traveled was about 3.2 trillion in 2023. An aging vehicle parc—average vehicle age ~12.5 years in 2023—increases demand for fluids, filters and light repairs. Recessionary periods (2008, 2020 patterns) often defer non‑urgent services but lengthen ownership, while local traffic patterns drive site performance forecasts.
Inflation, interest rates, and consumer spend
Higher inflation (US CPI roughly 3–4% in 2024–25) and policy rates near 5.25–5.50% pressure discretionary spend and reduce upsell conversion for Valvoline. Cost pass-through requires careful price-elasticity management to protect same-store sales. Promotional cadence and membership programs can stabilize visit frequency and average ticket. Macroeconomic easing typically lifts throughput and service mix.

Labor market tightness for technicians
Competition for skilled lube techs drives wage pressure and turnover risk, with BLS projecting 4% employment growth for automotive service technicians 2022–32 and a May 2023 median annual wage of $47,040. Apprenticeships and clear career ladders boost retention and productivity. Automation and standardized workflows increase bays-per-tech ratios. Regional unemployment swings require localized staffing and pay strategies.

Real estate and buildout economics
Rising construction costs and rents shape greenfield versus infill ROI: typical U.S. retail buildout runs roughly $120–220 per sq ft, while suburban pad land often ranges from $300k–$2M depending on market; conversions and drive-thru formats can lower upfront capex by about 20–35% versus full new builds. Higher interest-rate regimes in 2024–2025 constrained development pace and franchisee expansion appetite. Unit economics for Valvoline depend critically on ramp speed (often 12–18 months to mature volumes) and catchment density.
- Construction cost per sq ft: $120–220
- Land price (suburban pad): $300k–$2M
- Capex reduction via conversion/drive-thru: ~20–35%
- Typical ramp to mature unit: 12–18 months
Competitive dynamics and pricing power
Dealerships, independents and big-box auto centers set episodic price ceilings that cap Valvoline’s quick-lube margins, while Valvoline’s brand, speed and convenience support modest premium pricing and higher AUVs—company reports cite over 1,600 Valvoline Instant Oil Change locations and systemwide same-store sales growth in mid-single digits in recent quarters (2023–2024).
Loyalty programs and bundled service packages (millions of enrolled members) increase repeat visits and lower churn, and market-share gains concentrate in trade areas where Valvoline’s time-to-service is shortest, driving higher throughput and EBITDA per bay.
EVs 7.6% cut oil changes; state variance, labor, tariffs strain networks
Miles driven ~3.2T (2023) and average vehicle age ~12.5 yrs sustain fluids/repair demand; CPI ~3–4% (2024–25) and policy rates 5.25–5.50% pressure discretionary spend. Labor costs (median auto tech wage $47,040, 2023) and buildout ($120–$220/sq ft; land $300k–$2M) affect margins and rollout; 1,600+ locations, typical ramp 12–18 months.
| Metric | Value |
|---|---|
| VMT (2023) | ~3.2T |
| Avg vehicle age (2023) | ~12.5 yrs |
| CPI (2024–25) | 3–4% |
| Policy rates (2024–25) | 5.25–5.50% |
| Buildout | $120–$220/sq ft |
| Land (suburban) | $300k–$2M |
Same Document Delivered
Valvoline PESTLE Analysis
This Valvoline PESTLE Analysis preview is the exact document you’ll receive after purchase—fully formatted and professionally structured. The content, layout and analysis shown here are delivered unchanged at checkout. No placeholders or teasers; this is the final, ready-to-use file.

Skip the Research. Get the Strategy.
Unlock strategic clarity with our Valvoline PESTLE Analysis—3–5 clear sentences revealing how political, economic, social, technological, legal, and environmental forces shape its outlook. Ideal for investors and strategists, this ready-to-use report highlights risks and growth levers. Buy the full analysis to download the complete, editable insights and make informed decisions faster.
Political factors
State-level transportation and EV incentives
State EV incentives, combined with a US EV new-vehicle share of about 7.6% in 2023 (IEA), can reduce routine oil-change demand while boosting revenue from tires, batteries, wipers and state inspection work. Wide variation in rebates, HOV access and charging grants across states complicates network planning and service mix. Tracking incentive-driven fleet shifts lets Valvoline optimize bay utilization. Advocacy can secure independent centers' roles in EV maintenance programs.
Local zoning, permitting, and expansion approvals
Opening new service centers for Valvoline, which operated over 1,000 U.S. locations as of 2024, hinges on municipal zoning, signage allowances, and permitting timelines; multi-month delays raise buildout costs and push back revenue realization. Proactive community engagement and standardized site packages have been shown to shorten approvals, and Valvoline now weights permit predictability alongside demand when prioritizing market entries.
Minimum wage and labor policy dynamics
Federal minimum wage remains $7.25 while more than 30 states maintain higher floors, directly lifting technician and manager labor costs and squeezing margins. Scheduling and dynamic pricing adjustments are required to offset typical labor-cost uplifts of 5–15% in states moving toward $15. Upskilling and productivity tools can boost tickets per hour by 10–20%, mitigating pressure, while tracking tipped/shift rules and benefits mandates prevents costly compliance penalties.
Healthcare and employment benefits policy
Mandates on employer-sponsored healthcare can raise per-employee costs—KFF reports 2024 average annual premiums of $8,070 (single) and $22,463 (family), increasing Valvoline’s benefits expense if employer share rises. Multi-state operations face divergent rules, adding HR compliance complexity and administrative cost. In a tight labor market (US unemployment ~3.7% in 2024), benefit design directly affects technician retention and may force repricing or staffing rebalances.
- Increased per-employee cost: KFF 2024 premiums
- Compliance burden: multi-state rule patchwork
- Retention risk: tight labor market (2024 unemployment ~3.7%)
- Operational impact: potential repricing or staffing model changes
Trade and supply chain sensitivities
Tariffs and trade restrictions, including Section 301 duties up to 25% on many China-origin auto parts, can raise Valvoline's COGS and compress margins; late-2024 industry reports showed auto-parts lead times easing to roughly 60 days but still above pre-pandemic levels, so domestic sourcing reduces tariff exposure but can raise purchase prices and limit selection. Political tensions can lengthen lead times and cut bay throughput; vendor diversification and safety stocks are common hedges.
- Tariffs: up to 25% (Section 301)
- Lead times: ~60 days (late 2024)
- Mitigants: domestic sourcing, vendor diversification, safety stock
EVs 7.6% cut oil changes; state variance, labor, tariffs strain networks
State EV incentives (US EV new‑vehicle share ~7.6% in 2023) reduce routine oil‑change demand while boosting tires/batteries/inspection work; wide state variance complicates network planning. Valvoline (1,000+ US sites in 2024) faces zoning/permit delays, higher labor/benefit costs amid 2024 unemployment ~3.7% and KFF 2024 premiums $8,070/$22,463; tariffs (up to 25%) and ~60‑day parts lead times pressure COGS.
| Metric | Value |
|---|---|
| US EV share (2023) | 7.6% |
| Valvoline US sites (2024) | 1,000+ |
| Unemployment (2024) | ~3.7% |
| Health premiums (2024) | $8,070 single / $22,463 family |
| Tariffs | Up to 25% |
| Parts lead time (late 2024) | ~60 days |
What is included in the product
Detailed Word Document
Explores how macro-environmental factors uniquely impact Valvoline across Political, Economic, Social, Technological, Environmental and Legal dimensions, with data-backed trends and forward-looking insights to inform strategy and risk management for executives and investors.
Customizable Excel Spreadsheet
Provides a concise, visually organized Valvoline PESTLE summary that can be dropped into PowerPoints or shared across teams to quickly align on external risks, market positioning, and strategic priorities during planning sessions.
Economic factors
Miles driven and vehicle parc age
Miles driven correlate closely with preventive maintenance frequency and ticket volume; U.S. vehicle miles traveled was about 3.2 trillion in 2023. An aging vehicle parc—average vehicle age ~12.5 years in 2023—increases demand for fluids, filters and light repairs. Recessionary periods (2008, 2020 patterns) often defer non‑urgent services but lengthen ownership, while local traffic patterns drive site performance forecasts.
Inflation, interest rates, and consumer spend
Higher inflation (US CPI roughly 3–4% in 2024–25) and policy rates near 5.25–5.50% pressure discretionary spend and reduce upsell conversion for Valvoline. Cost pass-through requires careful price-elasticity management to protect same-store sales. Promotional cadence and membership programs can stabilize visit frequency and average ticket. Macroeconomic easing typically lifts throughput and service mix.
Labor market tightness for technicians
Competition for skilled lube techs drives wage pressure and turnover risk, with BLS projecting 4% employment growth for automotive service technicians 2022–32 and a May 2023 median annual wage of $47,040. Apprenticeships and clear career ladders boost retention and productivity. Automation and standardized workflows increase bays-per-tech ratios. Regional unemployment swings require localized staffing and pay strategies.
Real estate and buildout economics
Rising construction costs and rents shape greenfield versus infill ROI: typical U.S. retail buildout runs roughly $120–220 per sq ft, while suburban pad land often ranges from $300k–$2M depending on market; conversions and drive-thru formats can lower upfront capex by about 20–35% versus full new builds. Higher interest-rate regimes in 2024–2025 constrained development pace and franchisee expansion appetite. Unit economics for Valvoline depend critically on ramp speed (often 12–18 months to mature volumes) and catchment density.
- Construction cost per sq ft: $120–220
- Land price (suburban pad): $300k–$2M
- Capex reduction via conversion/drive-thru: ~20–35%
- Typical ramp to mature unit: 12–18 months
Competitive dynamics and pricing power
Dealerships, independents and big-box auto centers set episodic price ceilings that cap Valvoline’s quick-lube margins, while Valvoline’s brand, speed and convenience support modest premium pricing and higher AUVs—company reports cite over 1,600 Valvoline Instant Oil Change locations and systemwide same-store sales growth in mid-single digits in recent quarters (2023–2024).
Loyalty programs and bundled service packages (millions of enrolled members) increase repeat visits and lower churn, and market-share gains concentrate in trade areas where Valvoline’s time-to-service is shortest, driving higher throughput and EBITDA per bay.
EVs 7.6% cut oil changes; state variance, labor, tariffs strain networks
Miles driven ~3.2T (2023) and average vehicle age ~12.5 yrs sustain fluids/repair demand; CPI ~3–4% (2024–25) and policy rates 5.25–5.50% pressure discretionary spend. Labor costs (median auto tech wage $47,040, 2023) and buildout ($120–$220/sq ft; land $300k–$2M) affect margins and rollout; 1,600+ locations, typical ramp 12–18 months.
| Metric | Value |
|---|---|
| VMT (2023) | ~3.2T |
| Avg vehicle age (2023) | ~12.5 yrs |
| CPI (2024–25) | 3–4% |
| Policy rates (2024–25) | 5.25–5.50% |
| Buildout | $120–$220/sq ft |
| Land (suburban) | $300k–$2M |
Same Document Delivered
Valvoline PESTLE Analysis
This Valvoline PESTLE Analysis preview is the exact document you’ll receive after purchase—fully formatted and professionally structured. The content, layout and analysis shown here are delivered unchanged at checkout. No placeholders or teasers; this is the final, ready-to-use file.
Original: $10.00
-65%$10.00
$3.50Description
Skip the Research. Get the Strategy.
Unlock strategic clarity with our Valvoline PESTLE Analysis—3–5 clear sentences revealing how political, economic, social, technological, legal, and environmental forces shape its outlook. Ideal for investors and strategists, this ready-to-use report highlights risks and growth levers. Buy the full analysis to download the complete, editable insights and make informed decisions faster.
Political factors
State-level transportation and EV incentives
State EV incentives, combined with a US EV new-vehicle share of about 7.6% in 2023 (IEA), can reduce routine oil-change demand while boosting revenue from tires, batteries, wipers and state inspection work. Wide variation in rebates, HOV access and charging grants across states complicates network planning and service mix. Tracking incentive-driven fleet shifts lets Valvoline optimize bay utilization. Advocacy can secure independent centers' roles in EV maintenance programs.
Local zoning, permitting, and expansion approvals
Opening new service centers for Valvoline, which operated over 1,000 U.S. locations as of 2024, hinges on municipal zoning, signage allowances, and permitting timelines; multi-month delays raise buildout costs and push back revenue realization. Proactive community engagement and standardized site packages have been shown to shorten approvals, and Valvoline now weights permit predictability alongside demand when prioritizing market entries.
Minimum wage and labor policy dynamics
Federal minimum wage remains $7.25 while more than 30 states maintain higher floors, directly lifting technician and manager labor costs and squeezing margins. Scheduling and dynamic pricing adjustments are required to offset typical labor-cost uplifts of 5–15% in states moving toward $15. Upskilling and productivity tools can boost tickets per hour by 10–20%, mitigating pressure, while tracking tipped/shift rules and benefits mandates prevents costly compliance penalties.
Healthcare and employment benefits policy
Mandates on employer-sponsored healthcare can raise per-employee costs—KFF reports 2024 average annual premiums of $8,070 (single) and $22,463 (family), increasing Valvoline’s benefits expense if employer share rises. Multi-state operations face divergent rules, adding HR compliance complexity and administrative cost. In a tight labor market (US unemployment ~3.7% in 2024), benefit design directly affects technician retention and may force repricing or staffing rebalances.
- Increased per-employee cost: KFF 2024 premiums
- Compliance burden: multi-state rule patchwork
- Retention risk: tight labor market (2024 unemployment ~3.7%)
- Operational impact: potential repricing or staffing model changes
Trade and supply chain sensitivities
Tariffs and trade restrictions, including Section 301 duties up to 25% on many China-origin auto parts, can raise Valvoline's COGS and compress margins; late-2024 industry reports showed auto-parts lead times easing to roughly 60 days but still above pre-pandemic levels, so domestic sourcing reduces tariff exposure but can raise purchase prices and limit selection. Political tensions can lengthen lead times and cut bay throughput; vendor diversification and safety stocks are common hedges.
- Tariffs: up to 25% (Section 301)
- Lead times: ~60 days (late 2024)
- Mitigants: domestic sourcing, vendor diversification, safety stock
EVs 7.6% cut oil changes; state variance, labor, tariffs strain networks
State EV incentives (US EV new‑vehicle share ~7.6% in 2023) reduce routine oil‑change demand while boosting tires/batteries/inspection work; wide state variance complicates network planning. Valvoline (1,000+ US sites in 2024) faces zoning/permit delays, higher labor/benefit costs amid 2024 unemployment ~3.7% and KFF 2024 premiums $8,070/$22,463; tariffs (up to 25%) and ~60‑day parts lead times pressure COGS.
| Metric | Value |
|---|---|
| US EV share (2023) | 7.6% |
| Valvoline US sites (2024) | 1,000+ |
| Unemployment (2024) | ~3.7% |
| Health premiums (2024) | $8,070 single / $22,463 family |
| Tariffs | Up to 25% |
| Parts lead time (late 2024) | ~60 days |
What is included in the product
Detailed Word Document
Explores how macro-environmental factors uniquely impact Valvoline across Political, Economic, Social, Technological, Environmental and Legal dimensions, with data-backed trends and forward-looking insights to inform strategy and risk management for executives and investors.
Customizable Excel Spreadsheet
Provides a concise, visually organized Valvoline PESTLE summary that can be dropped into PowerPoints or shared across teams to quickly align on external risks, market positioning, and strategic priorities during planning sessions.
Economic factors
Miles driven and vehicle parc age
Miles driven correlate closely with preventive maintenance frequency and ticket volume; U.S. vehicle miles traveled was about 3.2 trillion in 2023. An aging vehicle parc—average vehicle age ~12.5 years in 2023—increases demand for fluids, filters and light repairs. Recessionary periods (2008, 2020 patterns) often defer non‑urgent services but lengthen ownership, while local traffic patterns drive site performance forecasts.
Inflation, interest rates, and consumer spend
Higher inflation (US CPI roughly 3–4% in 2024–25) and policy rates near 5.25–5.50% pressure discretionary spend and reduce upsell conversion for Valvoline. Cost pass-through requires careful price-elasticity management to protect same-store sales. Promotional cadence and membership programs can stabilize visit frequency and average ticket. Macroeconomic easing typically lifts throughput and service mix.
Labor market tightness for technicians
Competition for skilled lube techs drives wage pressure and turnover risk, with BLS projecting 4% employment growth for automotive service technicians 2022–32 and a May 2023 median annual wage of $47,040. Apprenticeships and clear career ladders boost retention and productivity. Automation and standardized workflows increase bays-per-tech ratios. Regional unemployment swings require localized staffing and pay strategies.
Real estate and buildout economics
Rising construction costs and rents shape greenfield versus infill ROI: typical U.S. retail buildout runs roughly $120–220 per sq ft, while suburban pad land often ranges from $300k–$2M depending on market; conversions and drive-thru formats can lower upfront capex by about 20–35% versus full new builds. Higher interest-rate regimes in 2024–2025 constrained development pace and franchisee expansion appetite. Unit economics for Valvoline depend critically on ramp speed (often 12–18 months to mature volumes) and catchment density.
- Construction cost per sq ft: $120–220
- Land price (suburban pad): $300k–$2M
- Capex reduction via conversion/drive-thru: ~20–35%
- Typical ramp to mature unit: 12–18 months
Competitive dynamics and pricing power
Dealerships, independents and big-box auto centers set episodic price ceilings that cap Valvoline’s quick-lube margins, while Valvoline’s brand, speed and convenience support modest premium pricing and higher AUVs—company reports cite over 1,600 Valvoline Instant Oil Change locations and systemwide same-store sales growth in mid-single digits in recent quarters (2023–2024).
Loyalty programs and bundled service packages (millions of enrolled members) increase repeat visits and lower churn, and market-share gains concentrate in trade areas where Valvoline’s time-to-service is shortest, driving higher throughput and EBITDA per bay.
EVs 7.6% cut oil changes; state variance, labor, tariffs strain networks
Miles driven ~3.2T (2023) and average vehicle age ~12.5 yrs sustain fluids/repair demand; CPI ~3–4% (2024–25) and policy rates 5.25–5.50% pressure discretionary spend. Labor costs (median auto tech wage $47,040, 2023) and buildout ($120–$220/sq ft; land $300k–$2M) affect margins and rollout; 1,600+ locations, typical ramp 12–18 months.
| Metric | Value |
|---|---|
| VMT (2023) | ~3.2T |
| Avg vehicle age (2023) | ~12.5 yrs |
| CPI (2024–25) | 3–4% |
| Policy rates (2024–25) | 5.25–5.50% |
| Buildout | $120–$220/sq ft |
| Land (suburban) | $300k–$2M |
Same Document Delivered
Valvoline PESTLE Analysis
This Valvoline PESTLE Analysis preview is the exact document you’ll receive after purchase—fully formatted and professionally structured. The content, layout and analysis shown here are delivered unchanged at checkout. No placeholders or teasers; this is the final, ready-to-use file.











