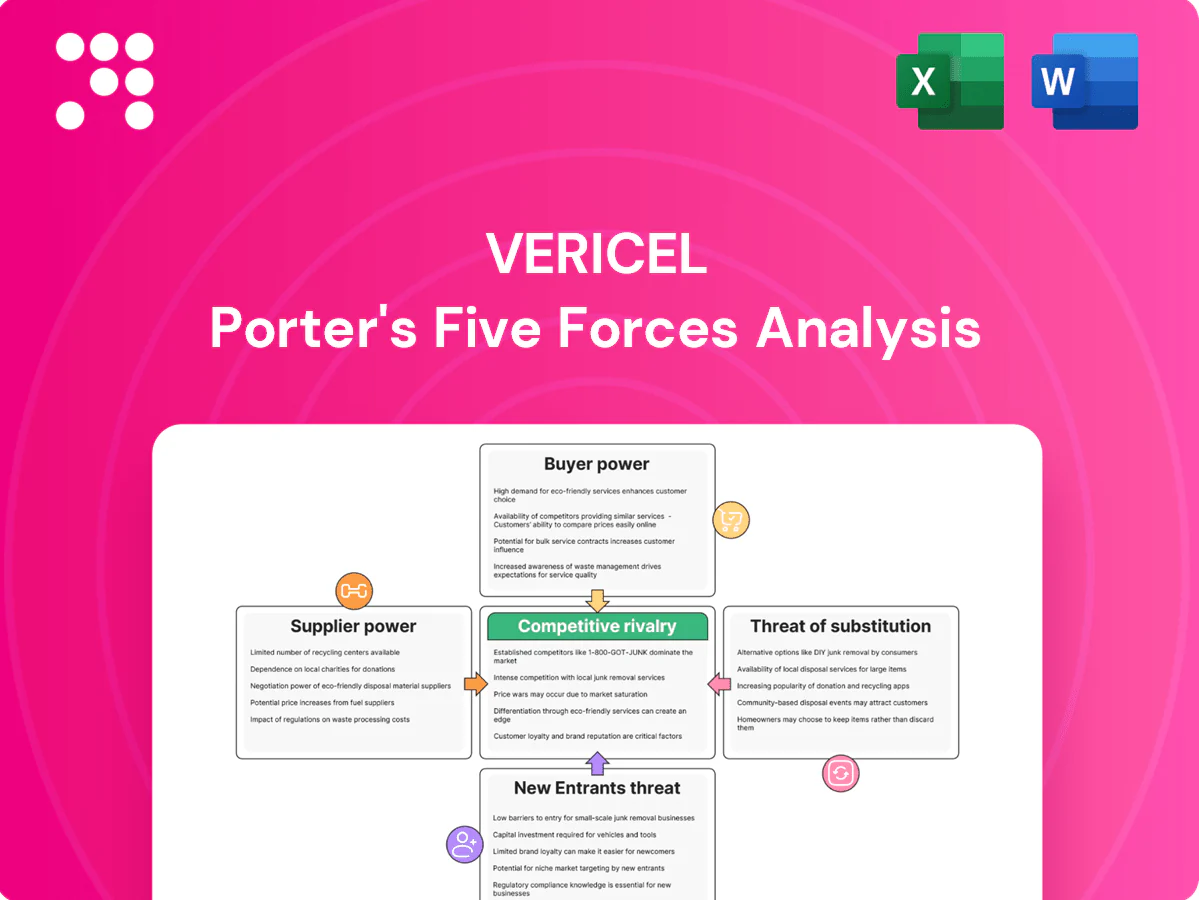
Vericel Porter's Five Forces Analysis

Don't Miss the Bigger Picture
Vericel’s Porter’s Five Forces snapshot highlights moderate supplier leverage, niche buyer dynamics, and high regulatory barriers shaping competitive intensity. Product differentiation and specialized manufacturing limit substitute threats but attract selective entrants. This preview scratches the surface—unlock the full Porter’s Five Forces Analysis to access force-by-force ratings, visuals, and strategic implications for informed decisions.
Suppliers Bargaining Power

Specialized GMP inputs
Autologous cell therapies need specialized GMP media, enzymes, membranes and single-use disposables certified for GMP; supply is concentrated with few qualified vendors, often under 10, raising switching costs. Any supplier change can trigger comparability studies and regulatory notifications that add months and material revalidation costs. This concentration increases supplier leverage over pricing and contract terms.
Cold-chain logistics
Frozen and time-sensitive biopsies and final-cell therapy products rely on niche couriers and validated shippers, and the global cold-chain logistics market was valued at about $326 billion in 2024, underscoring provider concentration. Weather, capacity shortages and quality excursions can halt lot releases, and limited substitutes for validated lanes increase dependence on few suppliers. Carriers exert leverage through capacity allocation and surcharges, raising operational risk and cost volatility.

Equipment and validation
Key capital equipment for Vericel—bioreactors, incubators and QC instruments—often cost US$100k–500k per unit and are validated to vendor specs; requalification after changes can take 3–9 months and cost >US$100k. Service contracts and spare parts (often 10–20% of purchase price annually) create vendor lock-in. Vendors capture aftermarket margins of 30–50%, giving them lifecycle negotiating power.

Quality and compliance gatekeeping
Biologic raw material variability
Biologic inputs carry inherent variability requiring tight specifications and batch-level controls; narrow acceptance ranges shrink the pool of qualified suppliers, increasing reliance on a few validated sources and raising supplier bargaining power as those vendors can command premium pricing for consistency and traceability.
- Validated suppliers: fewer, higher leverage
- Narrow specs: higher switching costs
- Consistency premiums: greater supplier pricing power
Supplier power high: 5–10 core vendors; cold-chain $326B; aftermarket 30–50%
Supplier power is high: core reagents and disposables come from <10 qualified vendors, often <5 for niche items, raising switching costs. Cold-chain reliance (global market ~326 billion USD in 2024) concentrates logistics providers. Capital equipment (US$100k–500k) plus 30–50% aftermarket margins and 3–9 month requalification windows increase vendor leverage.
| Metric | Value (2024) |
|---|---|
| Qualified vendors (core) | <5–10 |
| Cold-chain market | $326B |
| Equipment cost | $100k–500k |
| Aftermarket margin | 30–50% |
What is included in the product
 Detailed Word Document
Porter's Five Forces analysis for Vericel uncovers competitive intensity, supplier and buyer bargaining power, threat of substitutes and new entrants, and identifies disruptive forces shaping pricing, margins, and strategic defenses specific to Vericel's regenerative medicine niche.

 Customizable Excel Spreadsheet
Clear, one-sheet Porter's Five Forces for Vericel—instantly show competitive pressures and strategic levers to relieve decision-making pain points for investors and management.
Customers Bargaining Power

Concentrated centers of care
Orthopedic specialty centers and verified burn centers are relatively concentrated—about 122 verified burn centers in the U.S. in 2024—creating large-account dynamics. High case volumes (roughly 1.1M joint replacements annually) give these institutions leverage over pricing and access terms. Physician champions matter, but hospital value-analysis committees increasingly scrutinize costs and outcomes. This concentration elevates buyer bargaining power for suppliers like Vericel.
Payer reimbursement gate
Third-party payers set coverage, coding, and payment levels for MACI and Epicel, and 2024 reimbursement choices directly shape uptake; Vericel reported 2024 product revenue of $254.3 million, magnifying stakes in payer decisions. Prior authorizations and clinical criteria routinely restrict utilization, while payer pushback on high-cost cell therapies forces deeper discounts and rebates. These dynamics amplify buyer power and compress net pricing.

Clinical outcomes scrutiny
Buyers demand robust, real-world outcomes versus alternatives like grafts or microfracture, pushing payers and hospital systems to require registry and post-market data before granting favorable coverage. When evidence is equivocal in subgroups, procurement teams press for price concessions or restricted use. Publication cadence and registry entries materially shape willingness to pay. Strong outcomes reduce but do not remove buyer leverage.

Budget impact sensitivity
Hospitals and IDNs govern episode-based budgets and prioritize length-of-stay and OR-time savings; labor is roughly 50–60% of hospital costs, so efficiency directly affects margins. Post-pandemic capital limits and near-double-digit staffing vacancies intensify cost controls; even with proven clinical benefit, budget holders demand discounts or contracting concessions, strengthening buyer power.
- Episode focus: LOS/OR savings
- Labor share: 50–60%
- Staff vacancies: ≈10%
- Result: higher buyer leverage
Switching and protocol choices
Surgical teams can select different repair algorithms and burn protocols, giving them credible threats to switch when internal alternatives exist; pathway placement and formulary status therefore become key bargaining chips. Vericel must invest in training, real-world evidence and protocol support to reduce switching propensity and protect uptake.
- Switch risk tied to protocol flexibility
- Pathway/formulary status = negotiating leverage
- Training + evidence lower churn
Payers squeeze pricing: 122 burn centers, 1.1M joints
Concentrated buyers (≈122 verified burn centers) and high-volume orthopedic systems (≈1.1M joint replacements) exert strong pricing leverage. Vericel reported 2024 product revenue $254.3M, raising payer focus on coverage and discounts. Payer controls, prior auths and demand for real-world outcomes compress net pricing. Hospitals' labor share 50–60% and ≈10% staffing vacancies heighten cost-driven bargaining.
| Metric | 2024 |
|---|---|
| Verified burn centers | 122 |
| Joint replacements/yr | ≈1.1M |
| Vericel product rev | $254.3M |
| Hospital labor share | 50–60% |
| Staff vacancies | ≈10% |
Same Document Delivered
Vericel Porter's Five Forces Analysis
This preview shows the exact Vericel Porter's Five Forces Analysis you'll receive immediately after purchase—no placeholders. It contains the full, professionally formatted assessment of competitive forces, ready for download and practical use the moment you buy. No mockups or samples—what you see is the complete deliverable.

Don't Miss the Bigger Picture
Vericel’s Porter’s Five Forces snapshot highlights moderate supplier leverage, niche buyer dynamics, and high regulatory barriers shaping competitive intensity. Product differentiation and specialized manufacturing limit substitute threats but attract selective entrants. This preview scratches the surface—unlock the full Porter’s Five Forces Analysis to access force-by-force ratings, visuals, and strategic implications for informed decisions.
Suppliers Bargaining Power
Specialized GMP inputs
Autologous cell therapies need specialized GMP media, enzymes, membranes and single-use disposables certified for GMP; supply is concentrated with few qualified vendors, often under 10, raising switching costs. Any supplier change can trigger comparability studies and regulatory notifications that add months and material revalidation costs. This concentration increases supplier leverage over pricing and contract terms.
Cold-chain logistics
Frozen and time-sensitive biopsies and final-cell therapy products rely on niche couriers and validated shippers, and the global cold-chain logistics market was valued at about $326 billion in 2024, underscoring provider concentration. Weather, capacity shortages and quality excursions can halt lot releases, and limited substitutes for validated lanes increase dependence on few suppliers. Carriers exert leverage through capacity allocation and surcharges, raising operational risk and cost volatility.
Equipment and validation
Key capital equipment for Vericel—bioreactors, incubators and QC instruments—often cost US$100k–500k per unit and are validated to vendor specs; requalification after changes can take 3–9 months and cost >US$100k. Service contracts and spare parts (often 10–20% of purchase price annually) create vendor lock-in. Vendors capture aftermarket margins of 30–50%, giving them lifecycle negotiating power.
Quality and compliance gatekeeping
Biologic raw material variability
Biologic inputs carry inherent variability requiring tight specifications and batch-level controls; narrow acceptance ranges shrink the pool of qualified suppliers, increasing reliance on a few validated sources and raising supplier bargaining power as those vendors can command premium pricing for consistency and traceability.
- Validated suppliers: fewer, higher leverage
- Narrow specs: higher switching costs
- Consistency premiums: greater supplier pricing power
Supplier power high: 5–10 core vendors; cold-chain $326B; aftermarket 30–50%
Supplier power is high: core reagents and disposables come from <10 qualified vendors, often <5 for niche items, raising switching costs. Cold-chain reliance (global market ~326 billion USD in 2024) concentrates logistics providers. Capital equipment (US$100k–500k) plus 30–50% aftermarket margins and 3–9 month requalification windows increase vendor leverage.
| Metric | Value (2024) |
|---|---|
| Qualified vendors (core) | <5–10 |
| Cold-chain market | $326B |
| Equipment cost | $100k–500k |
| Aftermarket margin | 30–50% |
What is included in the product
Detailed Word Document
Porter's Five Forces analysis for Vericel uncovers competitive intensity, supplier and buyer bargaining power, threat of substitutes and new entrants, and identifies disruptive forces shaping pricing, margins, and strategic defenses specific to Vericel's regenerative medicine niche.
Customizable Excel Spreadsheet
Clear, one-sheet Porter's Five Forces for Vericel—instantly show competitive pressures and strategic levers to relieve decision-making pain points for investors and management.
Customers Bargaining Power
Concentrated centers of care
Orthopedic specialty centers and verified burn centers are relatively concentrated—about 122 verified burn centers in the U.S. in 2024—creating large-account dynamics. High case volumes (roughly 1.1M joint replacements annually) give these institutions leverage over pricing and access terms. Physician champions matter, but hospital value-analysis committees increasingly scrutinize costs and outcomes. This concentration elevates buyer bargaining power for suppliers like Vericel.
Payer reimbursement gate
Third-party payers set coverage, coding, and payment levels for MACI and Epicel, and 2024 reimbursement choices directly shape uptake; Vericel reported 2024 product revenue of $254.3 million, magnifying stakes in payer decisions. Prior authorizations and clinical criteria routinely restrict utilization, while payer pushback on high-cost cell therapies forces deeper discounts and rebates. These dynamics amplify buyer power and compress net pricing.
Clinical outcomes scrutiny
Buyers demand robust, real-world outcomes versus alternatives like grafts or microfracture, pushing payers and hospital systems to require registry and post-market data before granting favorable coverage. When evidence is equivocal in subgroups, procurement teams press for price concessions or restricted use. Publication cadence and registry entries materially shape willingness to pay. Strong outcomes reduce but do not remove buyer leverage.
Budget impact sensitivity
Hospitals and IDNs govern episode-based budgets and prioritize length-of-stay and OR-time savings; labor is roughly 50–60% of hospital costs, so efficiency directly affects margins. Post-pandemic capital limits and near-double-digit staffing vacancies intensify cost controls; even with proven clinical benefit, budget holders demand discounts or contracting concessions, strengthening buyer power.
- Episode focus: LOS/OR savings
- Labor share: 50–60%
- Staff vacancies: ≈10%
- Result: higher buyer leverage
Switching and protocol choices
Surgical teams can select different repair algorithms and burn protocols, giving them credible threats to switch when internal alternatives exist; pathway placement and formulary status therefore become key bargaining chips. Vericel must invest in training, real-world evidence and protocol support to reduce switching propensity and protect uptake.
- Switch risk tied to protocol flexibility
- Pathway/formulary status = negotiating leverage
- Training + evidence lower churn
Payers squeeze pricing: 122 burn centers, 1.1M joints
Concentrated buyers (≈122 verified burn centers) and high-volume orthopedic systems (≈1.1M joint replacements) exert strong pricing leverage. Vericel reported 2024 product revenue $254.3M, raising payer focus on coverage and discounts. Payer controls, prior auths and demand for real-world outcomes compress net pricing. Hospitals' labor share 50–60% and ≈10% staffing vacancies heighten cost-driven bargaining.
| Metric | 2024 |
|---|---|
| Verified burn centers | 122 |
| Joint replacements/yr | ≈1.1M |
| Vericel product rev | $254.3M |
| Hospital labor share | 50–60% |
| Staff vacancies | ≈10% |
Same Document Delivered
Vericel Porter's Five Forces Analysis
This preview shows the exact Vericel Porter's Five Forces Analysis you'll receive immediately after purchase—no placeholders. It contains the full, professionally formatted assessment of competitive forces, ready for download and practical use the moment you buy. No mockups or samples—what you see is the complete deliverable.
Original: $10.00
-65%$10.00
$3.50Description
Don't Miss the Bigger Picture
Vericel’s Porter’s Five Forces snapshot highlights moderate supplier leverage, niche buyer dynamics, and high regulatory barriers shaping competitive intensity. Product differentiation and specialized manufacturing limit substitute threats but attract selective entrants. This preview scratches the surface—unlock the full Porter’s Five Forces Analysis to access force-by-force ratings, visuals, and strategic implications for informed decisions.
Suppliers Bargaining Power
Specialized GMP inputs
Autologous cell therapies need specialized GMP media, enzymes, membranes and single-use disposables certified for GMP; supply is concentrated with few qualified vendors, often under 10, raising switching costs. Any supplier change can trigger comparability studies and regulatory notifications that add months and material revalidation costs. This concentration increases supplier leverage over pricing and contract terms.
Cold-chain logistics
Frozen and time-sensitive biopsies and final-cell therapy products rely on niche couriers and validated shippers, and the global cold-chain logistics market was valued at about $326 billion in 2024, underscoring provider concentration. Weather, capacity shortages and quality excursions can halt lot releases, and limited substitutes for validated lanes increase dependence on few suppliers. Carriers exert leverage through capacity allocation and surcharges, raising operational risk and cost volatility.
Equipment and validation
Key capital equipment for Vericel—bioreactors, incubators and QC instruments—often cost US$100k–500k per unit and are validated to vendor specs; requalification after changes can take 3–9 months and cost >US$100k. Service contracts and spare parts (often 10–20% of purchase price annually) create vendor lock-in. Vendors capture aftermarket margins of 30–50%, giving them lifecycle negotiating power.
Quality and compliance gatekeeping
Biologic raw material variability
Biologic inputs carry inherent variability requiring tight specifications and batch-level controls; narrow acceptance ranges shrink the pool of qualified suppliers, increasing reliance on a few validated sources and raising supplier bargaining power as those vendors can command premium pricing for consistency and traceability.
- Validated suppliers: fewer, higher leverage
- Narrow specs: higher switching costs
- Consistency premiums: greater supplier pricing power
Supplier power high: 5–10 core vendors; cold-chain $326B; aftermarket 30–50%
Supplier power is high: core reagents and disposables come from <10 qualified vendors, often <5 for niche items, raising switching costs. Cold-chain reliance (global market ~326 billion USD in 2024) concentrates logistics providers. Capital equipment (US$100k–500k) plus 30–50% aftermarket margins and 3–9 month requalification windows increase vendor leverage.
| Metric | Value (2024) |
|---|---|
| Qualified vendors (core) | <5–10 |
| Cold-chain market | $326B |
| Equipment cost | $100k–500k |
| Aftermarket margin | 30–50% |
What is included in the product
Detailed Word Document
Porter's Five Forces analysis for Vericel uncovers competitive intensity, supplier and buyer bargaining power, threat of substitutes and new entrants, and identifies disruptive forces shaping pricing, margins, and strategic defenses specific to Vericel's regenerative medicine niche.
Customizable Excel Spreadsheet
Clear, one-sheet Porter's Five Forces for Vericel—instantly show competitive pressures and strategic levers to relieve decision-making pain points for investors and management.
Customers Bargaining Power
Concentrated centers of care
Orthopedic specialty centers and verified burn centers are relatively concentrated—about 122 verified burn centers in the U.S. in 2024—creating large-account dynamics. High case volumes (roughly 1.1M joint replacements annually) give these institutions leverage over pricing and access terms. Physician champions matter, but hospital value-analysis committees increasingly scrutinize costs and outcomes. This concentration elevates buyer bargaining power for suppliers like Vericel.
Payer reimbursement gate
Third-party payers set coverage, coding, and payment levels for MACI and Epicel, and 2024 reimbursement choices directly shape uptake; Vericel reported 2024 product revenue of $254.3 million, magnifying stakes in payer decisions. Prior authorizations and clinical criteria routinely restrict utilization, while payer pushback on high-cost cell therapies forces deeper discounts and rebates. These dynamics amplify buyer power and compress net pricing.
Clinical outcomes scrutiny
Buyers demand robust, real-world outcomes versus alternatives like grafts or microfracture, pushing payers and hospital systems to require registry and post-market data before granting favorable coverage. When evidence is equivocal in subgroups, procurement teams press for price concessions or restricted use. Publication cadence and registry entries materially shape willingness to pay. Strong outcomes reduce but do not remove buyer leverage.
Budget impact sensitivity
Hospitals and IDNs govern episode-based budgets and prioritize length-of-stay and OR-time savings; labor is roughly 50–60% of hospital costs, so efficiency directly affects margins. Post-pandemic capital limits and near-double-digit staffing vacancies intensify cost controls; even with proven clinical benefit, budget holders demand discounts or contracting concessions, strengthening buyer power.
- Episode focus: LOS/OR savings
- Labor share: 50–60%
- Staff vacancies: ≈10%
- Result: higher buyer leverage
Switching and protocol choices
Surgical teams can select different repair algorithms and burn protocols, giving them credible threats to switch when internal alternatives exist; pathway placement and formulary status therefore become key bargaining chips. Vericel must invest in training, real-world evidence and protocol support to reduce switching propensity and protect uptake.
- Switch risk tied to protocol flexibility
- Pathway/formulary status = negotiating leverage
- Training + evidence lower churn
Payers squeeze pricing: 122 burn centers, 1.1M joints
Concentrated buyers (≈122 verified burn centers) and high-volume orthopedic systems (≈1.1M joint replacements) exert strong pricing leverage. Vericel reported 2024 product revenue $254.3M, raising payer focus on coverage and discounts. Payer controls, prior auths and demand for real-world outcomes compress net pricing. Hospitals' labor share 50–60% and ≈10% staffing vacancies heighten cost-driven bargaining.
| Metric | 2024 |
|---|---|
| Verified burn centers | 122 |
| Joint replacements/yr | ≈1.1M |
| Vericel product rev | $254.3M |
| Hospital labor share | 50–60% |
| Staff vacancies | ≈10% |
Same Document Delivered
Vericel Porter's Five Forces Analysis
This preview shows the exact Vericel Porter's Five Forces Analysis you'll receive immediately after purchase—no placeholders. It contains the full, professionally formatted assessment of competitive forces, ready for download and practical use the moment you buy. No mockups or samples—what you see is the complete deliverable.











