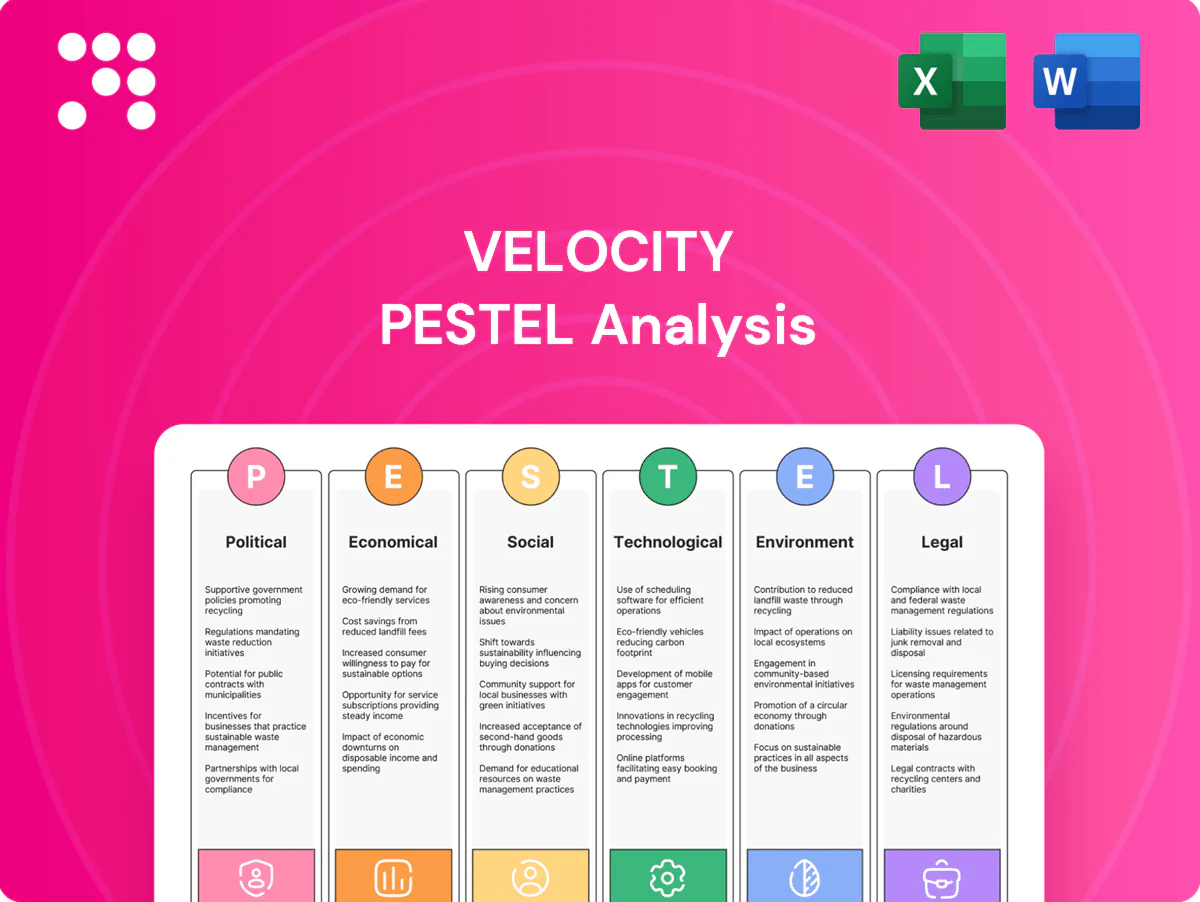
Velocity PESTLE Analysis

Skip the Research. Get the Strategy.
Unlock strategic clarity with our Velocity PESTLE Analysis—three to five expert-level insights on how political, economic, social, technological, legal, and environmental forces shape the company’s trajectory. Ideal for investors and strategists, this ready-to-use report saves research time and strengthens decisions. Purchase the full PESTLE for the complete, editable breakdown and actionable recommendations.
Political factors

Regulatory oversight shifts
Administration changes can recalibrate priorities for nonbank lenders and commercial real estate credit; nonbank mortgage originations reached roughly 60% of the market in 2023 (MBA), signaling systemic importance. Heightened scrutiny on underwriting or broker compensation could raise compliance costs and operational burdens. Conversely, pro-small-business agendas (expanded SBA guarantees) may increase lending incentives. Velocity must monitor rulemaking calendars and comment periods to anticipate impacts.
State-level lending regimes
Licensing, usury limits and broker rules vary across all 50 states plus DC, creating distinct regulatory regimes for lenders. Patchwork compliance forces multi-state SBC lenders to manage licensing and bonding across up to 51 jurisdictions with divergent fee and reporting requirements. Tightening rules in key markets can slow originations, so proactive policy engagement and scalable compliance infrastructure are critical.

Housing and small-business policy
Programs promoting small-business recovery and property revitalization can lift loan demand, especially given small firms employ about 47% of the US private workforce; targeted grants and tax incentives for commercial upgrades historically increase borrowing. Homeownership ~65% signals housing-policy effects on mortgage and HELOC flows. Subsidy rollbacks can damp activity; Velocity can align products with eligible projects to capture these flows.

Real estate tax and 1031 dynamics
Federal or state shifts to depreciation, 1031 exchanges, or property taxes materially change investor appetite; less favorable tax treatment compresses deal flow and refinancing, contributing to lower CRE transaction volume (US CRE deals fell to about 179 billion USD in 2023, RCA) and raising holding costs given local property tax revenues exceed 540 billion USD annually (Census, 2022).
- Tax shocks reduce transaction volumes and refinancing
- Stability supports steady origination pipelines
- Scenario planning prices political tax risk into valuations
Local rent control and zoning
Municipal rules on rents, short-term uses, and density materially influence asset cash flows; lenders typically target DSCR of 1.2–1.35, so stricter rent controls can compress DSCR and reduce collateral values, while flexible zoning often spurs redevelopment and increases loan demand; market selection should explicitly factor policy trajectories and enforcement intensity.
- DSCR norms: 1.2–1.35
- Rent caps reduce upside and valuation multiples
- Flexible zoning boosts redevelopment pipeline and lending
- Include local policy trend analysis in market selection
Policy shifts reshape nonbank lending; 60% mortgage share raises CRE and compliance risks
Administration shifts recalibrate nonbank lending priorities; nonbank mortgage originations were ~60% in 2023 (MBA), elevating systemic exposure. State-by-state licensing, usury and broker rules create compliance complexity across 51 jurisdictions. Tax changes, rent controls and zoning shifts materially affect DSCR, transaction volumes and CRE liquidity.
| Metric | Value |
|---|---|
| Nonbank mortgage share (2023) | ~60% |
| US CRE deal volume (2023) | $179B |
| Homeownership rate | ~65% |
| Small firm employment | ~47% |
What is included in the product
 Detailed Word Document
Explores how Political, Economic, Social, Technological, Environmental and Legal forces uniquely affect Velocity, with each section grounded in current data and industry-region specifics. Designed for executives and investors, it offers forward-looking insights, ready formatting for plans or pitches.

 Customizable Excel Spreadsheet
Velocity PESTLE delivers a compact, visually segmented summary of external factors for rapid meeting reference, editable with context-specific notes and exportable to PowerPoint or Excel for seamless cross-team alignment.
Economic factors

Interest rate volatility
Interest rate volatility—with the US fed funds at 5.25–5.50% and the 10-year Treasury oscillating near 3.7–4.5% in 2024–25—directly alters borrower affordability and prepayment behavior. Wider spreads can lift yields but typically curb originations and volume. Lower policy rates may spur refinancing activity while compressing net interest margins. Dynamic pricing and active hedging are essential to manage duration and credit risk.
CRE valuations and cap rates
Rising cap rates—up roughly 150–200 basis points since 2020—compress CRE collateral values and erode LTV headroom, while appraisal conservatism is tightening borrower proceeds; stable income and selective market pricing, however, have enabled continued securitization execution in 2024–25, and lenders’ conservative advance rates (often 60–70% for office/retail) provide a buffer against near‑term downside.

Securitization and liquidity
Securitization and liquidity are critical for SBC lenders, with warehouse lines commonly funding 60-80% of originations and capital markets takeouts key to balance-sheet capacity. During risk-off episodes spreads can widen by hundreds of basis points and issuance volumes slow, constraining originations. Robust investor demand, as seen in recoveries of ABS markets in 2024, lowers funding costs and enables growth. Maintaining multiple funding channels mitigates sudden liquidity shocks.

Small business health
Consumer spending, input costs and tight labor markets directly drive tenant and owner cash flow; small firms employ about half the private US workforce and contribute roughly 44% of economic activity (SBA), so weakness raises delinquencies and modifies loans while strength supports originations and portfolio performance; sector diversification lowers cyclicality.
- Consumer spending → cash flow
- Input costs & labor → margin pressure
- Weakness → higher delinquencies
- Diversification → lower cyclicality
Bank retrenchment tailwind
Fed SLOOS (Q1 2025) shows continued net tightening of bank credit for small business and commercial loans, creating whitespace for nonbanks; Velocity can capture displaced demand through broker channels, improving origination volume. Reduced bank competition may lift pricing power, but gains hinge on disciplined credit filters and loss control.
- Fact: Fed SLOOS Q1 2025 – net tightening reported
- Opportunity: broker-led capture of displaced demand
- Impact: potential pricing upside
- Risk: execution requires strict credit filters
Policy shifts reshape nonbank lending; 60% mortgage share raises CRE and compliance risks
Interest-rate volatility (fed funds 5.25–5.50%, 10y ~3.7–4.5% in 2024–25) shifts affordability and prepay; cap rates up ~150–200bps since 2020 compress CRE values. Warehouse funding (60–80% of originations) and ABS recovery in 2024 restore liquidity while Fed SLOOS Q1 2025 shows net bank tightening, creating broker-led opportunities for Velocity.
| Metric | 2024–25 |
|---|---|
| Fed funds | 5.25–5.50% |
| 10y Treasury | 3.7–4.5% |
| Cap rate change vs 2020 | +150–200bps |
| Warehouse funding | 60–80% |
| Fed SLOOS | Net tightening Q1 2025 |
Full Version Awaits
Velocity PESTLE Analysis
The preview shown is the exact Velocity PESTLE Analysis you’ll receive after purchase—fully formatted, professionally structured, and ready to use. No placeholders or teasers: the content, layout, and insights match the downloadable file you get at checkout. Instant access upon payment.

Skip the Research. Get the Strategy.
Unlock strategic clarity with our Velocity PESTLE Analysis—three to five expert-level insights on how political, economic, social, technological, legal, and environmental forces shape the company’s trajectory. Ideal for investors and strategists, this ready-to-use report saves research time and strengthens decisions. Purchase the full PESTLE for the complete, editable breakdown and actionable recommendations.
Political factors
Regulatory oversight shifts
Administration changes can recalibrate priorities for nonbank lenders and commercial real estate credit; nonbank mortgage originations reached roughly 60% of the market in 2023 (MBA), signaling systemic importance. Heightened scrutiny on underwriting or broker compensation could raise compliance costs and operational burdens. Conversely, pro-small-business agendas (expanded SBA guarantees) may increase lending incentives. Velocity must monitor rulemaking calendars and comment periods to anticipate impacts.
State-level lending regimes
Licensing, usury limits and broker rules vary across all 50 states plus DC, creating distinct regulatory regimes for lenders. Patchwork compliance forces multi-state SBC lenders to manage licensing and bonding across up to 51 jurisdictions with divergent fee and reporting requirements. Tightening rules in key markets can slow originations, so proactive policy engagement and scalable compliance infrastructure are critical.
Housing and small-business policy
Programs promoting small-business recovery and property revitalization can lift loan demand, especially given small firms employ about 47% of the US private workforce; targeted grants and tax incentives for commercial upgrades historically increase borrowing. Homeownership ~65% signals housing-policy effects on mortgage and HELOC flows. Subsidy rollbacks can damp activity; Velocity can align products with eligible projects to capture these flows.
Real estate tax and 1031 dynamics
Federal or state shifts to depreciation, 1031 exchanges, or property taxes materially change investor appetite; less favorable tax treatment compresses deal flow and refinancing, contributing to lower CRE transaction volume (US CRE deals fell to about 179 billion USD in 2023, RCA) and raising holding costs given local property tax revenues exceed 540 billion USD annually (Census, 2022).
- Tax shocks reduce transaction volumes and refinancing
- Stability supports steady origination pipelines
- Scenario planning prices political tax risk into valuations
Local rent control and zoning
Municipal rules on rents, short-term uses, and density materially influence asset cash flows; lenders typically target DSCR of 1.2–1.35, so stricter rent controls can compress DSCR and reduce collateral values, while flexible zoning often spurs redevelopment and increases loan demand; market selection should explicitly factor policy trajectories and enforcement intensity.
- DSCR norms: 1.2–1.35
- Rent caps reduce upside and valuation multiples
- Flexible zoning boosts redevelopment pipeline and lending
- Include local policy trend analysis in market selection
Policy shifts reshape nonbank lending; 60% mortgage share raises CRE and compliance risks
Administration shifts recalibrate nonbank lending priorities; nonbank mortgage originations were ~60% in 2023 (MBA), elevating systemic exposure. State-by-state licensing, usury and broker rules create compliance complexity across 51 jurisdictions. Tax changes, rent controls and zoning shifts materially affect DSCR, transaction volumes and CRE liquidity.
| Metric | Value |
|---|---|
| Nonbank mortgage share (2023) | ~60% |
| US CRE deal volume (2023) | $179B |
| Homeownership rate | ~65% |
| Small firm employment | ~47% |
What is included in the product
Detailed Word Document
Explores how Political, Economic, Social, Technological, Environmental and Legal forces uniquely affect Velocity, with each section grounded in current data and industry-region specifics. Designed for executives and investors, it offers forward-looking insights, ready formatting for plans or pitches.
Customizable Excel Spreadsheet
Velocity PESTLE delivers a compact, visually segmented summary of external factors for rapid meeting reference, editable with context-specific notes and exportable to PowerPoint or Excel for seamless cross-team alignment.
Economic factors
Interest rate volatility
Interest rate volatility—with the US fed funds at 5.25–5.50% and the 10-year Treasury oscillating near 3.7–4.5% in 2024–25—directly alters borrower affordability and prepayment behavior. Wider spreads can lift yields but typically curb originations and volume. Lower policy rates may spur refinancing activity while compressing net interest margins. Dynamic pricing and active hedging are essential to manage duration and credit risk.
CRE valuations and cap rates
Rising cap rates—up roughly 150–200 basis points since 2020—compress CRE collateral values and erode LTV headroom, while appraisal conservatism is tightening borrower proceeds; stable income and selective market pricing, however, have enabled continued securitization execution in 2024–25, and lenders’ conservative advance rates (often 60–70% for office/retail) provide a buffer against near‑term downside.
Securitization and liquidity
Securitization and liquidity are critical for SBC lenders, with warehouse lines commonly funding 60-80% of originations and capital markets takeouts key to balance-sheet capacity. During risk-off episodes spreads can widen by hundreds of basis points and issuance volumes slow, constraining originations. Robust investor demand, as seen in recoveries of ABS markets in 2024, lowers funding costs and enables growth. Maintaining multiple funding channels mitigates sudden liquidity shocks.
Small business health
Consumer spending, input costs and tight labor markets directly drive tenant and owner cash flow; small firms employ about half the private US workforce and contribute roughly 44% of economic activity (SBA), so weakness raises delinquencies and modifies loans while strength supports originations and portfolio performance; sector diversification lowers cyclicality.
- Consumer spending → cash flow
- Input costs & labor → margin pressure
- Weakness → higher delinquencies
- Diversification → lower cyclicality
Bank retrenchment tailwind
Fed SLOOS (Q1 2025) shows continued net tightening of bank credit for small business and commercial loans, creating whitespace for nonbanks; Velocity can capture displaced demand through broker channels, improving origination volume. Reduced bank competition may lift pricing power, but gains hinge on disciplined credit filters and loss control.
- Fact: Fed SLOOS Q1 2025 – net tightening reported
- Opportunity: broker-led capture of displaced demand
- Impact: potential pricing upside
- Risk: execution requires strict credit filters
Policy shifts reshape nonbank lending; 60% mortgage share raises CRE and compliance risks
Interest-rate volatility (fed funds 5.25–5.50%, 10y ~3.7–4.5% in 2024–25) shifts affordability and prepay; cap rates up ~150–200bps since 2020 compress CRE values. Warehouse funding (60–80% of originations) and ABS recovery in 2024 restore liquidity while Fed SLOOS Q1 2025 shows net bank tightening, creating broker-led opportunities for Velocity.
| Metric | 2024–25 |
|---|---|
| Fed funds | 5.25–5.50% |
| 10y Treasury | 3.7–4.5% |
| Cap rate change vs 2020 | +150–200bps |
| Warehouse funding | 60–80% |
| Fed SLOOS | Net tightening Q1 2025 |
Full Version Awaits
Velocity PESTLE Analysis
The preview shown is the exact Velocity PESTLE Analysis you’ll receive after purchase—fully formatted, professionally structured, and ready to use. No placeholders or teasers: the content, layout, and insights match the downloadable file you get at checkout. Instant access upon payment.
Original: $10.00
-65%$10.00
$3.50Description
Skip the Research. Get the Strategy.
Unlock strategic clarity with our Velocity PESTLE Analysis—three to five expert-level insights on how political, economic, social, technological, legal, and environmental forces shape the company’s trajectory. Ideal for investors and strategists, this ready-to-use report saves research time and strengthens decisions. Purchase the full PESTLE for the complete, editable breakdown and actionable recommendations.
Political factors
Regulatory oversight shifts
Administration changes can recalibrate priorities for nonbank lenders and commercial real estate credit; nonbank mortgage originations reached roughly 60% of the market in 2023 (MBA), signaling systemic importance. Heightened scrutiny on underwriting or broker compensation could raise compliance costs and operational burdens. Conversely, pro-small-business agendas (expanded SBA guarantees) may increase lending incentives. Velocity must monitor rulemaking calendars and comment periods to anticipate impacts.
State-level lending regimes
Licensing, usury limits and broker rules vary across all 50 states plus DC, creating distinct regulatory regimes for lenders. Patchwork compliance forces multi-state SBC lenders to manage licensing and bonding across up to 51 jurisdictions with divergent fee and reporting requirements. Tightening rules in key markets can slow originations, so proactive policy engagement and scalable compliance infrastructure are critical.
Housing and small-business policy
Programs promoting small-business recovery and property revitalization can lift loan demand, especially given small firms employ about 47% of the US private workforce; targeted grants and tax incentives for commercial upgrades historically increase borrowing. Homeownership ~65% signals housing-policy effects on mortgage and HELOC flows. Subsidy rollbacks can damp activity; Velocity can align products with eligible projects to capture these flows.
Real estate tax and 1031 dynamics
Federal or state shifts to depreciation, 1031 exchanges, or property taxes materially change investor appetite; less favorable tax treatment compresses deal flow and refinancing, contributing to lower CRE transaction volume (US CRE deals fell to about 179 billion USD in 2023, RCA) and raising holding costs given local property tax revenues exceed 540 billion USD annually (Census, 2022).
- Tax shocks reduce transaction volumes and refinancing
- Stability supports steady origination pipelines
- Scenario planning prices political tax risk into valuations
Local rent control and zoning
Municipal rules on rents, short-term uses, and density materially influence asset cash flows; lenders typically target DSCR of 1.2–1.35, so stricter rent controls can compress DSCR and reduce collateral values, while flexible zoning often spurs redevelopment and increases loan demand; market selection should explicitly factor policy trajectories and enforcement intensity.
- DSCR norms: 1.2–1.35
- Rent caps reduce upside and valuation multiples
- Flexible zoning boosts redevelopment pipeline and lending
- Include local policy trend analysis in market selection
Policy shifts reshape nonbank lending; 60% mortgage share raises CRE and compliance risks
Administration shifts recalibrate nonbank lending priorities; nonbank mortgage originations were ~60% in 2023 (MBA), elevating systemic exposure. State-by-state licensing, usury and broker rules create compliance complexity across 51 jurisdictions. Tax changes, rent controls and zoning shifts materially affect DSCR, transaction volumes and CRE liquidity.
| Metric | Value |
|---|---|
| Nonbank mortgage share (2023) | ~60% |
| US CRE deal volume (2023) | $179B |
| Homeownership rate | ~65% |
| Small firm employment | ~47% |
What is included in the product
Detailed Word Document
Explores how Political, Economic, Social, Technological, Environmental and Legal forces uniquely affect Velocity, with each section grounded in current data and industry-region specifics. Designed for executives and investors, it offers forward-looking insights, ready formatting for plans or pitches.
Customizable Excel Spreadsheet
Velocity PESTLE delivers a compact, visually segmented summary of external factors for rapid meeting reference, editable with context-specific notes and exportable to PowerPoint or Excel for seamless cross-team alignment.
Economic factors
Interest rate volatility
Interest rate volatility—with the US fed funds at 5.25–5.50% and the 10-year Treasury oscillating near 3.7–4.5% in 2024–25—directly alters borrower affordability and prepayment behavior. Wider spreads can lift yields but typically curb originations and volume. Lower policy rates may spur refinancing activity while compressing net interest margins. Dynamic pricing and active hedging are essential to manage duration and credit risk.
CRE valuations and cap rates
Rising cap rates—up roughly 150–200 basis points since 2020—compress CRE collateral values and erode LTV headroom, while appraisal conservatism is tightening borrower proceeds; stable income and selective market pricing, however, have enabled continued securitization execution in 2024–25, and lenders’ conservative advance rates (often 60–70% for office/retail) provide a buffer against near‑term downside.
Securitization and liquidity
Securitization and liquidity are critical for SBC lenders, with warehouse lines commonly funding 60-80% of originations and capital markets takeouts key to balance-sheet capacity. During risk-off episodes spreads can widen by hundreds of basis points and issuance volumes slow, constraining originations. Robust investor demand, as seen in recoveries of ABS markets in 2024, lowers funding costs and enables growth. Maintaining multiple funding channels mitigates sudden liquidity shocks.
Small business health
Consumer spending, input costs and tight labor markets directly drive tenant and owner cash flow; small firms employ about half the private US workforce and contribute roughly 44% of economic activity (SBA), so weakness raises delinquencies and modifies loans while strength supports originations and portfolio performance; sector diversification lowers cyclicality.
- Consumer spending → cash flow
- Input costs & labor → margin pressure
- Weakness → higher delinquencies
- Diversification → lower cyclicality
Bank retrenchment tailwind
Fed SLOOS (Q1 2025) shows continued net tightening of bank credit for small business and commercial loans, creating whitespace for nonbanks; Velocity can capture displaced demand through broker channels, improving origination volume. Reduced bank competition may lift pricing power, but gains hinge on disciplined credit filters and loss control.
- Fact: Fed SLOOS Q1 2025 – net tightening reported
- Opportunity: broker-led capture of displaced demand
- Impact: potential pricing upside
- Risk: execution requires strict credit filters
Policy shifts reshape nonbank lending; 60% mortgage share raises CRE and compliance risks
Interest-rate volatility (fed funds 5.25–5.50%, 10y ~3.7–4.5% in 2024–25) shifts affordability and prepay; cap rates up ~150–200bps since 2020 compress CRE values. Warehouse funding (60–80% of originations) and ABS recovery in 2024 restore liquidity while Fed SLOOS Q1 2025 shows net bank tightening, creating broker-led opportunities for Velocity.
| Metric | 2024–25 |
|---|---|
| Fed funds | 5.25–5.50% |
| 10y Treasury | 3.7–4.5% |
| Cap rate change vs 2020 | +150–200bps |
| Warehouse funding | 60–80% |
| Fed SLOOS | Net tightening Q1 2025 |
Full Version Awaits
Velocity PESTLE Analysis
The preview shown is the exact Velocity PESTLE Analysis you’ll receive after purchase—fully formatted, professionally structured, and ready to use. No placeholders or teasers: the content, layout, and insights match the downloadable file you get at checkout. Instant access upon payment.











