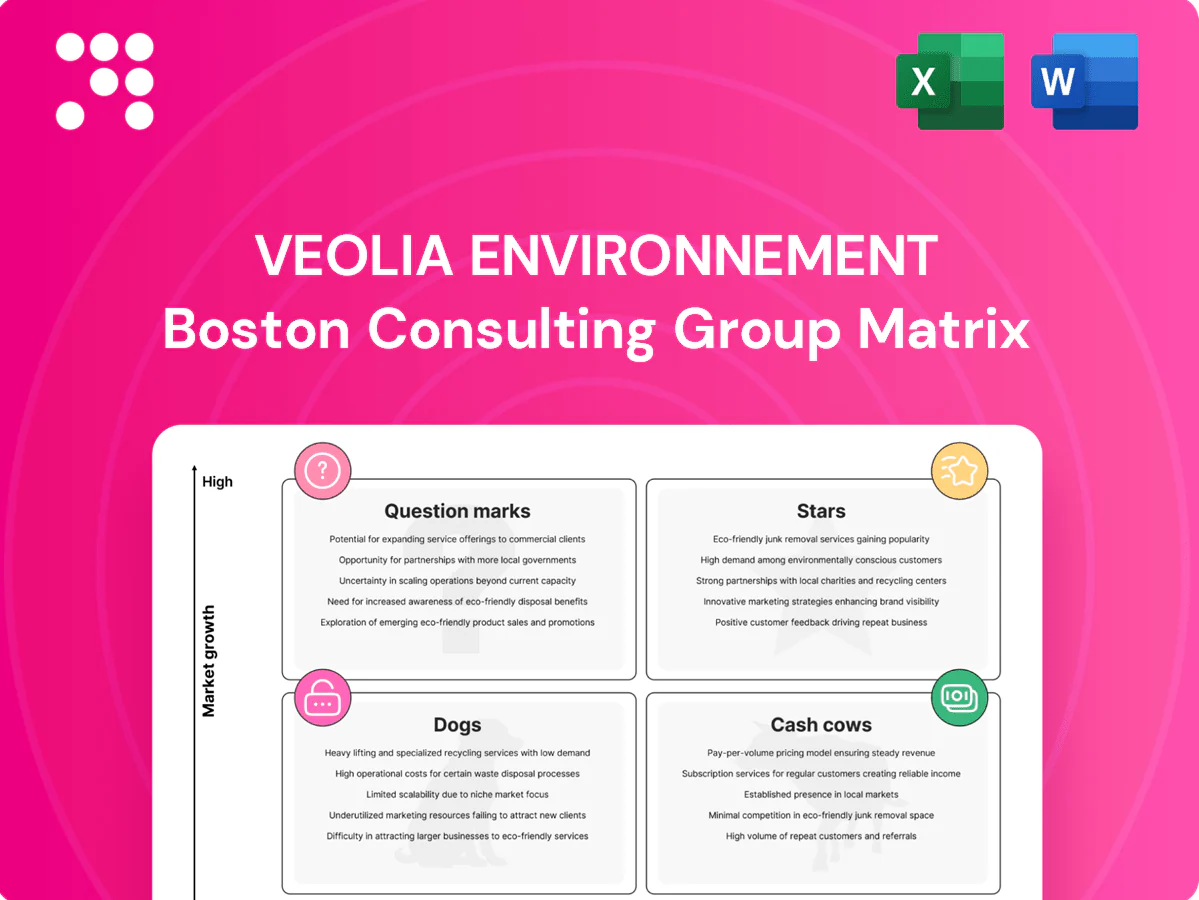
Veolia Environnement Boston Consulting Group Matrix

Actionable Strategy Starts Here
Veolia Environnement’s BCG Matrix snapshot shows which services are scaling fast, which generate steady cash, and where the business risks draining resources—think water, waste, energy lines mapped to Stars, Cash Cows, Dogs, and Question Marks. This preview scratches the surface; buy the full BCG Matrix for quadrant-by-quadrant analysis, data-backed moves, and ready-to-use Word + Excel files to act on immediately.
Stars

Industrial wastewater reuse
Industrial wastewater reuse is a hot lane—industrial demand and stricter regulations plus water-scarcity tailwinds (over 2 billion people in water-stressed areas) drive a market growing high-single digits; Veolia’s tech depth and references underpin a solid, defendable share after its €38.6bn 2023 revenue scale. It still requires targeted capex, pilots and intensified sales to scale across sectors. Continue investing to lock leadership before rivals crowd in.
Hazardous waste treatment & recovery
Regulatory pressure and EU recycling targets (55% by 2025, 60% by 2030, 65% by 2035) are accelerating hazardous waste recovery demand. Veolia’s specialized permits and treatment sites underpin a strong competitive moat and healthy share in the niche; the group reported revenue of about €42.1bn in 2023. Ongoing capacity builds and tightening compliance raise cash needs. Double down while entry barriers remain high and pricing stays rational.

Digital water & smart metering platforms
Cities and industry demand leak reduction, real-time operations and verified savings are driving strong growth in smart metering, with the global smart water market expanding rapidly in 2024. Veolia’s large installed base reaching tens of millions of customers and deep operational know‑how enable it to win and retain contracts and capture life‑cycle revenue. Continuous product upgrades and integrations keep cash burn high during rollout phases. At scale, recurring service margins and retrofit leverage can shift the business from rollout‑heavy to cash generative.

Waste-to-energy & energy recovery
Waste-to-energy and energy recovery are Stars: market expanding (global WtE market ~5% CAGR in 2024–2030) driven by landfill diversion and decarbonization. Veolia holds meaningful share via roughly 250 plants, extensive biogas capture and operations expertise, converting feedstock into heat/electricity. Projects are capital hungry and politically sensitive, so careful siting and community engagement are critical to sustain returns and convert assets into stable yield generators.
- Market growth: ~5% CAGR (2024–2030)
- Veolia footprint: ~250 WtE/energy recovery units
- Capital intensity: high; requires public acceptance
- Outcome: sustained ops => stable yield assets
District energy decarbonization
District energy decarbonization sits in Stars: urban heat networks are rapidly modernizing via electrification, biomass and large heat pumps; Veolia operates extensive networks and can bundle efficiency upgrades with low‑carbon heat procurement to drive margin expansion. Upfront engineering and project finance needs are material; executed well, these platforms mature into steady cash generators.
- Position: Star — high growth, high share
- Drivers: electrification, biomass, heat pumps
- Risks: capex, financing, execution
- Outcome: long‑term cash flow
Growth, scale and capex friction: €38.6bn revenue, ~250 WtE units
Veolia’s Stars—industrial wastewater reuse, hazardous recovery, smart metering, WtE and district energy—benefit from strong end‑market growth (industrial water demand, EU recycling targets, smart water adoption and ~5% WtE CAGR 2024–30) and Veolia scale (≈€38.6bn revenue 2023, ~250 WtE units). High capex and rollout losses persist; continued targeted investment and permitting wins needed to convert into stable cash generators.
| Segment | Growth | Veolia scale | Key risk |
|---|---|---|---|
| Industrial WW reuse | high‑single % | €38.6bn rev (2023) | capex, pilots |
| Hazardous recovery | accelerating (EU targets) | specialized sites | permits, capacity |
| Smart metering | rapid 2024 uptake | tens of millions customers | rollout burn |
| WtE | ~5% CAGR (24–30) | ~250 units | capex, public acceptance |
| District energy | strong urban electrification | extensive networks | project finance |
What is included in the product
 Detailed Word Document
BCG matrix review of Veolia: stars, cash cows, question marks and dogs with investment, hold or divest guidance and trend context.

 Customizable Excel Spreadsheet
One-page Veolia BCG Matrix pinpointing underperformers and growth bets for faster strategic fixes.
Cash Cows

Municipal drinking water operations
Mature, essential municipal drinking water operations with long-term, sticky contracts and predictable volumes exhibit modest growth but low churn. Veolia’s brand and track record translate into high regional share—serving 95 million people with water services in 2024. Margins are defendable through operational excellence and tariff indexing. These cash flows finance steady payouts while upgrading assets for efficiency.
Municipal wastewater operations
Municipal wastewater operations are classic cash cows: regulated, contracted and low volatility, delivering predictable margins and high cash conversion; Veolia’s consolidated water activities remained core in 2024, supporting group scale and renewals. Scale and process know‑how keep unit costs low and renewal rates high under long‑term contracts. Organic growth limited but stable cash fuels automation investment to protect service levels and contract renewals.

Core waste collection in mature markets
Core waste collection in mature markets yields dependable cash: route density, long-term tenders (typically 7–12 years) and repeat municipal demand keep churn near zero and earnings steady. Veolia’s network scale — operating in 40+ countries (2024) — supports pricing power and high fleet utilization. Market growth is slow but predictable; focus remains on keeping fleets efficient and safety tight to protect margins.

Long-term O&M contracts for utilities/industry
Long-term O&M contracts (typically 5–15 years) with clear SLAs and CPI or energy-indexed inflation pass-throughs generate steady operating cash for Veolia; these agreements underpin predictable free cash flow profiles. Veolia’s market credibility and scale reduce bid risk and support high renewal likelihood, while upside is constrained absent scope creep. Management emphasis remains on margin discipline and selective renewals to protect FCF.
- Contract length: 5–15 years
- Inflation pass-through: CPI/energy-indexed
- Retention: high renewal likelihood
- Strategy: margin discipline, selective renewals
Regulated water services in stable geographies
Regulated water services in stable geographies deliver highly predictable returns under tariff frameworks, with Veolia's water segment representing roughly 30% of group revenue and contributing to stable margins in 2024; growth is capped by regulation but allowed returns and indexed tariffs secure cash generation.
- High predictability: tariff-indexed cash flows
- Scale: ~30% of Veolia 2024 revenue
- Growth limited by regulation
- Optimize capex timing to capture incentive mechanisms
Tariff-linked water & waste O&M: long contracts, predictable cash and steady dividends
Mature, regulated water and wastewater O&M with long contracts (5–15 yrs) deliver stable, tariff‑indexed cash flows; Veolia served 95m people in 2024 and water ~30% of group revenue. Core waste collection in 40+ countries yields predictable route-density margins. High renewal rates and CPI/energy pass-throughs protect cash, funding capex and dividends with limited organic growth upside.
| Metric | 2024 |
|---|---|
| People served (water) | 95M |
| Water share of revenue | ~30% |
| Geographic reach | 40+ countries |
| Contract length | 5–15 yrs |
What You’re Viewing Is Included
Veolia Environnement BCG Matrix
The Veolia Environnement BCG Matrix you’re previewing is the exact final file you’ll get after purchase. No watermarks, no placeholders—just a fully formatted, analysis-ready report tailored for strategic decisions. It’s designed for immediate use in presentations, planning, or board reviews. Buy once, download instantly, and start presenting with confidence.

Actionable Strategy Starts Here
Veolia Environnement’s BCG Matrix snapshot shows which services are scaling fast, which generate steady cash, and where the business risks draining resources—think water, waste, energy lines mapped to Stars, Cash Cows, Dogs, and Question Marks. This preview scratches the surface; buy the full BCG Matrix for quadrant-by-quadrant analysis, data-backed moves, and ready-to-use Word + Excel files to act on immediately.
Stars
Industrial wastewater reuse
Industrial wastewater reuse is a hot lane—industrial demand and stricter regulations plus water-scarcity tailwinds (over 2 billion people in water-stressed areas) drive a market growing high-single digits; Veolia’s tech depth and references underpin a solid, defendable share after its €38.6bn 2023 revenue scale. It still requires targeted capex, pilots and intensified sales to scale across sectors. Continue investing to lock leadership before rivals crowd in.
Hazardous waste treatment & recovery
Regulatory pressure and EU recycling targets (55% by 2025, 60% by 2030, 65% by 2035) are accelerating hazardous waste recovery demand. Veolia’s specialized permits and treatment sites underpin a strong competitive moat and healthy share in the niche; the group reported revenue of about €42.1bn in 2023. Ongoing capacity builds and tightening compliance raise cash needs. Double down while entry barriers remain high and pricing stays rational.
Digital water & smart metering platforms
Cities and industry demand leak reduction, real-time operations and verified savings are driving strong growth in smart metering, with the global smart water market expanding rapidly in 2024. Veolia’s large installed base reaching tens of millions of customers and deep operational know‑how enable it to win and retain contracts and capture life‑cycle revenue. Continuous product upgrades and integrations keep cash burn high during rollout phases. At scale, recurring service margins and retrofit leverage can shift the business from rollout‑heavy to cash generative.
Waste-to-energy & energy recovery
Waste-to-energy and energy recovery are Stars: market expanding (global WtE market ~5% CAGR in 2024–2030) driven by landfill diversion and decarbonization. Veolia holds meaningful share via roughly 250 plants, extensive biogas capture and operations expertise, converting feedstock into heat/electricity. Projects are capital hungry and politically sensitive, so careful siting and community engagement are critical to sustain returns and convert assets into stable yield generators.
- Market growth: ~5% CAGR (2024–2030)
- Veolia footprint: ~250 WtE/energy recovery units
- Capital intensity: high; requires public acceptance
- Outcome: sustained ops => stable yield assets
District energy decarbonization
District energy decarbonization sits in Stars: urban heat networks are rapidly modernizing via electrification, biomass and large heat pumps; Veolia operates extensive networks and can bundle efficiency upgrades with low‑carbon heat procurement to drive margin expansion. Upfront engineering and project finance needs are material; executed well, these platforms mature into steady cash generators.
- Position: Star — high growth, high share
- Drivers: electrification, biomass, heat pumps
- Risks: capex, financing, execution
- Outcome: long‑term cash flow
Growth, scale and capex friction: €38.6bn revenue, ~250 WtE units
Veolia’s Stars—industrial wastewater reuse, hazardous recovery, smart metering, WtE and district energy—benefit from strong end‑market growth (industrial water demand, EU recycling targets, smart water adoption and ~5% WtE CAGR 2024–30) and Veolia scale (≈€38.6bn revenue 2023, ~250 WtE units). High capex and rollout losses persist; continued targeted investment and permitting wins needed to convert into stable cash generators.
| Segment | Growth | Veolia scale | Key risk |
|---|---|---|---|
| Industrial WW reuse | high‑single % | €38.6bn rev (2023) | capex, pilots |
| Hazardous recovery | accelerating (EU targets) | specialized sites | permits, capacity |
| Smart metering | rapid 2024 uptake | tens of millions customers | rollout burn |
| WtE | ~5% CAGR (24–30) | ~250 units | capex, public acceptance |
| District energy | strong urban electrification | extensive networks | project finance |
What is included in the product
Detailed Word Document
BCG matrix review of Veolia: stars, cash cows, question marks and dogs with investment, hold or divest guidance and trend context.
Customizable Excel Spreadsheet
One-page Veolia BCG Matrix pinpointing underperformers and growth bets for faster strategic fixes.
Cash Cows
Municipal drinking water operations
Mature, essential municipal drinking water operations with long-term, sticky contracts and predictable volumes exhibit modest growth but low churn. Veolia’s brand and track record translate into high regional share—serving 95 million people with water services in 2024. Margins are defendable through operational excellence and tariff indexing. These cash flows finance steady payouts while upgrading assets for efficiency.
Municipal wastewater operations
Municipal wastewater operations are classic cash cows: regulated, contracted and low volatility, delivering predictable margins and high cash conversion; Veolia’s consolidated water activities remained core in 2024, supporting group scale and renewals. Scale and process know‑how keep unit costs low and renewal rates high under long‑term contracts. Organic growth limited but stable cash fuels automation investment to protect service levels and contract renewals.
Core waste collection in mature markets
Core waste collection in mature markets yields dependable cash: route density, long-term tenders (typically 7–12 years) and repeat municipal demand keep churn near zero and earnings steady. Veolia’s network scale — operating in 40+ countries (2024) — supports pricing power and high fleet utilization. Market growth is slow but predictable; focus remains on keeping fleets efficient and safety tight to protect margins.
Long-term O&M contracts for utilities/industry
Long-term O&M contracts (typically 5–15 years) with clear SLAs and CPI or energy-indexed inflation pass-throughs generate steady operating cash for Veolia; these agreements underpin predictable free cash flow profiles. Veolia’s market credibility and scale reduce bid risk and support high renewal likelihood, while upside is constrained absent scope creep. Management emphasis remains on margin discipline and selective renewals to protect FCF.
- Contract length: 5–15 years
- Inflation pass-through: CPI/energy-indexed
- Retention: high renewal likelihood
- Strategy: margin discipline, selective renewals
Regulated water services in stable geographies
Regulated water services in stable geographies deliver highly predictable returns under tariff frameworks, with Veolia's water segment representing roughly 30% of group revenue and contributing to stable margins in 2024; growth is capped by regulation but allowed returns and indexed tariffs secure cash generation.
- High predictability: tariff-indexed cash flows
- Scale: ~30% of Veolia 2024 revenue
- Growth limited by regulation
- Optimize capex timing to capture incentive mechanisms
Tariff-linked water & waste O&M: long contracts, predictable cash and steady dividends
Mature, regulated water and wastewater O&M with long contracts (5–15 yrs) deliver stable, tariff‑indexed cash flows; Veolia served 95m people in 2024 and water ~30% of group revenue. Core waste collection in 40+ countries yields predictable route-density margins. High renewal rates and CPI/energy pass-throughs protect cash, funding capex and dividends with limited organic growth upside.
| Metric | 2024 |
|---|---|
| People served (water) | 95M |
| Water share of revenue | ~30% |
| Geographic reach | 40+ countries |
| Contract length | 5–15 yrs |
What You’re Viewing Is Included
Veolia Environnement BCG Matrix
The Veolia Environnement BCG Matrix you’re previewing is the exact final file you’ll get after purchase. No watermarks, no placeholders—just a fully formatted, analysis-ready report tailored for strategic decisions. It’s designed for immediate use in presentations, planning, or board reviews. Buy once, download instantly, and start presenting with confidence.
Description
Actionable Strategy Starts Here
Veolia Environnement’s BCG Matrix snapshot shows which services are scaling fast, which generate steady cash, and where the business risks draining resources—think water, waste, energy lines mapped to Stars, Cash Cows, Dogs, and Question Marks. This preview scratches the surface; buy the full BCG Matrix for quadrant-by-quadrant analysis, data-backed moves, and ready-to-use Word + Excel files to act on immediately.
Stars
Industrial wastewater reuse
Industrial wastewater reuse is a hot lane—industrial demand and stricter regulations plus water-scarcity tailwinds (over 2 billion people in water-stressed areas) drive a market growing high-single digits; Veolia’s tech depth and references underpin a solid, defendable share after its €38.6bn 2023 revenue scale. It still requires targeted capex, pilots and intensified sales to scale across sectors. Continue investing to lock leadership before rivals crowd in.
Hazardous waste treatment & recovery
Regulatory pressure and EU recycling targets (55% by 2025, 60% by 2030, 65% by 2035) are accelerating hazardous waste recovery demand. Veolia’s specialized permits and treatment sites underpin a strong competitive moat and healthy share in the niche; the group reported revenue of about €42.1bn in 2023. Ongoing capacity builds and tightening compliance raise cash needs. Double down while entry barriers remain high and pricing stays rational.
Digital water & smart metering platforms
Cities and industry demand leak reduction, real-time operations and verified savings are driving strong growth in smart metering, with the global smart water market expanding rapidly in 2024. Veolia’s large installed base reaching tens of millions of customers and deep operational know‑how enable it to win and retain contracts and capture life‑cycle revenue. Continuous product upgrades and integrations keep cash burn high during rollout phases. At scale, recurring service margins and retrofit leverage can shift the business from rollout‑heavy to cash generative.
Waste-to-energy & energy recovery
Waste-to-energy and energy recovery are Stars: market expanding (global WtE market ~5% CAGR in 2024–2030) driven by landfill diversion and decarbonization. Veolia holds meaningful share via roughly 250 plants, extensive biogas capture and operations expertise, converting feedstock into heat/electricity. Projects are capital hungry and politically sensitive, so careful siting and community engagement are critical to sustain returns and convert assets into stable yield generators.
- Market growth: ~5% CAGR (2024–2030)
- Veolia footprint: ~250 WtE/energy recovery units
- Capital intensity: high; requires public acceptance
- Outcome: sustained ops => stable yield assets
District energy decarbonization
District energy decarbonization sits in Stars: urban heat networks are rapidly modernizing via electrification, biomass and large heat pumps; Veolia operates extensive networks and can bundle efficiency upgrades with low‑carbon heat procurement to drive margin expansion. Upfront engineering and project finance needs are material; executed well, these platforms mature into steady cash generators.
- Position: Star — high growth, high share
- Drivers: electrification, biomass, heat pumps
- Risks: capex, financing, execution
- Outcome: long‑term cash flow
Growth, scale and capex friction: €38.6bn revenue, ~250 WtE units
Veolia’s Stars—industrial wastewater reuse, hazardous recovery, smart metering, WtE and district energy—benefit from strong end‑market growth (industrial water demand, EU recycling targets, smart water adoption and ~5% WtE CAGR 2024–30) and Veolia scale (≈€38.6bn revenue 2023, ~250 WtE units). High capex and rollout losses persist; continued targeted investment and permitting wins needed to convert into stable cash generators.
| Segment | Growth | Veolia scale | Key risk |
|---|---|---|---|
| Industrial WW reuse | high‑single % | €38.6bn rev (2023) | capex, pilots |
| Hazardous recovery | accelerating (EU targets) | specialized sites | permits, capacity |
| Smart metering | rapid 2024 uptake | tens of millions customers | rollout burn |
| WtE | ~5% CAGR (24–30) | ~250 units | capex, public acceptance |
| District energy | strong urban electrification | extensive networks | project finance |
What is included in the product
Detailed Word Document
BCG matrix review of Veolia: stars, cash cows, question marks and dogs with investment, hold or divest guidance and trend context.
Customizable Excel Spreadsheet
One-page Veolia BCG Matrix pinpointing underperformers and growth bets for faster strategic fixes.
Cash Cows
Municipal drinking water operations
Mature, essential municipal drinking water operations with long-term, sticky contracts and predictable volumes exhibit modest growth but low churn. Veolia’s brand and track record translate into high regional share—serving 95 million people with water services in 2024. Margins are defendable through operational excellence and tariff indexing. These cash flows finance steady payouts while upgrading assets for efficiency.
Municipal wastewater operations
Municipal wastewater operations are classic cash cows: regulated, contracted and low volatility, delivering predictable margins and high cash conversion; Veolia’s consolidated water activities remained core in 2024, supporting group scale and renewals. Scale and process know‑how keep unit costs low and renewal rates high under long‑term contracts. Organic growth limited but stable cash fuels automation investment to protect service levels and contract renewals.
Core waste collection in mature markets
Core waste collection in mature markets yields dependable cash: route density, long-term tenders (typically 7–12 years) and repeat municipal demand keep churn near zero and earnings steady. Veolia’s network scale — operating in 40+ countries (2024) — supports pricing power and high fleet utilization. Market growth is slow but predictable; focus remains on keeping fleets efficient and safety tight to protect margins.
Long-term O&M contracts for utilities/industry
Long-term O&M contracts (typically 5–15 years) with clear SLAs and CPI or energy-indexed inflation pass-throughs generate steady operating cash for Veolia; these agreements underpin predictable free cash flow profiles. Veolia’s market credibility and scale reduce bid risk and support high renewal likelihood, while upside is constrained absent scope creep. Management emphasis remains on margin discipline and selective renewals to protect FCF.
- Contract length: 5–15 years
- Inflation pass-through: CPI/energy-indexed
- Retention: high renewal likelihood
- Strategy: margin discipline, selective renewals
Regulated water services in stable geographies
Regulated water services in stable geographies deliver highly predictable returns under tariff frameworks, with Veolia's water segment representing roughly 30% of group revenue and contributing to stable margins in 2024; growth is capped by regulation but allowed returns and indexed tariffs secure cash generation.
- High predictability: tariff-indexed cash flows
- Scale: ~30% of Veolia 2024 revenue
- Growth limited by regulation
- Optimize capex timing to capture incentive mechanisms
Tariff-linked water & waste O&M: long contracts, predictable cash and steady dividends
Mature, regulated water and wastewater O&M with long contracts (5–15 yrs) deliver stable, tariff‑indexed cash flows; Veolia served 95m people in 2024 and water ~30% of group revenue. Core waste collection in 40+ countries yields predictable route-density margins. High renewal rates and CPI/energy pass-throughs protect cash, funding capex and dividends with limited organic growth upside.
| Metric | 2024 |
|---|---|
| People served (water) | 95M |
| Water share of revenue | ~30% |
| Geographic reach | 40+ countries |
| Contract length | 5–15 yrs |
What You’re Viewing Is Included
Veolia Environnement BCG Matrix
The Veolia Environnement BCG Matrix you’re previewing is the exact final file you’ll get after purchase. No watermarks, no placeholders—just a fully formatted, analysis-ready report tailored for strategic decisions. It’s designed for immediate use in presentations, planning, or board reviews. Buy once, download instantly, and start presenting with confidence.











