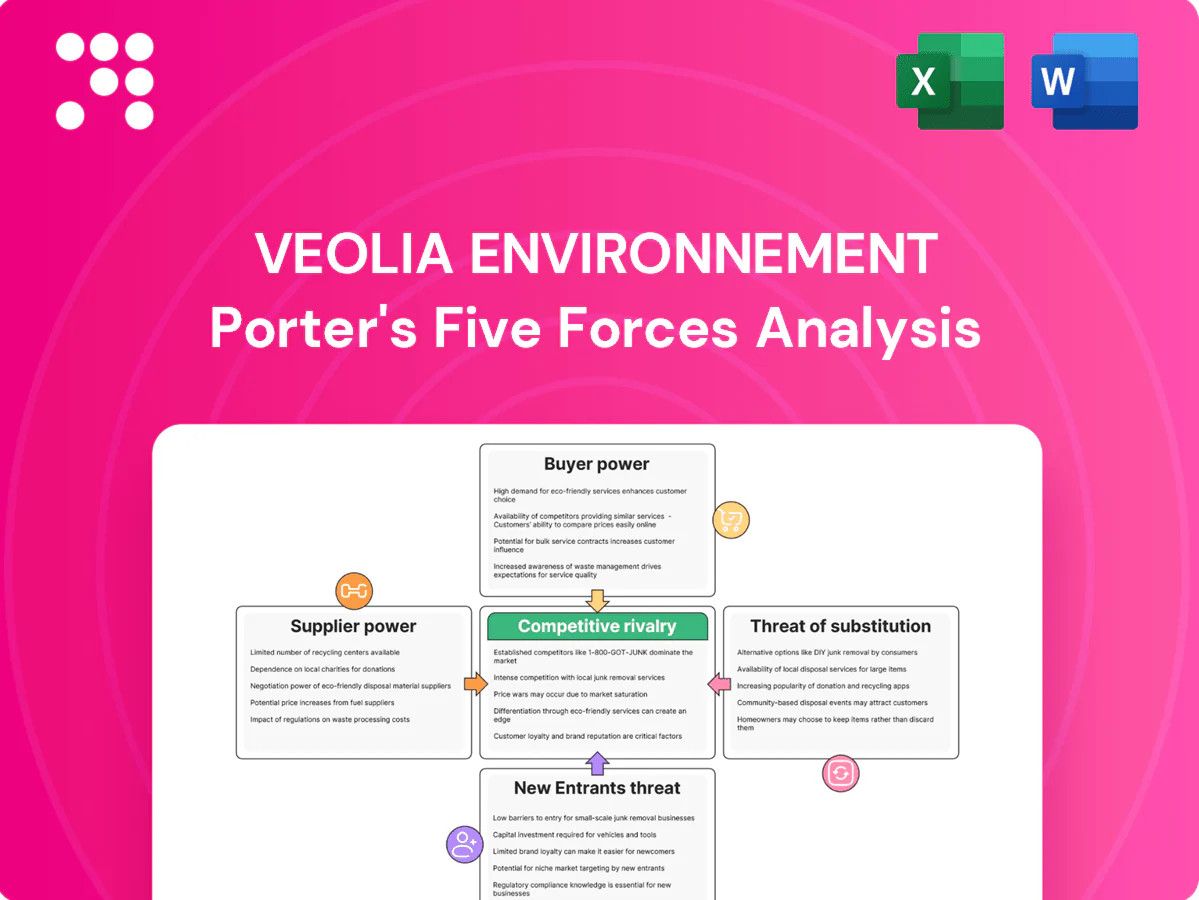
Veolia Environnement Porter's Five Forces Analysis

From Overview to Strategy Blueprint
Veolia faces intense competitive rivalry across water, waste and energy services, with scale and regulation keeping new entrants at bay; buyer power is meaningful for large municipal contracts while supplier influence is moderate and substitutes are limited. This brief snapshot only scratches the surface. Unlock the full Porter's Five Forces Analysis to explore Veolia Environnement’s competitive dynamics in detail.
Suppliers Bargaining Power

Critical equipment and chemicals
Veolia depends on specialized membranes, pumps and treatment chemicals supplied by a small set of OEMs and formulators, concentrating supplier power and raising switching costs and lead times. Framework agreements and multi‑sourcing reduce dependence, while Veolia’s global scale — c.220,000 employees and multinational operations — strengthens bargaining to obtain volume discounts and enhanced technical support.
Energy and fuel inputs
Energy is a major operating input across Veolia’s water, waste and energy services; European electricity and gas price volatility remained elevated in 2024 after 2022–23 shocks, with spot swings exceeding 100% in some markets and compressing margins where pass-through clauses are weak. Hedging and index-linked contracts in service agreements and commodity hedges reduce exposure, while on-site energy self-generation from biogas and waste-to-energy plants provides partial insulation and lowers net fuel purchases.

Labor and specialized contractors
Skilled operators, engineers and certified technicians are critical for Veolia, which employed about 214,000 people worldwide in 2023, making specialized labor a powerful supplier segment. Strong union presence in France and local labor regulations raise bargaining leverage and operating rigidity. Veolia’s in‑house training programs and standardized procedures reduce reliance on external contractors, while investments in digital tools and automation are gradually lowering labor intensity and long‑term supplier dependency.

Technology and digital platforms
Advanced analytics, sensors and control systems for utilities often come from a concentrated vendor set, with the top five industrial automation suppliers holding roughly 60% of market share in 2024, creating supplier bargaining power and risk of vendor lock-in via proprietary protocols and data models.
- Open-architecture/API strategies preserve flexibility
- Co-development partnerships lower pricing pressure
- Vendor concentration ~60% (2024)
Waste feedstock and disposal capacity
Access to third-party landfills, MRFs and hazardous-treatment sites can become regionally bottlenecked, shifting leverage to suppliers as local gate fees rise when capacity tightens.
Long-term offtake contracts and capacity reservations (common in Veolia's sector) stabilize input costs and reduce exposure to spot-price spikes.
Vertical integration into disposal and recovery operations lowers reliance on external capacity and weakens supplier bargaining power.
- Regional bottlenecks → higher gate fees
- Long-term contracts → cost stability
- Vertical integration → reduced supplier leverage
Supplier concentration and energy volatility raise input risk; scale, hedging, offtakes mitigate
Supplier power is elevated for membranes, pumps and chemicals with top vendors concentrated (~60% market share, 2024), while energy volatility (spot swings >100% in some markets, 2024) and regional landfill bottlenecks raise input risk. Veolia’s scale (214,000 employees, 2023), long‑term offtakes, hedging and on‑site energy partially mitigate supplier leverage.
| Metric | Value |
|---|---|
| Top‑vendor concentration | ~60% (2024) |
| Energy spot volatility | >100% swings (2024) |
| Employees | 214,000 (2023) |
| Mitigants | Hedging, long‑term contracts, vertical integration |
What is included in the product
 Detailed Word Document
Tailored Porter's Five Forces analysis of Veolia Environnement uncovering competitive intensity, supplier and buyer bargaining power, threat of substitutes and new entrants, and identifying disruptive forces and regulatory dynamics that shape its pricing, margins, and strategic positioning.

 Customizable Excel Spreadsheet
Clear one-sheet Porter's Five Forces for Veolia Environnement that simplifies competitive pressures and regulatory risks into an executive-ready radar chart. Customize force levels, swap in your data, and drop directly into pitch decks or dashboards—no macros or finance expertise required.
Customers Bargaining Power

Municipal procurement and PPPs
Cities and utilities, representing public procurement worth roughly 14% of EU GDP, run competitive tenders with clear price benchmarks that concentrate buyer power. Contract tenors commonly span 10–25 years but periodic rebids reset project economics and pressure margins. Strict performance KPIs and penalties increase accountability and cash‑flow risk. Veolia’s broad, bundled service offering across ~50 countries supports premium pricing on proven contracts.
Large industrial clients
Large industrial clients negotiate global or multi-site frameworks and demand savings guarantees, with Veolia reporting 2024 revenue of €42.4bn that underscores reliance on big accounts; such clients can backward integrate into on-site treatment or energy-efficiency, raising supplier exposure. Customization increases switching costs and transparency on delivered value, while outcome-based pricing aligns interests but can squeeze margins if baselines are mis-set.

Price sensitivity and public scrutiny
Water and waste tariffs are politically sensitive, reinforcing buyer leverage over Veolia despite its €42.5 billion 2023 revenue; affordability caps and periodic regulatory reviews limit full pass-through of cost inflation. Affordability mechanisms (means-tested caps or subsidies) and multi-year tariff reviews constrain price flexibility. Demonstrable ESG outcomes and resilience improvements—measured in service continuity and emission reductions—support tariff acceptance. Clear communication and stakeholder engagement lower renegotiation risk.

Data and performance transparency
Digital dashboards in 2024 make service levels and costs directly comparable across bidders, driving apples-to-apples tendering and sharper pricing that squeezes margins and increases price transparency.
Differentiation must come from innovation, uptime and lifecycle value, while proprietary performance IP can temper pure price selection by demonstrating measurable long‑term savings and higher uptime.
- 2024: dashboards increase tender comparability
- Focus: innovation, uptime, lifecycle value
- Mitigator: proprietary performance IP
Contractual terms and risk transfer
Buyers increasingly demand allocation of energy, demand and compliance risk; accepting asymmetric risk can compress Veolia’s service margins and was a material negotiation point in 2024 when contract disputes and energy price volatility rose. Balanced clauses, indexation and pass-through mechanisms protect economics, and Veolia’s strong execution track record in 2024 improved its bargaining position.
- 2024: backlog and execution strength bolstered leverage
- Indexation limits margin erosion
- Asymmetric risk = margin compression
Procurement dashboards tighten margins; long 10–25y contracts delay repricing, rebids reset economics
Customers wield strong price leverage via competitive tenders (public procurement ~14% EU GDP) and digital dashboards that made 2024 bids more comparable, pressuring margins. Long contracts (10–25y) limit repricing but periodic rebids reset economics; Veolia reported 2024 revenue €42.4bn, underpinning dependence on large accounts. Outcome-based pricing and proprietary performance IP partially offset buyer bargaining power.
| Metric | 2024 value | Impact |
|---|---|---|
| Revenue | €42.4bn | Large-account dependence |
| Public procurement | ~14% EU GDP | High buyer power |
| Contract tenor | 10–25 years | Rebid risk |
| Dashboard comparability | Widespread 2024 | Tighter pricing |
What You See Is What You Get
Veolia Environnement Porter's Five Forces Analysis
This preview shows the exact Veolia Environnement Porter’s Five Forces analysis you’ll receive after purchase—fully formatted and ready to use. It evaluates supplier power, buyer power, competitive rivalry, threat of substitutes and new entrants with evidence-based assessments and actionable implications. No placeholders or samples; you’ll be able to download this identical file instantly upon payment.

From Overview to Strategy Blueprint
Veolia faces intense competitive rivalry across water, waste and energy services, with scale and regulation keeping new entrants at bay; buyer power is meaningful for large municipal contracts while supplier influence is moderate and substitutes are limited. This brief snapshot only scratches the surface. Unlock the full Porter's Five Forces Analysis to explore Veolia Environnement’s competitive dynamics in detail.
Suppliers Bargaining Power
Critical equipment and chemicals
Veolia depends on specialized membranes, pumps and treatment chemicals supplied by a small set of OEMs and formulators, concentrating supplier power and raising switching costs and lead times. Framework agreements and multi‑sourcing reduce dependence, while Veolia’s global scale — c.220,000 employees and multinational operations — strengthens bargaining to obtain volume discounts and enhanced technical support.
Energy and fuel inputs
Energy is a major operating input across Veolia’s water, waste and energy services; European electricity and gas price volatility remained elevated in 2024 after 2022–23 shocks, with spot swings exceeding 100% in some markets and compressing margins where pass-through clauses are weak. Hedging and index-linked contracts in service agreements and commodity hedges reduce exposure, while on-site energy self-generation from biogas and waste-to-energy plants provides partial insulation and lowers net fuel purchases.
Labor and specialized contractors
Skilled operators, engineers and certified technicians are critical for Veolia, which employed about 214,000 people worldwide in 2023, making specialized labor a powerful supplier segment. Strong union presence in France and local labor regulations raise bargaining leverage and operating rigidity. Veolia’s in‑house training programs and standardized procedures reduce reliance on external contractors, while investments in digital tools and automation are gradually lowering labor intensity and long‑term supplier dependency.
Technology and digital platforms
Advanced analytics, sensors and control systems for utilities often come from a concentrated vendor set, with the top five industrial automation suppliers holding roughly 60% of market share in 2024, creating supplier bargaining power and risk of vendor lock-in via proprietary protocols and data models.
- Open-architecture/API strategies preserve flexibility
- Co-development partnerships lower pricing pressure
- Vendor concentration ~60% (2024)
Waste feedstock and disposal capacity
Access to third-party landfills, MRFs and hazardous-treatment sites can become regionally bottlenecked, shifting leverage to suppliers as local gate fees rise when capacity tightens.
Long-term offtake contracts and capacity reservations (common in Veolia's sector) stabilize input costs and reduce exposure to spot-price spikes.
Vertical integration into disposal and recovery operations lowers reliance on external capacity and weakens supplier bargaining power.
- Regional bottlenecks → higher gate fees
- Long-term contracts → cost stability
- Vertical integration → reduced supplier leverage
Supplier concentration and energy volatility raise input risk; scale, hedging, offtakes mitigate
Supplier power is elevated for membranes, pumps and chemicals with top vendors concentrated (~60% market share, 2024), while energy volatility (spot swings >100% in some markets, 2024) and regional landfill bottlenecks raise input risk. Veolia’s scale (214,000 employees, 2023), long‑term offtakes, hedging and on‑site energy partially mitigate supplier leverage.
| Metric | Value |
|---|---|
| Top‑vendor concentration | ~60% (2024) |
| Energy spot volatility | >100% swings (2024) |
| Employees | 214,000 (2023) |
| Mitigants | Hedging, long‑term contracts, vertical integration |
What is included in the product
Detailed Word Document
Tailored Porter's Five Forces analysis of Veolia Environnement uncovering competitive intensity, supplier and buyer bargaining power, threat of substitutes and new entrants, and identifying disruptive forces and regulatory dynamics that shape its pricing, margins, and strategic positioning.
Customizable Excel Spreadsheet
Clear one-sheet Porter's Five Forces for Veolia Environnement that simplifies competitive pressures and regulatory risks into an executive-ready radar chart. Customize force levels, swap in your data, and drop directly into pitch decks or dashboards—no macros or finance expertise required.
Customers Bargaining Power
Municipal procurement and PPPs
Cities and utilities, representing public procurement worth roughly 14% of EU GDP, run competitive tenders with clear price benchmarks that concentrate buyer power. Contract tenors commonly span 10–25 years but periodic rebids reset project economics and pressure margins. Strict performance KPIs and penalties increase accountability and cash‑flow risk. Veolia’s broad, bundled service offering across ~50 countries supports premium pricing on proven contracts.
Large industrial clients
Large industrial clients negotiate global or multi-site frameworks and demand savings guarantees, with Veolia reporting 2024 revenue of €42.4bn that underscores reliance on big accounts; such clients can backward integrate into on-site treatment or energy-efficiency, raising supplier exposure. Customization increases switching costs and transparency on delivered value, while outcome-based pricing aligns interests but can squeeze margins if baselines are mis-set.
Price sensitivity and public scrutiny
Water and waste tariffs are politically sensitive, reinforcing buyer leverage over Veolia despite its €42.5 billion 2023 revenue; affordability caps and periodic regulatory reviews limit full pass-through of cost inflation. Affordability mechanisms (means-tested caps or subsidies) and multi-year tariff reviews constrain price flexibility. Demonstrable ESG outcomes and resilience improvements—measured in service continuity and emission reductions—support tariff acceptance. Clear communication and stakeholder engagement lower renegotiation risk.
Data and performance transparency
Digital dashboards in 2024 make service levels and costs directly comparable across bidders, driving apples-to-apples tendering and sharper pricing that squeezes margins and increases price transparency.
Differentiation must come from innovation, uptime and lifecycle value, while proprietary performance IP can temper pure price selection by demonstrating measurable long‑term savings and higher uptime.
- 2024: dashboards increase tender comparability
- Focus: innovation, uptime, lifecycle value
- Mitigator: proprietary performance IP
Contractual terms and risk transfer
Buyers increasingly demand allocation of energy, demand and compliance risk; accepting asymmetric risk can compress Veolia’s service margins and was a material negotiation point in 2024 when contract disputes and energy price volatility rose. Balanced clauses, indexation and pass-through mechanisms protect economics, and Veolia’s strong execution track record in 2024 improved its bargaining position.
- 2024: backlog and execution strength bolstered leverage
- Indexation limits margin erosion
- Asymmetric risk = margin compression
Procurement dashboards tighten margins; long 10–25y contracts delay repricing, rebids reset economics
Customers wield strong price leverage via competitive tenders (public procurement ~14% EU GDP) and digital dashboards that made 2024 bids more comparable, pressuring margins. Long contracts (10–25y) limit repricing but periodic rebids reset economics; Veolia reported 2024 revenue €42.4bn, underpinning dependence on large accounts. Outcome-based pricing and proprietary performance IP partially offset buyer bargaining power.
| Metric | 2024 value | Impact |
|---|---|---|
| Revenue | €42.4bn | Large-account dependence |
| Public procurement | ~14% EU GDP | High buyer power |
| Contract tenor | 10–25 years | Rebid risk |
| Dashboard comparability | Widespread 2024 | Tighter pricing |
What You See Is What You Get
Veolia Environnement Porter's Five Forces Analysis
This preview shows the exact Veolia Environnement Porter’s Five Forces analysis you’ll receive after purchase—fully formatted and ready to use. It evaluates supplier power, buyer power, competitive rivalry, threat of substitutes and new entrants with evidence-based assessments and actionable implications. No placeholders or samples; you’ll be able to download this identical file instantly upon payment.
Description
From Overview to Strategy Blueprint
Veolia faces intense competitive rivalry across water, waste and energy services, with scale and regulation keeping new entrants at bay; buyer power is meaningful for large municipal contracts while supplier influence is moderate and substitutes are limited. This brief snapshot only scratches the surface. Unlock the full Porter's Five Forces Analysis to explore Veolia Environnement’s competitive dynamics in detail.
Suppliers Bargaining Power
Critical equipment and chemicals
Veolia depends on specialized membranes, pumps and treatment chemicals supplied by a small set of OEMs and formulators, concentrating supplier power and raising switching costs and lead times. Framework agreements and multi‑sourcing reduce dependence, while Veolia’s global scale — c.220,000 employees and multinational operations — strengthens bargaining to obtain volume discounts and enhanced technical support.
Energy and fuel inputs
Energy is a major operating input across Veolia’s water, waste and energy services; European electricity and gas price volatility remained elevated in 2024 after 2022–23 shocks, with spot swings exceeding 100% in some markets and compressing margins where pass-through clauses are weak. Hedging and index-linked contracts in service agreements and commodity hedges reduce exposure, while on-site energy self-generation from biogas and waste-to-energy plants provides partial insulation and lowers net fuel purchases.
Labor and specialized contractors
Skilled operators, engineers and certified technicians are critical for Veolia, which employed about 214,000 people worldwide in 2023, making specialized labor a powerful supplier segment. Strong union presence in France and local labor regulations raise bargaining leverage and operating rigidity. Veolia’s in‑house training programs and standardized procedures reduce reliance on external contractors, while investments in digital tools and automation are gradually lowering labor intensity and long‑term supplier dependency.
Technology and digital platforms
Advanced analytics, sensors and control systems for utilities often come from a concentrated vendor set, with the top five industrial automation suppliers holding roughly 60% of market share in 2024, creating supplier bargaining power and risk of vendor lock-in via proprietary protocols and data models.
- Open-architecture/API strategies preserve flexibility
- Co-development partnerships lower pricing pressure
- Vendor concentration ~60% (2024)
Waste feedstock and disposal capacity
Access to third-party landfills, MRFs and hazardous-treatment sites can become regionally bottlenecked, shifting leverage to suppliers as local gate fees rise when capacity tightens.
Long-term offtake contracts and capacity reservations (common in Veolia's sector) stabilize input costs and reduce exposure to spot-price spikes.
Vertical integration into disposal and recovery operations lowers reliance on external capacity and weakens supplier bargaining power.
- Regional bottlenecks → higher gate fees
- Long-term contracts → cost stability
- Vertical integration → reduced supplier leverage
Supplier concentration and energy volatility raise input risk; scale, hedging, offtakes mitigate
Supplier power is elevated for membranes, pumps and chemicals with top vendors concentrated (~60% market share, 2024), while energy volatility (spot swings >100% in some markets, 2024) and regional landfill bottlenecks raise input risk. Veolia’s scale (214,000 employees, 2023), long‑term offtakes, hedging and on‑site energy partially mitigate supplier leverage.
| Metric | Value |
|---|---|
| Top‑vendor concentration | ~60% (2024) |
| Energy spot volatility | >100% swings (2024) |
| Employees | 214,000 (2023) |
| Mitigants | Hedging, long‑term contracts, vertical integration |
What is included in the product
Detailed Word Document
Tailored Porter's Five Forces analysis of Veolia Environnement uncovering competitive intensity, supplier and buyer bargaining power, threat of substitutes and new entrants, and identifying disruptive forces and regulatory dynamics that shape its pricing, margins, and strategic positioning.
Customizable Excel Spreadsheet
Clear one-sheet Porter's Five Forces for Veolia Environnement that simplifies competitive pressures and regulatory risks into an executive-ready radar chart. Customize force levels, swap in your data, and drop directly into pitch decks or dashboards—no macros or finance expertise required.
Customers Bargaining Power
Municipal procurement and PPPs
Cities and utilities, representing public procurement worth roughly 14% of EU GDP, run competitive tenders with clear price benchmarks that concentrate buyer power. Contract tenors commonly span 10–25 years but periodic rebids reset project economics and pressure margins. Strict performance KPIs and penalties increase accountability and cash‑flow risk. Veolia’s broad, bundled service offering across ~50 countries supports premium pricing on proven contracts.
Large industrial clients
Large industrial clients negotiate global or multi-site frameworks and demand savings guarantees, with Veolia reporting 2024 revenue of €42.4bn that underscores reliance on big accounts; such clients can backward integrate into on-site treatment or energy-efficiency, raising supplier exposure. Customization increases switching costs and transparency on delivered value, while outcome-based pricing aligns interests but can squeeze margins if baselines are mis-set.
Price sensitivity and public scrutiny
Water and waste tariffs are politically sensitive, reinforcing buyer leverage over Veolia despite its €42.5 billion 2023 revenue; affordability caps and periodic regulatory reviews limit full pass-through of cost inflation. Affordability mechanisms (means-tested caps or subsidies) and multi-year tariff reviews constrain price flexibility. Demonstrable ESG outcomes and resilience improvements—measured in service continuity and emission reductions—support tariff acceptance. Clear communication and stakeholder engagement lower renegotiation risk.
Data and performance transparency
Digital dashboards in 2024 make service levels and costs directly comparable across bidders, driving apples-to-apples tendering and sharper pricing that squeezes margins and increases price transparency.
Differentiation must come from innovation, uptime and lifecycle value, while proprietary performance IP can temper pure price selection by demonstrating measurable long‑term savings and higher uptime.
- 2024: dashboards increase tender comparability
- Focus: innovation, uptime, lifecycle value
- Mitigator: proprietary performance IP
Contractual terms and risk transfer
Buyers increasingly demand allocation of energy, demand and compliance risk; accepting asymmetric risk can compress Veolia’s service margins and was a material negotiation point in 2024 when contract disputes and energy price volatility rose. Balanced clauses, indexation and pass-through mechanisms protect economics, and Veolia’s strong execution track record in 2024 improved its bargaining position.
- 2024: backlog and execution strength bolstered leverage
- Indexation limits margin erosion
- Asymmetric risk = margin compression
Procurement dashboards tighten margins; long 10–25y contracts delay repricing, rebids reset economics
Customers wield strong price leverage via competitive tenders (public procurement ~14% EU GDP) and digital dashboards that made 2024 bids more comparable, pressuring margins. Long contracts (10–25y) limit repricing but periodic rebids reset economics; Veolia reported 2024 revenue €42.4bn, underpinning dependence on large accounts. Outcome-based pricing and proprietary performance IP partially offset buyer bargaining power.
| Metric | 2024 value | Impact |
|---|---|---|
| Revenue | €42.4bn | Large-account dependence |
| Public procurement | ~14% EU GDP | High buyer power |
| Contract tenor | 10–25 years | Rebid risk |
| Dashboard comparability | Widespread 2024 | Tighter pricing |
What You See Is What You Get
Veolia Environnement Porter's Five Forces Analysis
This preview shows the exact Veolia Environnement Porter’s Five Forces analysis you’ll receive after purchase—fully formatted and ready to use. It evaluates supplier power, buyer power, competitive rivalry, threat of substitutes and new entrants with evidence-based assessments and actionable implications. No placeholders or samples; you’ll be able to download this identical file instantly upon payment.











