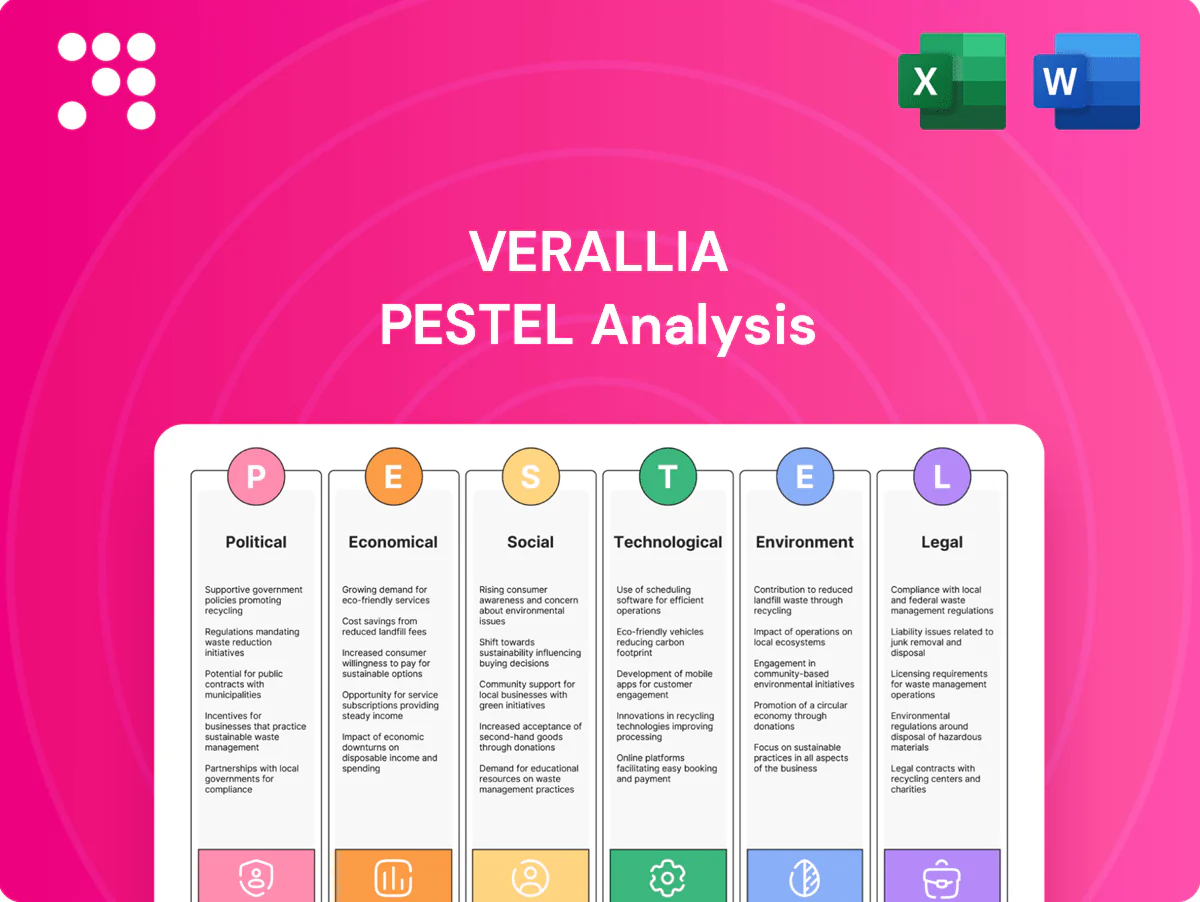
Verallia PESTLE Analysis

Your Shortcut to Market Insight Starts Here
Discover how political shifts, economic cycles, and environmental regulation are reshaping Verallia's strategic outlook. Our PESTLE analysis highlights regulatory risks, supply-chain pressures, and sustainability opportunities that matter to investors and managers. Buy the full report for a complete, actionable breakdown ready for presentations and decision-making.
Political factors

EU industrial policy
Brussels’ Green Deal (EU climate-neutrality by 2050) and Industrial Plan shape energy, recycling and investment incentives across Verallia’s markets; NextGenerationEU mobilised €750bn while the Innovation Fund is expected to channel about €38bn (2020–2030) to low-carbon projects. Subsidies for decarbonisation and circularity can materially reduce capex for furnaces and cullet systems. The CBAM transition (reporting 2023–25, full charges from 2026) and evolving state aid rules alter competitiveness versus non‑EU glassmakers; monitoring EU funding cycles is key to timing capacity upgrades.
Energy security agendas
Government responses to gas supply volatility—eg EU rules to keep gas storage at 90% by Nov 1—directly affect fuel availability and prices for Verallia’s energy‑intensive glass melting. Strategic reserves, new LNG regas capacity and temporary price caps can stabilize inputs but often only short‑term. National hydrogen infrastructure targets (EU 10 Mt import target by 2030) shape fuel‑switch roadmaps. Political tensions can sharply reprice site risk in exposed geographies.

Trade tariffs and barriers
Import duties and anti‑dumping measures can raise bottle and packaging costs versus local makers given a 2023 world average MFN tariff of about 3.6% (WTO); sanctions also constrain cross‑border flows. Local content rules in markets such as Brazil and India favor domestic footprints, pressuring imports. New rules‑of‑origin and customs delays (global average container dwell times ~5 days in 2023) disrupt service levels. Verallia’s 32 plants in 11 countries mitigate but do not eliminate exposure.

Public health and alcohol policy
Political stability and permits
Plant expansions at Verallia depend on predictable zoning, permitting and local approvals; EU reports show environmental permitting often takes 6–24 months, which can push multi‑year furnace rebuilds into longer timelines. Elections and cabinet changes at municipal or national levels have delayed construction permits in recent cases, increasing execution risk for capital‑intensive projects. Local hiring incentives and grants—used by several European regions—can materially offset upfront capex.
- Permitting timelines: 6–24 months
- Furnace rebuilds: multi‑year execution risk
- Local incentives: can reduce net capex
- Political stability: lowers schedule and cost volatility
EU funds €750bn/€38bn, CBAM 2026; DRS cullet 80–90%; gas 90% storage
EU Green Deal/NextGenerationEU (€750bn) and Innovation Fund (~€38bn 2020–30) drive subsidies; CBAM full charges from 2026 shift competitiveness. Gas rules (90% storage by Nov 1) and hydrogen targets (EU 10 Mt import target 2030) affect fuel costs. DRS can boost cullet returns ~40%→80–90%; permitting averages 6–24 months; Verallia: 32 plants, 11 countries.
| Factor | Data (2024/25) | Impact |
|---|---|---|
| EU funding | €750bn/€38bn | Low‑carbon capex support |
| CBAM | Full 2026 | Price parity shift |
| Permitting | 6–24 months | Project delay risk |
What is included in the product
 Detailed Word Document
Explores how macro-environmental factors uniquely affect Verallia across Political, Economic, Social, Technological, Environmental and Legal dimensions, with region- and industry-specific data and trends. Delivered in clean, ready-to-use format for executives, investors and strategists, the analysis includes detailed sub-points and forward-looking insights to support scenario planning and risk/opportunity identification.

 Customizable Excel Spreadsheet
A concise, visually segmented PESTLE summary for Verallia that can be dropped into presentations, shared across teams, and annotated for regional or business-line specifics to streamline strategic planning and risk discussions.
Economic factors

Energy price volatility
Gas and electricity — about 25% of production costs for glass packaging — drive furnace economics, with Dutch TTF averaging ~40€/MWh in 2024 and industrial electricity in Western Europe near 120€/MWh, squeezing margins. Hedging limits short‑term swings but cannot offset structural shifts in supply or carbon policy. Electrification and alternative fuels progressively lower gas exposure over years, changing long‑run cost curves. Robust pass‑through clauses are vital to protect contribution.
Consumer demand cycles
Food, beer, wine and spirits volumes closely follow disposable income and tourism — world wine consumption was about 244 million hectoliters in 2023 (OIV) while EU tourist nights recovered to roughly 95% of 2019 levels in 2023 (Eurostat), supporting glass demand. Premiumization drives heavier, higher‑value bottles in upcycles; downturns shift volumes to cost‑effective formats and private labels. Verallia mitigates swings via mix management and flexible capacity, smoothing earnings volatility.

Input costs and cullet supply
Soda ash, sand and cullet price moves directly drive Verallia’s COGS and margins, with soda ash around $400/t in 2024 affecting batch costs. High cullet rates improve unit economics: each 10% additional cullet typically cuts furnace energy use ~2.5% and CO2 emissions ~5%, reducing per‑unit cost and emissions. Competition for high‑quality cullet tightens regional supply, so long‑term contracts and DRS participation secure feedstock and price stability.

FX and regional exposure
Verallia records revenue and costs in euro, Brazilian real, Argentine and Mexican pesos and other currencies, so FX swings materially alter reported earnings and investment returns; local manufacturing mitigates transaction exposure but not translation of foreign subsidiaries into euros. Its diversified regional footprint cushions the group when recoveries diverge across markets.
- Currency mix: euro, BRL, ARS, MXN
- Hedging: reduces transaction risk, leaves translation risk
- Resilience: balanced Europe/Latin America presence
Capital intensity and ROIC
Furnaces typically need full rebuilds every 8–12 years, requiring downtime and capex often in the tens of millions of euros; this drives Verallia's high capital intensity and planning cycles. Efficiency upgrades and waste‑heat recovery (WHR can cut thermal energy use by up to 25%) raise throughput and asset productivity. Strong pricing discipline and indexation in 2023–24 supported cash conversion, while SKU and plant portfolio optimization lifts ROIC.
- capital intensity: periodic tens‑of‑millions € rebuilds
- efficiency: WHR can reduce energy use up to 25%
- pricing: indexation supports cash conversion (2023–24)
- portfolio: plant/SKU rationalization raises ROIC
EU funds €750bn/€38bn, CBAM 2026; DRS cullet 80–90%; gas 90% storage
Energy (TTF ~40€/MWh in 2024; industrial power ~120€/MWh) and soda ash (~$400/t in 2024) drive ~25% production cost; hedging limits swings but not structural shocks. Demand ties to disposable income and tourism (world wine 244m hl in 2023; EU tourist nights ~95% of 2019 in 2023). High cullet rates each +10% cut energy ~2.5% and CO2 ~5%; furnaces rebuild every 8–12 years.
| Metric | 2023–24 |
|---|---|
| TTF / Industrial power | ~40€/MWh / ~120€/MWh |
| World wine | 244m hl (2023) |
| Soda ash | ~$400/t (2024) |
| Cullet impact | +10% → −2.5% energy, −5% CO2 |
| Rebuild cycle | 8–12 years |
Full Version Awaits
Verallia PESTLE Analysis
The Verallia PESTLE Analysis preview shown here is the exact document you’ll receive after purchase—fully formatted and ready to use. It covers political, economic, social, technological, legal, and environmental factors specific to Verallia. What you see is the real, finished file with no placeholders or surprises. You’ll download this same professionally structured document immediately after buying.

Your Shortcut to Market Insight Starts Here
Discover how political shifts, economic cycles, and environmental regulation are reshaping Verallia's strategic outlook. Our PESTLE analysis highlights regulatory risks, supply-chain pressures, and sustainability opportunities that matter to investors and managers. Buy the full report for a complete, actionable breakdown ready for presentations and decision-making.
Political factors
EU industrial policy
Brussels’ Green Deal (EU climate-neutrality by 2050) and Industrial Plan shape energy, recycling and investment incentives across Verallia’s markets; NextGenerationEU mobilised €750bn while the Innovation Fund is expected to channel about €38bn (2020–2030) to low-carbon projects. Subsidies for decarbonisation and circularity can materially reduce capex for furnaces and cullet systems. The CBAM transition (reporting 2023–25, full charges from 2026) and evolving state aid rules alter competitiveness versus non‑EU glassmakers; monitoring EU funding cycles is key to timing capacity upgrades.
Energy security agendas
Government responses to gas supply volatility—eg EU rules to keep gas storage at 90% by Nov 1—directly affect fuel availability and prices for Verallia’s energy‑intensive glass melting. Strategic reserves, new LNG regas capacity and temporary price caps can stabilize inputs but often only short‑term. National hydrogen infrastructure targets (EU 10 Mt import target by 2030) shape fuel‑switch roadmaps. Political tensions can sharply reprice site risk in exposed geographies.
Trade tariffs and barriers
Import duties and anti‑dumping measures can raise bottle and packaging costs versus local makers given a 2023 world average MFN tariff of about 3.6% (WTO); sanctions also constrain cross‑border flows. Local content rules in markets such as Brazil and India favor domestic footprints, pressuring imports. New rules‑of‑origin and customs delays (global average container dwell times ~5 days in 2023) disrupt service levels. Verallia’s 32 plants in 11 countries mitigate but do not eliminate exposure.
Public health and alcohol policy
Political stability and permits
Plant expansions at Verallia depend on predictable zoning, permitting and local approvals; EU reports show environmental permitting often takes 6–24 months, which can push multi‑year furnace rebuilds into longer timelines. Elections and cabinet changes at municipal or national levels have delayed construction permits in recent cases, increasing execution risk for capital‑intensive projects. Local hiring incentives and grants—used by several European regions—can materially offset upfront capex.
- Permitting timelines: 6–24 months
- Furnace rebuilds: multi‑year execution risk
- Local incentives: can reduce net capex
- Political stability: lowers schedule and cost volatility
EU funds €750bn/€38bn, CBAM 2026; DRS cullet 80–90%; gas 90% storage
EU Green Deal/NextGenerationEU (€750bn) and Innovation Fund (~€38bn 2020–30) drive subsidies; CBAM full charges from 2026 shift competitiveness. Gas rules (90% storage by Nov 1) and hydrogen targets (EU 10 Mt import target 2030) affect fuel costs. DRS can boost cullet returns ~40%→80–90%; permitting averages 6–24 months; Verallia: 32 plants, 11 countries.
| Factor | Data (2024/25) | Impact |
|---|---|---|
| EU funding | €750bn/€38bn | Low‑carbon capex support |
| CBAM | Full 2026 | Price parity shift |
| Permitting | 6–24 months | Project delay risk |
What is included in the product
Detailed Word Document
Explores how macro-environmental factors uniquely affect Verallia across Political, Economic, Social, Technological, Environmental and Legal dimensions, with region- and industry-specific data and trends. Delivered in clean, ready-to-use format for executives, investors and strategists, the analysis includes detailed sub-points and forward-looking insights to support scenario planning and risk/opportunity identification.
Customizable Excel Spreadsheet
A concise, visually segmented PESTLE summary for Verallia that can be dropped into presentations, shared across teams, and annotated for regional or business-line specifics to streamline strategic planning and risk discussions.
Economic factors
Energy price volatility
Gas and electricity — about 25% of production costs for glass packaging — drive furnace economics, with Dutch TTF averaging ~40€/MWh in 2024 and industrial electricity in Western Europe near 120€/MWh, squeezing margins. Hedging limits short‑term swings but cannot offset structural shifts in supply or carbon policy. Electrification and alternative fuels progressively lower gas exposure over years, changing long‑run cost curves. Robust pass‑through clauses are vital to protect contribution.
Consumer demand cycles
Food, beer, wine and spirits volumes closely follow disposable income and tourism — world wine consumption was about 244 million hectoliters in 2023 (OIV) while EU tourist nights recovered to roughly 95% of 2019 levels in 2023 (Eurostat), supporting glass demand. Premiumization drives heavier, higher‑value bottles in upcycles; downturns shift volumes to cost‑effective formats and private labels. Verallia mitigates swings via mix management and flexible capacity, smoothing earnings volatility.
Input costs and cullet supply
Soda ash, sand and cullet price moves directly drive Verallia’s COGS and margins, with soda ash around $400/t in 2024 affecting batch costs. High cullet rates improve unit economics: each 10% additional cullet typically cuts furnace energy use ~2.5% and CO2 emissions ~5%, reducing per‑unit cost and emissions. Competition for high‑quality cullet tightens regional supply, so long‑term contracts and DRS participation secure feedstock and price stability.
FX and regional exposure
Verallia records revenue and costs in euro, Brazilian real, Argentine and Mexican pesos and other currencies, so FX swings materially alter reported earnings and investment returns; local manufacturing mitigates transaction exposure but not translation of foreign subsidiaries into euros. Its diversified regional footprint cushions the group when recoveries diverge across markets.
- Currency mix: euro, BRL, ARS, MXN
- Hedging: reduces transaction risk, leaves translation risk
- Resilience: balanced Europe/Latin America presence
Capital intensity and ROIC
Furnaces typically need full rebuilds every 8–12 years, requiring downtime and capex often in the tens of millions of euros; this drives Verallia's high capital intensity and planning cycles. Efficiency upgrades and waste‑heat recovery (WHR can cut thermal energy use by up to 25%) raise throughput and asset productivity. Strong pricing discipline and indexation in 2023–24 supported cash conversion, while SKU and plant portfolio optimization lifts ROIC.
- capital intensity: periodic tens‑of‑millions € rebuilds
- efficiency: WHR can reduce energy use up to 25%
- pricing: indexation supports cash conversion (2023–24)
- portfolio: plant/SKU rationalization raises ROIC
EU funds €750bn/€38bn, CBAM 2026; DRS cullet 80–90%; gas 90% storage
Energy (TTF ~40€/MWh in 2024; industrial power ~120€/MWh) and soda ash (~$400/t in 2024) drive ~25% production cost; hedging limits swings but not structural shocks. Demand ties to disposable income and tourism (world wine 244m hl in 2023; EU tourist nights ~95% of 2019 in 2023). High cullet rates each +10% cut energy ~2.5% and CO2 ~5%; furnaces rebuild every 8–12 years.
| Metric | 2023–24 |
|---|---|
| TTF / Industrial power | ~40€/MWh / ~120€/MWh |
| World wine | 244m hl (2023) |
| Soda ash | ~$400/t (2024) |
| Cullet impact | +10% → −2.5% energy, −5% CO2 |
| Rebuild cycle | 8–12 years |
Full Version Awaits
Verallia PESTLE Analysis
The Verallia PESTLE Analysis preview shown here is the exact document you’ll receive after purchase—fully formatted and ready to use. It covers political, economic, social, technological, legal, and environmental factors specific to Verallia. What you see is the real, finished file with no placeholders or surprises. You’ll download this same professionally structured document immediately after buying.
Original: $10.00
-65%$10.00
$3.50Description
Your Shortcut to Market Insight Starts Here
Discover how political shifts, economic cycles, and environmental regulation are reshaping Verallia's strategic outlook. Our PESTLE analysis highlights regulatory risks, supply-chain pressures, and sustainability opportunities that matter to investors and managers. Buy the full report for a complete, actionable breakdown ready for presentations and decision-making.
Political factors
EU industrial policy
Brussels’ Green Deal (EU climate-neutrality by 2050) and Industrial Plan shape energy, recycling and investment incentives across Verallia’s markets; NextGenerationEU mobilised €750bn while the Innovation Fund is expected to channel about €38bn (2020–2030) to low-carbon projects. Subsidies for decarbonisation and circularity can materially reduce capex for furnaces and cullet systems. The CBAM transition (reporting 2023–25, full charges from 2026) and evolving state aid rules alter competitiveness versus non‑EU glassmakers; monitoring EU funding cycles is key to timing capacity upgrades.
Energy security agendas
Government responses to gas supply volatility—eg EU rules to keep gas storage at 90% by Nov 1—directly affect fuel availability and prices for Verallia’s energy‑intensive glass melting. Strategic reserves, new LNG regas capacity and temporary price caps can stabilize inputs but often only short‑term. National hydrogen infrastructure targets (EU 10 Mt import target by 2030) shape fuel‑switch roadmaps. Political tensions can sharply reprice site risk in exposed geographies.
Trade tariffs and barriers
Import duties and anti‑dumping measures can raise bottle and packaging costs versus local makers given a 2023 world average MFN tariff of about 3.6% (WTO); sanctions also constrain cross‑border flows. Local content rules in markets such as Brazil and India favor domestic footprints, pressuring imports. New rules‑of‑origin and customs delays (global average container dwell times ~5 days in 2023) disrupt service levels. Verallia’s 32 plants in 11 countries mitigate but do not eliminate exposure.
Public health and alcohol policy
Political stability and permits
Plant expansions at Verallia depend on predictable zoning, permitting and local approvals; EU reports show environmental permitting often takes 6–24 months, which can push multi‑year furnace rebuilds into longer timelines. Elections and cabinet changes at municipal or national levels have delayed construction permits in recent cases, increasing execution risk for capital‑intensive projects. Local hiring incentives and grants—used by several European regions—can materially offset upfront capex.
- Permitting timelines: 6–24 months
- Furnace rebuilds: multi‑year execution risk
- Local incentives: can reduce net capex
- Political stability: lowers schedule and cost volatility
EU funds €750bn/€38bn, CBAM 2026; DRS cullet 80–90%; gas 90% storage
EU Green Deal/NextGenerationEU (€750bn) and Innovation Fund (~€38bn 2020–30) drive subsidies; CBAM full charges from 2026 shift competitiveness. Gas rules (90% storage by Nov 1) and hydrogen targets (EU 10 Mt import target 2030) affect fuel costs. DRS can boost cullet returns ~40%→80–90%; permitting averages 6–24 months; Verallia: 32 plants, 11 countries.
| Factor | Data (2024/25) | Impact |
|---|---|---|
| EU funding | €750bn/€38bn | Low‑carbon capex support |
| CBAM | Full 2026 | Price parity shift |
| Permitting | 6–24 months | Project delay risk |
What is included in the product
Detailed Word Document
Explores how macro-environmental factors uniquely affect Verallia across Political, Economic, Social, Technological, Environmental and Legal dimensions, with region- and industry-specific data and trends. Delivered in clean, ready-to-use format for executives, investors and strategists, the analysis includes detailed sub-points and forward-looking insights to support scenario planning and risk/opportunity identification.
Customizable Excel Spreadsheet
A concise, visually segmented PESTLE summary for Verallia that can be dropped into presentations, shared across teams, and annotated for regional or business-line specifics to streamline strategic planning and risk discussions.
Economic factors
Energy price volatility
Gas and electricity — about 25% of production costs for glass packaging — drive furnace economics, with Dutch TTF averaging ~40€/MWh in 2024 and industrial electricity in Western Europe near 120€/MWh, squeezing margins. Hedging limits short‑term swings but cannot offset structural shifts in supply or carbon policy. Electrification and alternative fuels progressively lower gas exposure over years, changing long‑run cost curves. Robust pass‑through clauses are vital to protect contribution.
Consumer demand cycles
Food, beer, wine and spirits volumes closely follow disposable income and tourism — world wine consumption was about 244 million hectoliters in 2023 (OIV) while EU tourist nights recovered to roughly 95% of 2019 levels in 2023 (Eurostat), supporting glass demand. Premiumization drives heavier, higher‑value bottles in upcycles; downturns shift volumes to cost‑effective formats and private labels. Verallia mitigates swings via mix management and flexible capacity, smoothing earnings volatility.
Input costs and cullet supply
Soda ash, sand and cullet price moves directly drive Verallia’s COGS and margins, with soda ash around $400/t in 2024 affecting batch costs. High cullet rates improve unit economics: each 10% additional cullet typically cuts furnace energy use ~2.5% and CO2 emissions ~5%, reducing per‑unit cost and emissions. Competition for high‑quality cullet tightens regional supply, so long‑term contracts and DRS participation secure feedstock and price stability.
FX and regional exposure
Verallia records revenue and costs in euro, Brazilian real, Argentine and Mexican pesos and other currencies, so FX swings materially alter reported earnings and investment returns; local manufacturing mitigates transaction exposure but not translation of foreign subsidiaries into euros. Its diversified regional footprint cushions the group when recoveries diverge across markets.
- Currency mix: euro, BRL, ARS, MXN
- Hedging: reduces transaction risk, leaves translation risk
- Resilience: balanced Europe/Latin America presence
Capital intensity and ROIC
Furnaces typically need full rebuilds every 8–12 years, requiring downtime and capex often in the tens of millions of euros; this drives Verallia's high capital intensity and planning cycles. Efficiency upgrades and waste‑heat recovery (WHR can cut thermal energy use by up to 25%) raise throughput and asset productivity. Strong pricing discipline and indexation in 2023–24 supported cash conversion, while SKU and plant portfolio optimization lifts ROIC.
- capital intensity: periodic tens‑of‑millions € rebuilds
- efficiency: WHR can reduce energy use up to 25%
- pricing: indexation supports cash conversion (2023–24)
- portfolio: plant/SKU rationalization raises ROIC
EU funds €750bn/€38bn, CBAM 2026; DRS cullet 80–90%; gas 90% storage
Energy (TTF ~40€/MWh in 2024; industrial power ~120€/MWh) and soda ash (~$400/t in 2024) drive ~25% production cost; hedging limits swings but not structural shocks. Demand ties to disposable income and tourism (world wine 244m hl in 2023; EU tourist nights ~95% of 2019 in 2023). High cullet rates each +10% cut energy ~2.5% and CO2 ~5%; furnaces rebuild every 8–12 years.
| Metric | 2023–24 |
|---|---|
| TTF / Industrial power | ~40€/MWh / ~120€/MWh |
| World wine | 244m hl (2023) |
| Soda ash | ~$400/t (2024) |
| Cullet impact | +10% → −2.5% energy, −5% CO2 |
| Rebuild cycle | 8–12 years |
Full Version Awaits
Verallia PESTLE Analysis
The Verallia PESTLE Analysis preview shown here is the exact document you’ll receive after purchase—fully formatted and ready to use. It covers political, economic, social, technological, legal, and environmental factors specific to Verallia. What you see is the real, finished file with no placeholders or surprises. You’ll download this same professionally structured document immediately after buying.











